. 2016 Apr 6;90(1):152-164.
doi: 10.1016/j.neuron.2016.02.028. Epub 2016 Mar 17.

Gamma and Beta Bursts Underlie Working Memory

Affiliations

Gamma and Beta Bursts Underlie Working Memory

Mikael Lundqvist et al. Neuron. .

Abstract

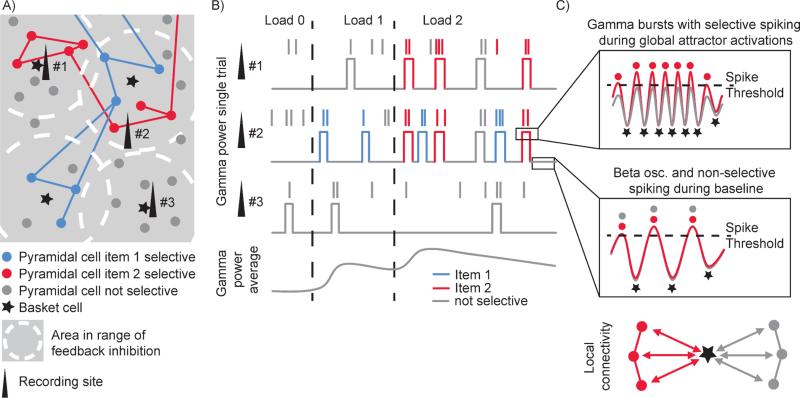
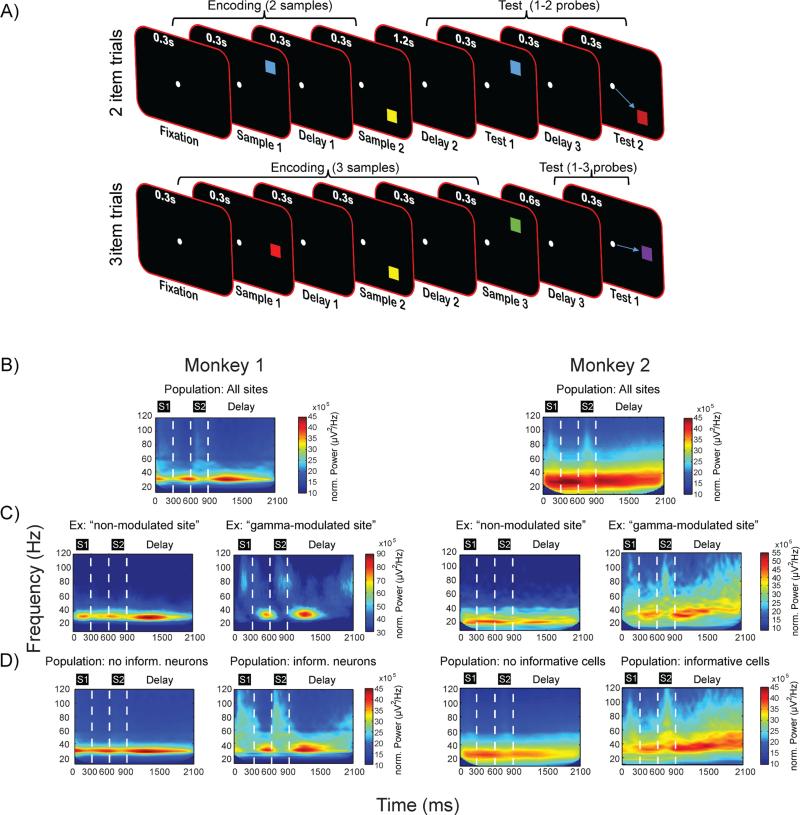
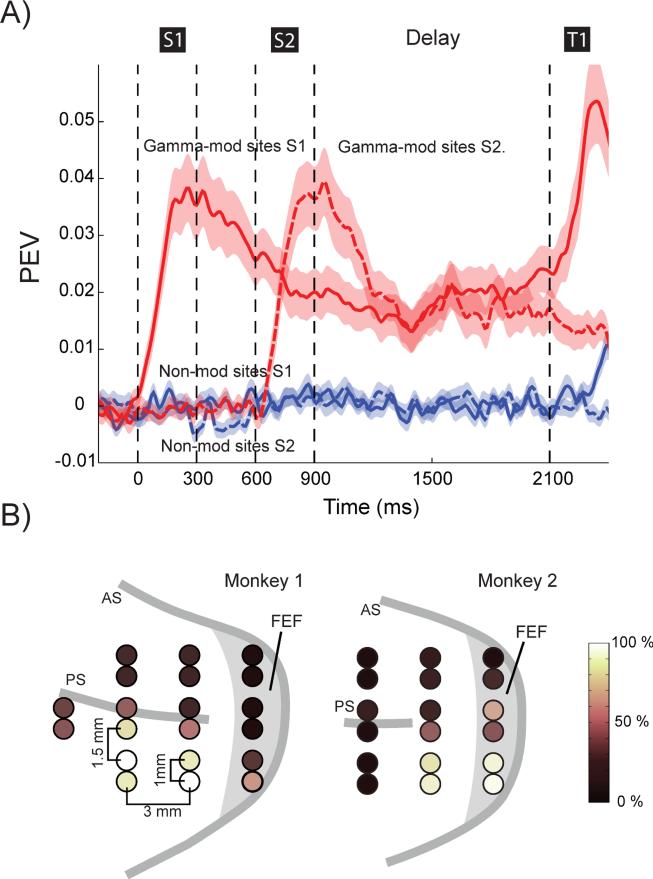
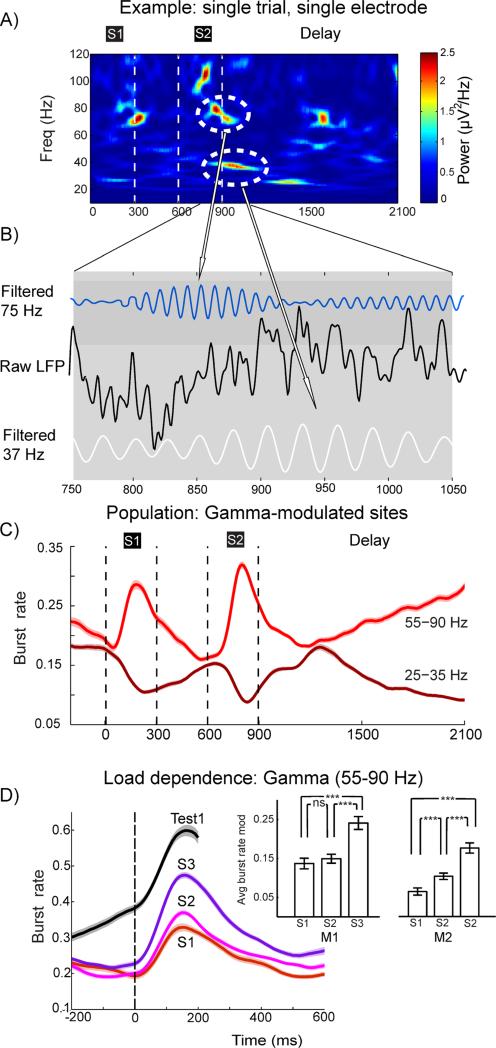
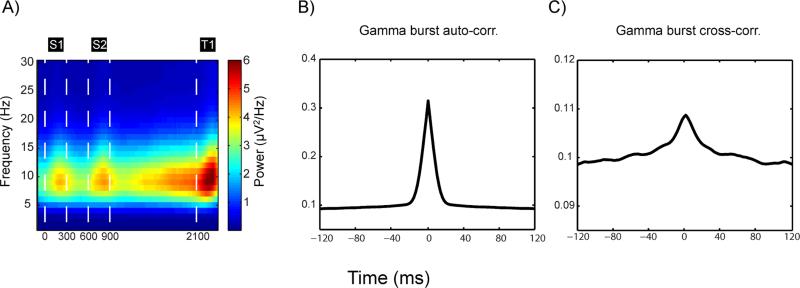
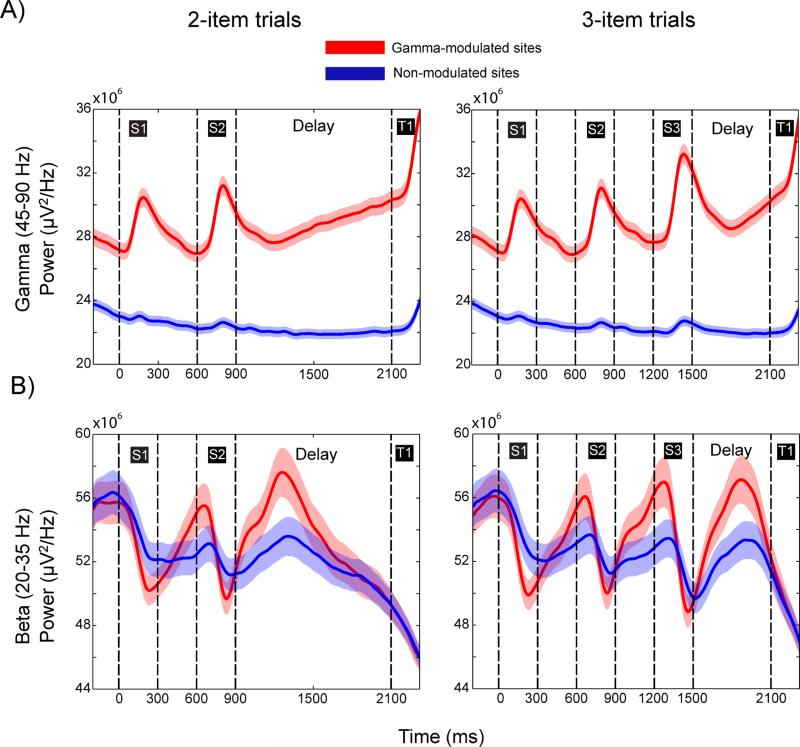
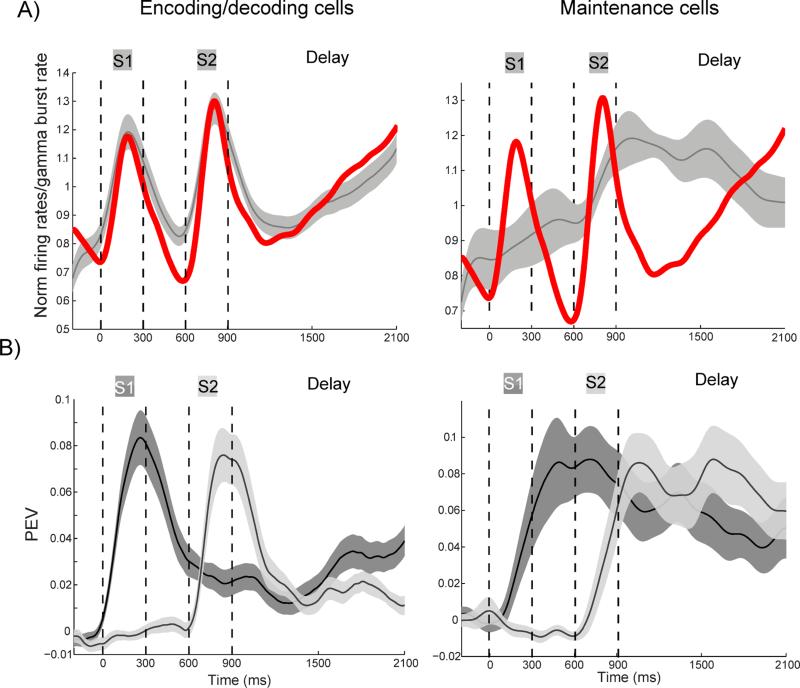
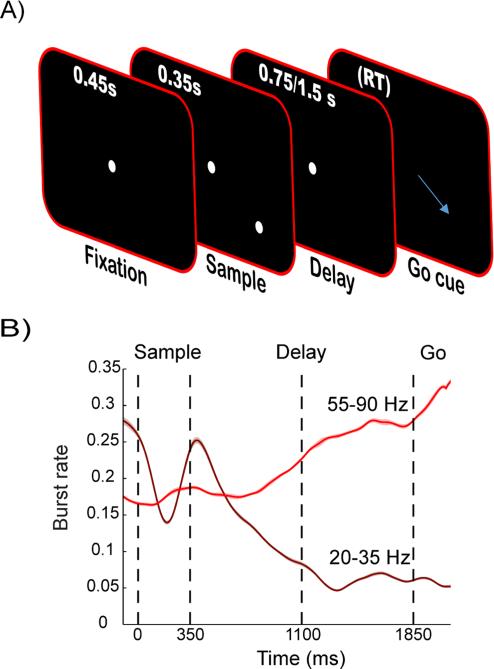
Working memory is thought to result from sustained neuron spiking. However, computational models suggest complex dynamics with discrete oscillatory bursts. We analyzed local field potential (LFP) and spiking from the prefrontal cortex (PFC) of monkeys performing a working memory task. There were brief bursts of narrow-band gamma oscillations (45-100 Hz), varied in time and frequency, accompanying encoding and re-activation of sensory information. They appeared at a minority of recording sites associated with spiking reflecting the to-be-remembered items. Beta oscillations (20-35 Hz) also occurred in brief, variable bursts but reflected a default state interrupted by encoding and decoding. Only activity of neurons reflecting encoding/decoding correlated with changes in gamma burst rate. Thus, gamma bursts could gate access to, and prevent sensory interference with, working memory. This supports the hypothesis that working memory is manifested by discrete oscillatory dynamics and spiking, not sustained activity.


Figures

Figure 1
Figure 1
Schematic view of the model and model predictions. A) Spatial organization of network. Locally, cells coding for the same stimulus are recurrently connected into local clusters. Several competing clusters share feedback inhibition from nearby inhibitory basket cells. Cell assemblies are formed by recurrent long-range connections connecting several spatially distributed local clusters, each receiving inhibition from a distinct pool of basket cells. B) The network displays non-linear attractor dynamics in which various cell assemblies are briefly activated. These activations are initially triggered by stimuli. Following a cell assembly activation, the synapses in the recurrent connections will be potentiated within a certain time window. This will cause the assembly to spontaneously reactivate once it has been triggered by an external stimulus. In this way information about multiple stimuli can be held in working memory with attractors, which code for various external stimuli, taking turns in a sequence of reactivations. In the LFP, these activations should be manifested as non-linear transitions into short-lived states with high narrow-band gamma power. These high power states should become more common in selective sites (but not in non-selective sites, compare site #1 and #2 with #3) as working memory load increases, leading to enhanced average gamma power with load. C) Oscillations (top) are created by local feedback inhibition (bottom) shared by several local clusters of pyramidal cells. During baseline the oscillations are in the beta range, and cells from all clusters spike at a similar rate. During attractor activations, there is a slight excitatory bias (from the recurrent connections and assembly specific synaptic potentiation) in one of the assemblies causing this group to consistently reach firing threshold first after each wave of feedback inhibition. As they spike, they activate a new wave of feedback inhibition, shutting down the rest of the cells. Computationally, this creates a winner-take-all dynamics with spiking only in the (temporarily) most excitable assembly coding for a stimulus. This selectivity in firing implies that the stimulus information conveyed by the corresponding neurons increases. The increased excitation in this state speeds up the oscillations to gamma range.
Fig. 2
Fig. 2
Experimental setup and LFP spectral power. A) Each trial consisted of three phases: encoding, delay and test. Following fixation on a white dot in the center of the screen, two (top) or three (bottom) colored squares were sequentially presented to the monkeys. Following a delay period, the stimulus sequence was repeated with the color of one square changed. The monkeys were rewarded for a saccade to the changed square. B-D) Spectrograms, not normalized to baseline, of raw LFPs for monkey M1 (left) and M2 (right). The following is displayed for each monkey: B) Average spectrogram from all electrodes and correct trials during encoding (time 0 refers to the onset of the first stimulus) and delay in 2 item trials. S1-S2 refers to sample 1-2, respectively. C) Example of spectrograms from single electrodes, recorded the same day, that display non-modulated (left) or gamma-modulated profiles (right). D) Average spectrograms from all electrodes in two-item trials including (right) or excluding (left) neurons that carry information about the presented squares. Power in all spectrograms estimated using multi-taper time-frequency analysis (Experimental Procedures). See also Figure S1, S2 and S3.
Fig. 3
Fig. 3
Anatomical location and information on gamma-modulated sites. A) The average information measured using PEV from all cells recorded from gamma-modulated (red) or non-modulated (blue) sites at the time of stimulus presentations (time 0 refers to the onset of the first stimulus). S1-S2 refers to sample 1-2. B) The layout of the grid used for inserting the electrodes for monkey M1 (left) and M2 (right). Circles denote recording locations and color code describes the across-session likelihood that an electrode at that particular site displayed increased gamma power during stimulus presentations (gamma-modulated site). See also Figure S4 and S5.
Fig. 4
Fig. 4
Oscillatory gamma and beta bursts. A) Example of spectrogram from a single two-item trial. B) Zoom-in on the raw LFP (black) around the time of the encircled gamma and beta bursts seen in the top right spectrogram. Blue curve is shows the LFP filtered at 75 Hz (center of the encircled gamma burst), white curve show LFP filtered at 37 Hz (center of the encircled beta burst. C) Estimated burst rate for two-item trials in gamma (light red) and beta (dark red) frequency bands for gamma-modulated sites (both monkeys combined). Burst rate is the time-dependent portion of trials exhibiting a burst at a given time point. D) Gamma burst rate in three-item trials around the time of the presentations of each item (S1-S3) and the first test item for the same electrodes as in C). Inset displays the average size of the gamma burst rate modulation effects in monkey M1 and M2 (three stars denote significance at level p<0.01; error bars denote the standard error of the mean). See also Figure S6, S7 and S8.
Fig. 5
Fig. 5
Slow modulation of gamma power. A) The difference between spectrograms of the envelopes of the gamma-band (45-100 Hz) oscillations in gamma-modulated versus non-modulated sites. B) Auto-correlogram of gamma (45-100 Hz) bursts for gamma-modulated sites during the delay period. C) Cross-correlogram of gamma bursts calculated between all simultaneously recorded gamma-modulated sites. S1-S2 refers to sample 1-2, and T1 to the first test item.
Fig. 6
Fig. 6
Power in gamma-modulated and non-modulated sites. A) Gamma band power in two-(left) and three- (right) item trials averaged for gamma-modulated (red) and non-modulated (blue) sites. B) Same as A), but for beta-band power. Shaded regions represent standard errors.
Fig. 7
Fig. 7
Information and firing rates in two-item trials. A) The average normalized firing rates of all informative early (encoding/decoding, left, N=50) and late (maintenance, right, N=21) responding cells. The red curve is the normalized gamma-band (55-90 Hz) burst rate as a reference. B) The average PEV based on first (dark) and second (light) stimuli for informative early (encoding/decoding, left) and late (maintenance, right) responding cells. Shaded areas represent standard errors.
Fig. 8
Fig. 8
Bursts in a delayed saccade task. A) Schematic of the task. The monkeys were to maintain fixation until the fixation dot disappeared and then saccade to the earlier flashed target location. B) Burst rate in gamma (light) and beta (dark) frequency ranges averaged across monkeys and areas (FEF and PFC). Time 0 corresponds to the onset of the sample presentation. Displayed is the subset of trials (1/7) where the delay time was doubled (1500 ms) relative to the standard delay of 750 ms (marked with dashed line 1100 ms into trial). Shaded areas (hardly visible) represent the standard error (N=124).

Comment in

References

    1. Amit DJ, Brunel N. Model of global spontaneous activity and local structured activity during delay periods in the cerebral cortex. Cereb. Cortex. 1997;7:237–252. - PubMed
    1. Asaad WF, Eskandar EN. A flexible software tool for temporally-precise behavioral control in Matlab. J Neurosci. Meth. 2008;174(2):245–258. - PMC - PubMed
    1. Axmacher N, Henseler MM, Jensen O, Weinreich I, Elger CE, Fell J. Cross-frequency coupling supports multi-item working memory in the human hippocampus. Proc. Natl. Acad. Sci. 2010;107(7):3228–3233. - PMC - PubMed
    1. Brunel N, Wang XJ. What determines the frequency of fast network oscillations with irregular neural discharges? I. Synaptic dynamics and excitation-inhibition balance. J. Neurophysiol. 2003;90:415–430. - PubMed
    1. Buschman TJ, Siegel M, Roy JE, Miller EK. Neural substrates of cognitive capacity limitations. Proc. Natl. Acad. Sci. 2011;108(27):11252–11255. - PMC - PubMed

Publication types