. 2016 Mar 21:6:23384.
doi: 10.1038/srep23384.

Higher-order Multivariable Polynomial Regression to Estimate Human Affective States

Affiliations

Higher-order Multivariable Polynomial Regression to Estimate Human Affective States

Jie Wei et al. Sci Rep. .

Abstract

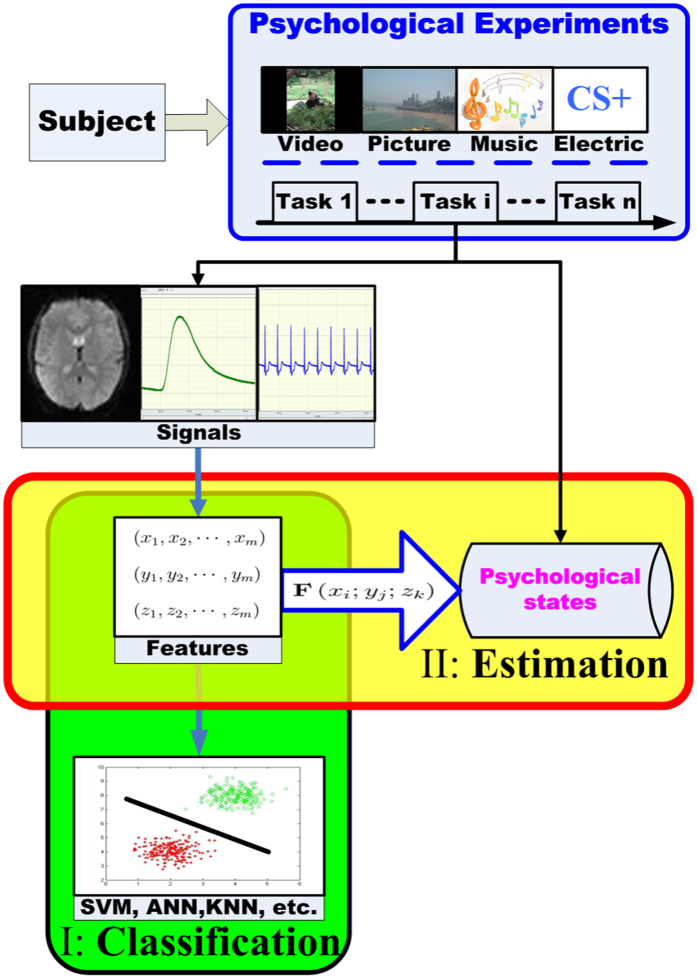
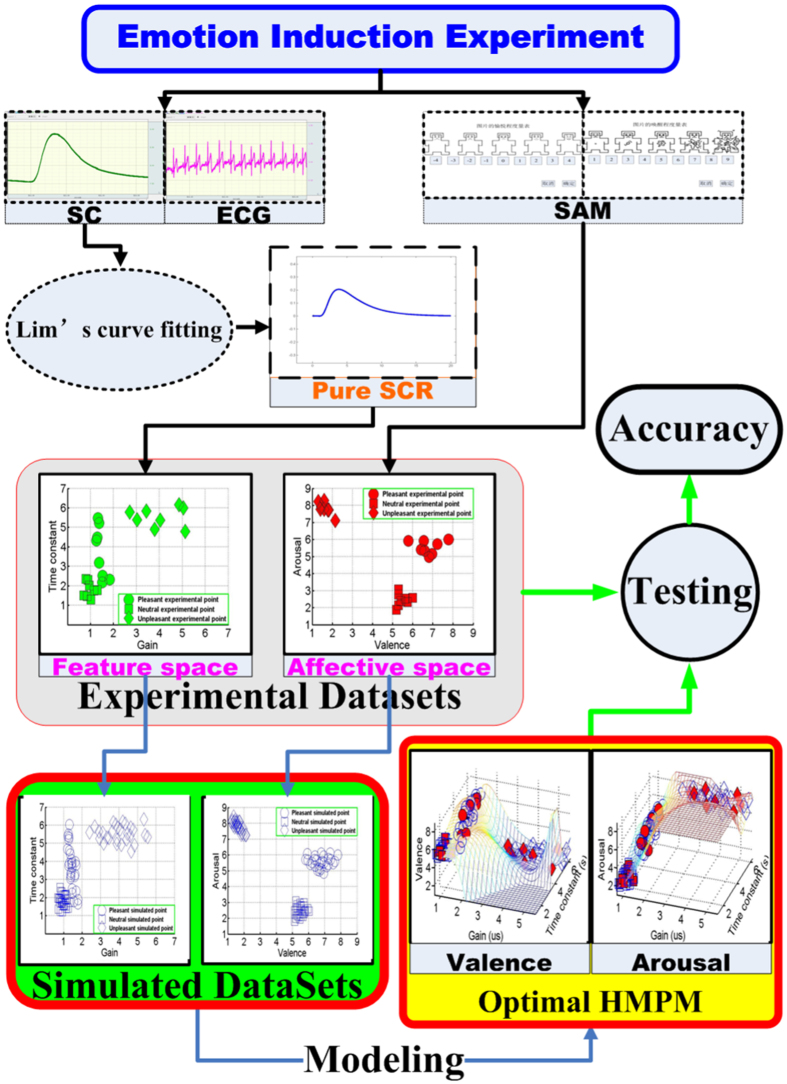
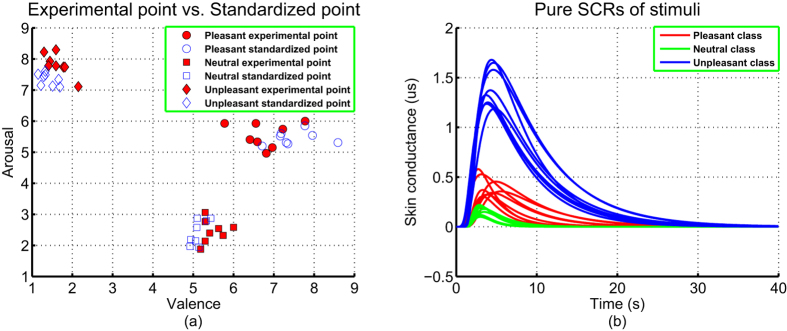
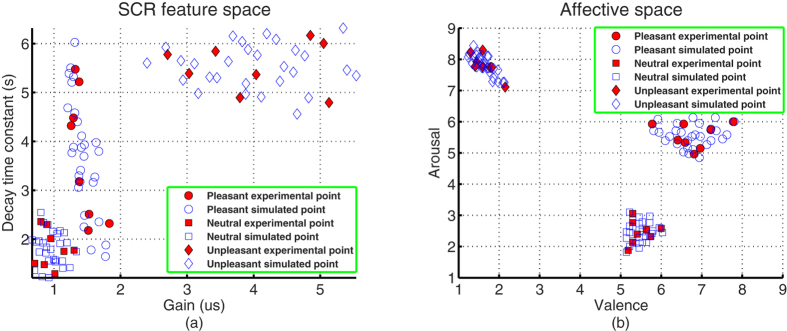
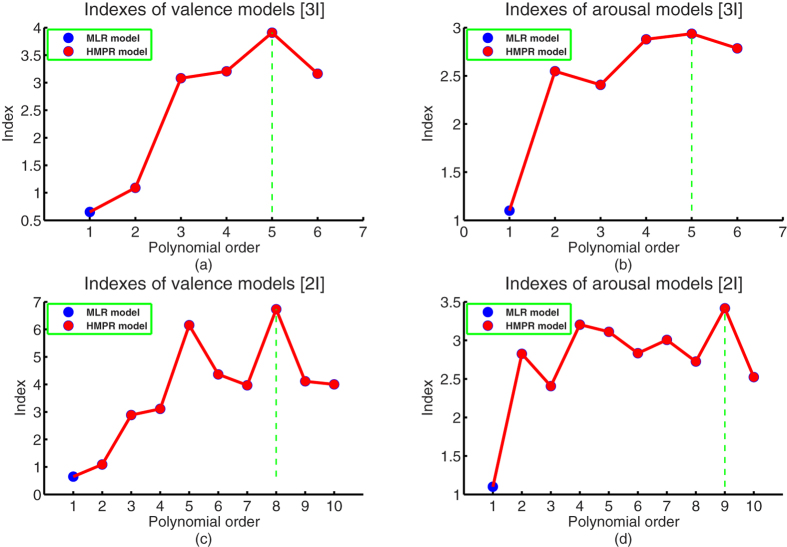
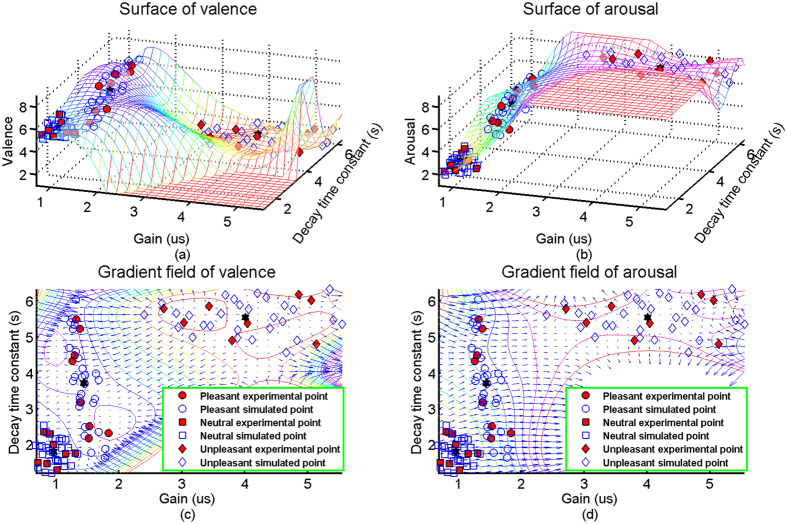
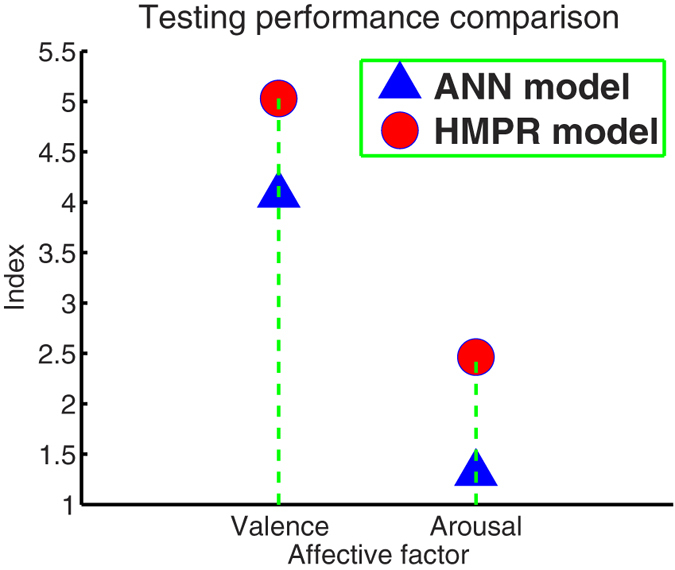
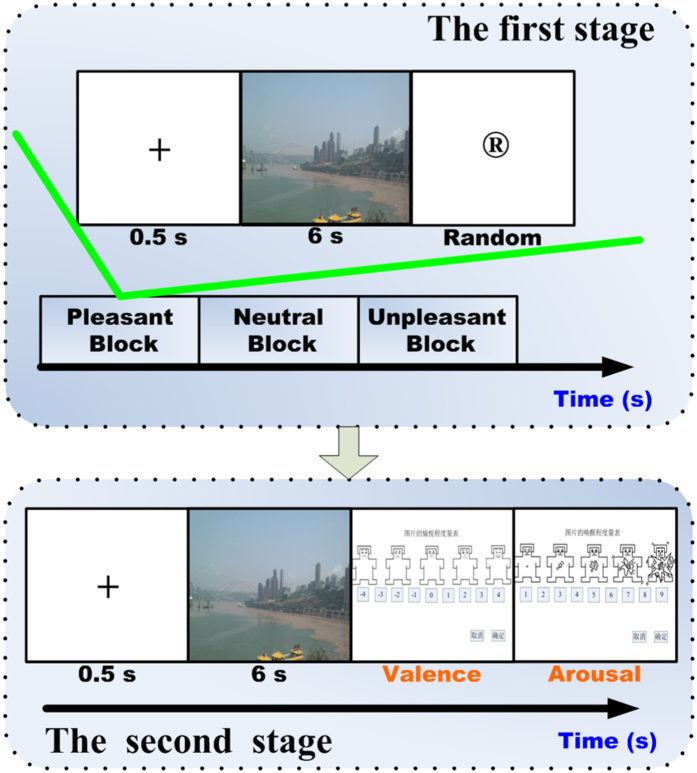
From direct observations, facial, vocal, gestural, physiological, and central nervous signals, estimating human affective states through computational models such as multivariate linear-regression analysis, support vector regression, and artificial neural network, have been proposed in the past decade. In these models, linear models are generally lack of precision because of ignoring intrinsic nonlinearities of complex psychophysiological processes; and nonlinear models commonly adopt complicated algorithms. To improve accuracy and simplify model, we introduce a new computational modeling method named as higher-order multivariable polynomial regression to estimate human affective states. The study employs standardized pictures in the International Affective Picture System to induce thirty subjects' affective states, and obtains pure affective patterns of skin conductance as input variables to the higher-order multivariable polynomial model for predicting affective valence and arousal. Experimental results show that our method is able to obtain efficient correlation coefficients of 0.98 and 0.96 for estimation of affective valence and arousal, respectively. Moreover, the method may provide certain indirect evidences that valence and arousal have their brain's motivational circuit origins. Thus, the proposed method can serve as a novel one for efficiently estimating human affective states.


Conflict of interest statement

The authors declare no competing financial interests.

Figures

Figure 1
Figure 1. A graphical representation of two main directions in current AD researches.
A subject takes participate in various affective psychophysiological experiments in which video, picture, music and electric stimuli are commonly used to induce subject’s different affective states. For each task, various kinds of signals are recorded by physical equipments (e.g., functional magnetic resonance imaging (fMRI) machines, physiological signal acquisition systems, cameras, etc.) on the one hand; and on the other hand, the corresponding affective states are measured according to psychological scales and inventories. Starting from these observed signals, feature vectors are extracted, used to represent response patterns of different affective states, and classified into finite classes by using various classifiers (e.g., support vector machine (SVM), artificial neural network (ANN), k-nearest neighborhood (KNN), etc.) to realize the classification of affective states. Applying the mapping relationships between observed response patterns and the corresponding affective psychological states, researchers use function approximation methods (e.g., multivariate linear-regression analysis, partial least-square estimation, support vector regression, artificial neural network, fuzzy logical analysis, and sequence Bayessian analysis) to approximate the assumed function models (F(xi; yj; zk)). Affective states are estimated by these obtained function models and new observed response patterns.
Figure 2
Figure 2. A general overview of the proposed estimation method and block scheme of the overall signal processing.
The subjects were emotionally stimulated through pictures chose from the International Affective Picture System (IAPS). For each trial including the 0.5 seconds fixation, 6 seconds picture presentation, and random rest (29, 31, and 34 seconds), physiological signals (skin conductance (SC), electrocardiogram (ECG), and pulse) were recorded by the Biopac MP150 system and the scores of valence and arousal were measured according to the Self-Assessment Manikin (SAM) developed by Margaret M. Bradley and Peter J. Lang. Starting from average skin conductance segments, pure skin conductance response (SCR) patterns were acquired by using the Lim’s curve fitting. The features (gain and decay time constant (Time constant)) were extracted from these pure skin conductance responses and formed the two dimensions of the physiological feature space. Valence and arousal factors form the two dimensions of the affective space. These experimental gains, decay time constants, and affective scores form the experimental data sets. Based on the experimental data sets, the simulated data sets were statistically constructed by equation (4) in the methods section. Then, the optimal affective HMPM were established on the simulated data set. Finally, the obtained HMPM were tested on the entire experimental data sets to evaluate its accuracy.
Figure 3
Figure 3. Affective and physiological patterns of experimental stimuli.
(a) the experimental affective ratings and standard ratings are expressed into points in the affective valence-arousal space. For the experimental stimuli (24 pictures), standardized ratings in the IAPS are represented by hollow markers; and experimental ratings are represented by solid markers. (b) the physiological SCR patterns are expressed into their corresponding waveforms by using equation (3) (Methods) and parameters values in the Supplementary Table S1.
Figure 4
Figure 4. Experimental data vs. Simulated data.
The experimental data sets are represented by solid markers, and the simulated data sets are represented by hollow markers. (a) Two dimensional SCR feature space. (b) Affective valence-arousal space.
Figure 5
Figure 5. Indexes of HMPMs and MLR models.
(a) six valence models’ Indexes, these valence models have three input variables, which are onset time, gain, and time constant. (b) six arousal models’ Indexes, these arousal models have the same input variables as models in (a). (c) ten valence models’ Indexes, these valence models have two input variables, which are gain and time constant. (d) ten arousal models’ Indexes, these arousal models have the same input variables as models in (c).
Figure 6
Figure 6. Surfaces and gradient fields of the affective HMPM.
The solid and hollow markers are respectively drawn from the experimental data sets and simulated data sets. (a) the valence surface is the graph of the equation (1). (b) the arousal surface is the graph of the equation (2). (c) the gradient field of valence is the gradient field of the valence surface (a). (d) the gradient field of arousal is the gradient field of the arousal surface (b).
Figure 7
Figure 7. Comparison between the affective HMPM and the optimal ANN models.
Figure 8
Figure 8. Experimental Design.
In the first stage, experimental stimuli are grouped in to pleasant, neutral, and unpleasant blocks. Each block contains eight pictures. For each trial, after a 0.5 s fixation the picture presentation last for 6 s and a random rest followed (29 s, 31 s and 34 s). In the second stage, subjects were required to rate pictures’ valence and arousal by the SAM scales.

References

    1. Picard R. W. Affective computing 100–130 (MIT press: Cambridge,, 1997).
    1. Picard R. W., Vyzas E. & Healey J. Toward machine emotional intelligence: analysis of affective physiological state. IEEE Transactions on Pattern Analysis and Machine Intelligence 23, 1175–1191 (2001).
    1. Calvo R. A. & D’Mello S. Affect detection: An interdisciplinary review of models, methods, and their applications. IEEE Transactions on Affective Computing 1, 18–37 (2010).
    1. Schaaff K. & Schultz T. Towards an eeg-based emotion recognizer for humanoid robots. In Robot and Human Interactive Communication, 2009. RO-MAN 2009. The 18th IEEE International Symposium on, 792–796 (IEEE, 2009).
    1. Novak D., Mihelj M. & Munih M. A survey of methods for data fusion and system adaptation using autonomic nervous system responses in physiological computing. Interacting with Computers 24, 154–172 (2012).

Publication types

LinkOut - more resources