

Development and validation of a photographic food atlas for portion size assessment in the southern plains of Nepal
- PMID: 26996822
- PMCID: PMC10271048
- DOI: 10.1017/S1368980016000537
Development and validation of a photographic food atlas for portion size assessment in the southern plains of Nepal
Abstract
Objective: To develop and validate a photographic food atlas of common foods for dietary assessment in southern Nepal.
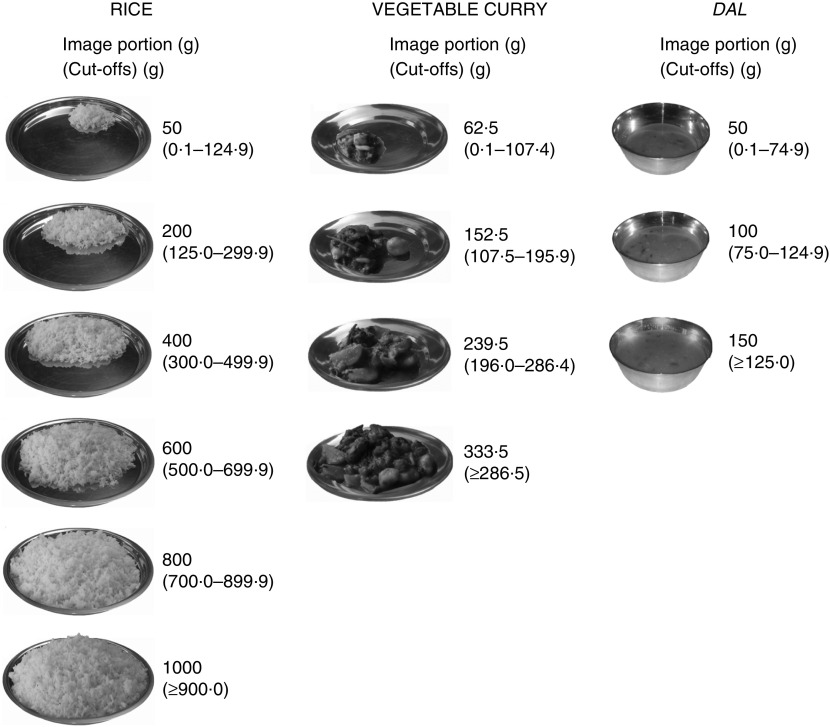
Design: We created a life-sized photographic atlas of forty locally prepared foods. Between March and June 2014, data collectors weighed portion sizes that respondents consumed during one mealtime and then a different data collector revisited the household the next day to record respondents' estimations of their previous day's intakes using the atlas. Validity was assessed by percentage error, Cohen's weighted kappa (κ w) and Bland-Altman limits of agreement.
Setting: Dhanusha and Mahottari districts in southern Nepal.
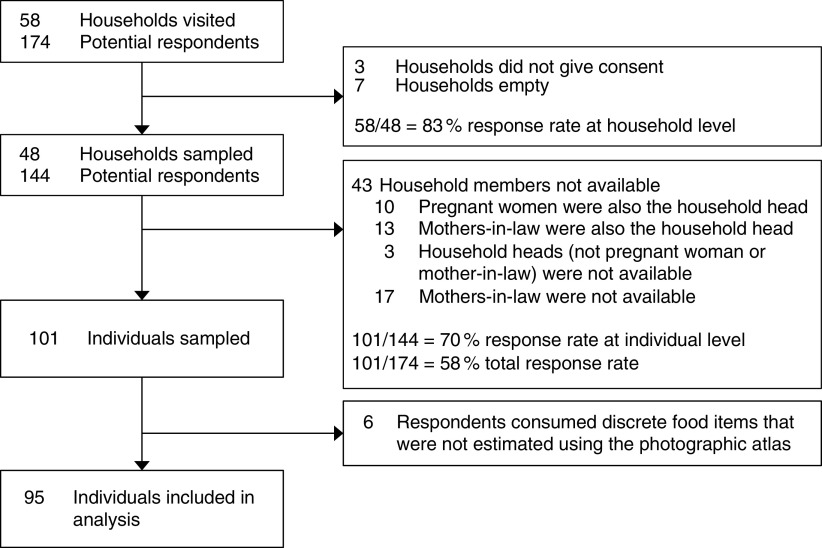
Subjects: A random sample of ninety-five adults in forty-eight rural households with a pregnant woman.
Results: Overall, respondents underestimated their intakes (mean error =-4·5 %). Rice and dal (spiced lentil soup) intakes were underestimated (-14·1 % and -34·5 %, respectively), but vegetable curry intake was overestimated (+20·8 %). Rice and vegetable curry portion size images were significantly reliably selected (Cohen's κ w (se): rice=0·391 (0·105); vegetable curry=0·430 (0·139)), whereas dal images were not. Energy intake over one mealtime was under-reported by an average of 569 kJ (136 kcal; 4·5 % error) using recall compared with the weighing method.
Conclusions: The photographic atlas is a useful tool for field estimation of dietary intake. Average errors were low, and there was 'modest' agreement between weighed and recalled portion size image selection of rice and vegetable curry food items. Error in energy estimation was low but with wide limits of agreement, suggesting that there is scope for future work to reduce error further.
Keywords: Dietary intake; Food atlas; Portion size; Validation.
Figures
 , pregnant woman; ●, household head;
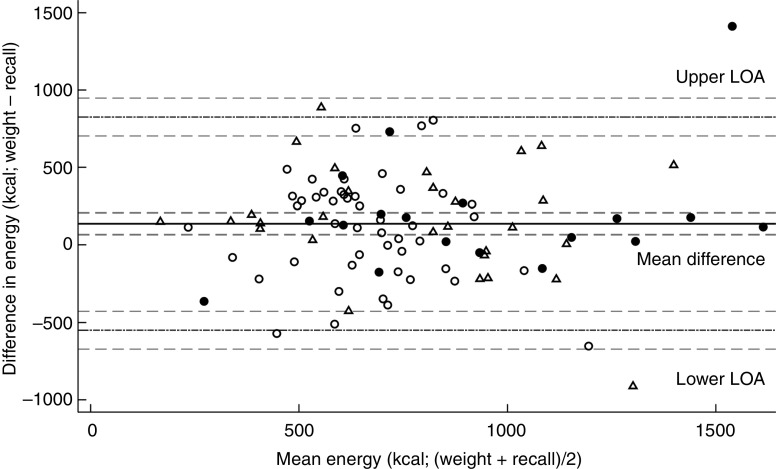
  , mother-in-law) in forty-eight rural households with a pregnant woman in southern Nepal, March–June 2014. The difference in energy intake (in kilocalories; 1 kcal=4·184 kJ) between the weighed method and the recall method is plotted v. the mean energy intake from the two methods. ——— represents the mean difference; — · — · — represent the upper and lower limits of agreement (LOA) and – – – – – represent the 95 % confidence interval of the mean difference/LOA. Upper LOA=3456 (95 % CI 2944, 3967) kJ (825·9 (703·6, 948·2) kcal); mean difference =576 (95 % CI 280, 871) kJ (137·6 (95 % CI 67·0, 208·2) kcal); lower LOA=–2304 (95 % CI –2815, –1792) kJ (–550·6 (95 % CI –672·9, –428·3) kcal)
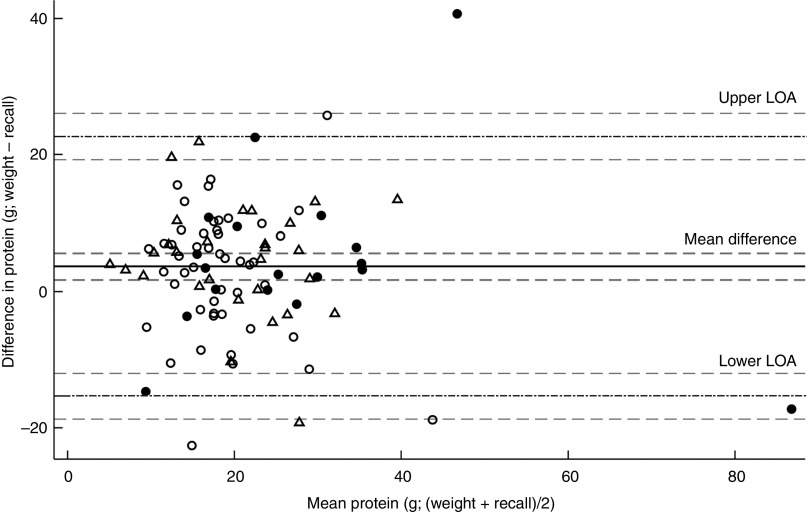 , pregnant woman; ●, household head; , mother-in-law) in forty-eight rural households with a pregnant woman in southern Nepal, March–June 2014. The difference in protein intake (in grams) between the weighed method and the recall method is plotted v. the mean protein intake from the two methods. ——— represents the mean difference; — · — · — represent the upper and lower limits of agreement (LOA) and – – – – – represent the 95 % confidence interval of the mean difference/LOA. Upper LOA=22·7 (95 % CI 19·3, 26·1) g; mean difference =3·7 (95 % CI 1·7, 5·6) g; lower LOA=–15·3 (95 % CI –18·7, –12·0) g
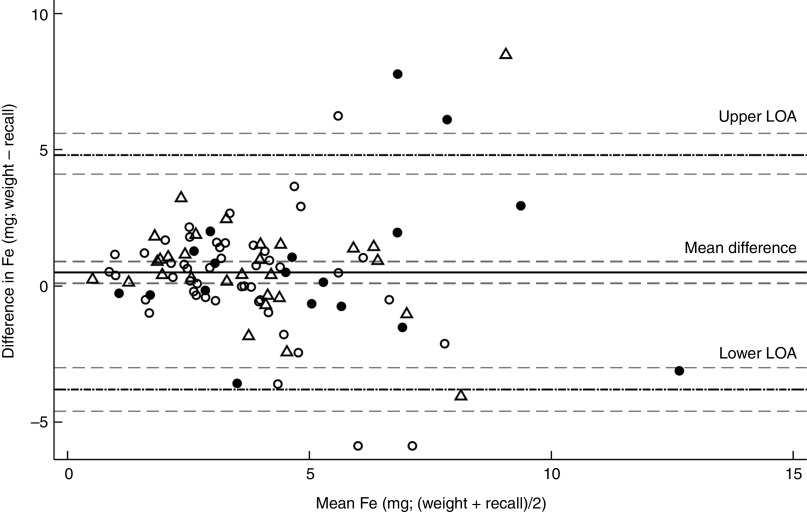 , pregnant woman; ●, household head; , mother-in-law) in forty-eight rural households with a pregnant woman in southern Nepal, March–June 2014. The difference in iron intake (in milligrams) between the weighed method and the recall method is plotted v. the mean iron intake from the two methods. ——— represents the mean difference; — · — · — represent the upper and lower limits of agreement (LOA) and – – – – – represent the 95 % confidence interval of the mean difference/LOA. Upper LOA=4·8 (95 % CI 4·1, 5·6) mg; mean difference = 0·5 (95 % CI 0·1, 0·9) mg; lower LOA = –3·8 (95 % CI –4·6, –3·0) mg
Similar articles
-
Smartphone tool to collect repeated 24 h dietary recall data in Nepal.Public Health Nutr. 2018 Feb;21(2):260-272. doi: 10.1017/S136898001700204X. Epub 2017 Aug 31. Public Health Nutr. 2018. PMID: 28854993 Free PMC article.
-
Validation of a digitally displayed photographic food portion-size estimation aid among women in urban and rural Malawi.Public Health Nutr. 2019 Dec;22(17):3140-3150. doi: 10.1017/S1368980019002428. Epub 2019 Sep 9. Public Health Nutr. 2019. PMID: 31496453 Free PMC article.
-
Evaluation of a photographic food atlas as a tool for quantifying food portion size in the United Arab Emirates.PLoS One. 2018 Apr 26;13(4):e0196389. doi: 10.1371/journal.pone.0196389. eCollection 2018. PLoS One. 2018. PMID: 29698434 Free PMC article.
-
Design and validation of a photographic atlas of Peruvian foods to evaluate the food consumption of children from 6 to 12 months of age.Appetite. 2024 Nov 1;202:107611. doi: 10.1016/j.appet.2024.107611. Epub 2024 Jul 27. Appetite. 2024. PMID: 39074616 Review.
-
Measuring food intake with digital photography.J Hum Nutr Diet. 2014 Jan;27 Suppl 1(0 1):72-81. doi: 10.1111/jhn.12014. Epub 2013 Jul 15. J Hum Nutr Diet. 2014. PMID: 23848588 Free PMC article. Review.
Cited by
-
The Adherence of Singaporean Students in Different Educational Institutions to National Food-Based Dietary Guidelines.Nutrients. 2020 Sep 30;12(10):2995. doi: 10.3390/nu12102995. Nutrients. 2020. PMID: 33007838 Free PMC article.
-
Development and validation of a food photography manual, as a tool for estimation of food portion size in epidemiological dietary surveys in Tunisia.Libyan J Med. 2016 Aug 31;11:32676. doi: 10.3402/ljm.v11.32676. eCollection 2016. Libyan J Med. 2016. PMID: 27585631 Free PMC article.
-
Supplementation with fortified balanced energy-protein during pregnancy and lactation and its effects on birth outcomes and infant growth in southern Nepal: protocol of a 2×2 factorial randomised trial.BMJ Paediatr Open. 2023 Nov;7(1):e002229. doi: 10.1136/bmjpo-2023-002229. BMJ Paediatr Open. 2023. PMID: 37923345 Free PMC article.
-
Optimizing portion-size estimation aids: a formative evaluation in Malawi.Public Health Nutr. 2019 Dec;22(17):3127-3139. doi: 10.1017/S1368980019001733. Epub 2019 Jul 22. Public Health Nutr. 2019. PMID: 31327322 Free PMC article.
-
Consumption of rice, acceptability and sensory qualities of fortified rice amongst consumers of social safety net rice in Nepal.PLoS One. 2019 Oct 3;14(10):e0222903. doi: 10.1371/journal.pone.0222903. eCollection 2019. PLoS One. 2019. PMID: 31581257 Free PMC article.
References
-
- Black RE, Allen LH, Bhutta ZA et al.. (2008) Maternal and child undernutrition: global and regional exposures and health consequences. Lancet 371, 243–260. - PubMed
-
- World Health Organization (2011) Global Status Report on Non-Communicable Diseases 2010. http://www.who.int/nmh/publications/ncd_report_full_en.pdf (accessed November 2015).
-
- National Institute of Population Research and Training, Mitra and Associates & ICF International (2011) Bangladesh Demographic and Health Survey: Key Indicators . Dhaka and Calverton, MD: NIPORT, Mitra and Associates, and ICF International.
-
- International Institute for Population Sciences & Macro International (2007) National Family Health Survey (NFHS-3), 2005–06: India: Volume I. Mumbai: IIPS.
-
- Gibson RS (2005) Principles of Nutritional Assessment. New York: Oxford University Press.
Publication types
MeSH terms
LinkOut - more resources
Full Text Sources
Other Literature Sources
Medical
