

Neighborhood Contextual Factors, Alcohol Use, and Alcohol Problems in the United States: Evidence From a Nationally Representative Study of Young Adults
- PMID: 26996826
- PMCID: PMC4844782
- DOI: 10.1111/acer.13033
Neighborhood Contextual Factors, Alcohol Use, and Alcohol Problems in the United States: Evidence From a Nationally Representative Study of Young Adults
Abstract
Background: There is considerable variation in alcohol use and problems across the United States, suggesting that systematic regional differences might contribute to alcohol involvement. Several neighborhood contextual factors may be important aspects of this "alcohol environment."
Methods: Participants were 15,197 young adults (age 18 to 26) from Wave III of the National Longitudinal Study of Adolescent to Adult Health, a nationally representative U.S. survey. Measures of past-year alcohol use and problems were obtained via structured in-home interviews. Tract-level neighborhood contextual factors (density of on- and off-premises alcohol outlets, neighborhood disadvantage, rural vs. urban residence) were derived from census indicators and geocoded state-level alcohol outlet licenses. Multivariate logistic regression, ordered logistic regression, or negative binomial regression models, including age, sex, race, and household income as covariates, were fit to examine the relation of the neighborhood contextual factors with alcohol use and problems.
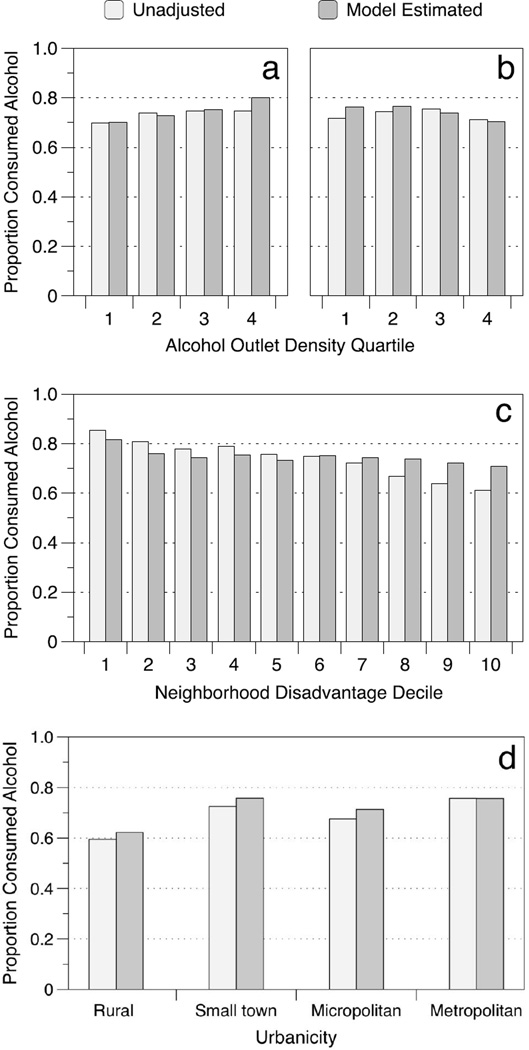
Results: The most consistent finding across 4 of the 5 measures of alcohol involvement was their association with neighborhood advantage; the active ingredient underlying this effect was primarily the proportion of educated residents in the neighborhood. The densities of alcohol outlets were associated with any alcohol use-they were not associated with binge drinking or alcohol problems, nor could they explain any of the neighborhood advantage effects. The influence of alcohol outlet densities on alcohol involvement did not differ for those above or below the legal age to purchase alcohol. Living in a rural versus an urban neighborhood was associated with a different alcohol use pattern characterized by a lower likelihood of any drinking, but among those who drank, consuming more alcohol per occasion.
Conclusions: Living in a more advantaged and educated urban neighborhood with greater densities of bars and restaurants is associated with greater alcohol involvement among 18- to 26-year-olds in the United States.
Keywords: Add Health; Alcohol Outlets; Alcohol Problems; Alcohol Use; Neighborhood Disadvantage; Rural; Young Adults.
Copyright © 2016 by the Research Society on Alcoholism.
Conflict of interest statement
Conflicts of interest: none
Figures
Similar articles
-
Neighborhood density of alcohol outlets moderates genetic and environmental influences on alcohol problems.Addiction. 2019 May;114(5):815-822. doi: 10.1111/add.14534. Epub 2019 Jan 24. Addiction. 2019. PMID: 30561109
-
Alcohol availability and neighborhood poverty and their relationship to binge drinking and related problems among drinkers in committed relationships.J Interpers Violence. 2012 Sep;27(13):2703-27. doi: 10.1177/0886260512436396. J Interpers Violence. 2012. PMID: 22890980 Free PMC article.
-
Neighborhood alcohol outlet density and genetic influences on alcohol use: evidence for gene-environment interaction.Psychol Med. 2019 Feb;49(3):474-482. doi: 10.1017/S0033291718001095. Epub 2018 May 7. Psychol Med. 2019. PMID: 29730997
-
Alcohol outlet density, drinking contexts and intimate partner violence: a review of environmental risk factors.J Drug Educ. 2014;44(1-2):19-33. doi: 10.1177/0047237915573527. Epub 2015 Feb 27. J Drug Educ. 2014. PMID: 25725018 Free PMC article. Review.
-
Hazardous alcohol use and alcohol-related harm in rural and remote communities: a scoping review.Lancet Public Health. 2022 Feb;7(2):e177-e187. doi: 10.1016/S2468-2667(21)00159-6. Epub 2021 Nov 10. Lancet Public Health. 2022. PMID: 34774200
Cited by
-
Moderation of Genetic Influences on Alcohol Involvement by Rural Residency among Adolescents: Results from the 1962 National Merit Twin Study.Behav Genet. 2017 Nov;47(6):587-595. doi: 10.1007/s10519-017-9867-x. Epub 2017 Sep 18. Behav Genet. 2017. PMID: 28921187 Free PMC article.
-
The neighbourhood social environment and alcohol use among urban and rural Scottish adolescents.Int J Public Health. 2019 Jan;64(1):95-105. doi: 10.1007/s00038-018-1181-8. Epub 2018 Dec 3. Int J Public Health. 2019. PMID: 30511169 Free PMC article.
-
Associations Between Trait Boredom and Frequency of Cannabis, Alcohol, and Tobacco Use in College Students.Cannabis. 2023 Nov 3;6(3):149-164. doi: 10.26828/cannabis/2023/000177. eCollection 2023. Cannabis. 2023. PMID: 38035167 Free PMC article.
-
Secondhand Harms From Cannabis Use: Findings From Washington State, United States.J Stud Alcohol Drugs. 2024 Nov;85(6):777-787. doi: 10.15288/jsad.23-00342. Epub 2024 Apr 25. J Stud Alcohol Drugs. 2024. PMID: 38662514
-
Urban health inequities and healthy longevity: traditional and emerging risk factors across the cities and policy implications.Aging Clin Exp Res. 2025 May 7;37(1):143. doi: 10.1007/s40520-025-03052-1. Aging Clin Exp Res. 2025. PMID: 40332678 Free PMC article. Review.
References
-
- Azar D, White V, Coomber K, Faulkner A, Livingston M, Chikritzhs T, Room R, Wakefield M. The association between alcohol outlet density and alcohol use among urban and regional Australian adolescents. Addiction. 2015;111:65–72. - PubMed
-
- Borders TF, Booth BM. Rural, suburban, and urban variations in alcohol consumption in the United States: Findings from the National Epidemiologic Survey on Alcohol and Related Conditions. The Journal of Rural Health. 2007;23:314–321. - PubMed
Publication types
MeSH terms
Grants and funding
LinkOut - more resources
Full Text Sources
Other Literature Sources
Medical
Miscellaneous
