

HIV-1 cellular and tissue replication patterns in infected humanized mice
- PMID: 26996968
- PMCID: PMC4800734
- DOI: 10.1038/srep23513
HIV-1 cellular and tissue replication patterns in infected humanized mice
Abstract
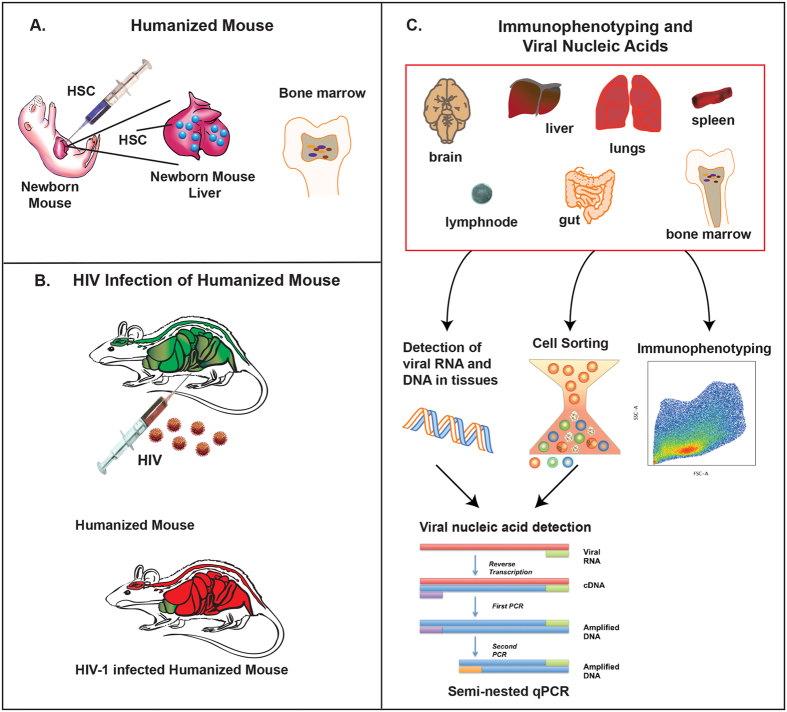
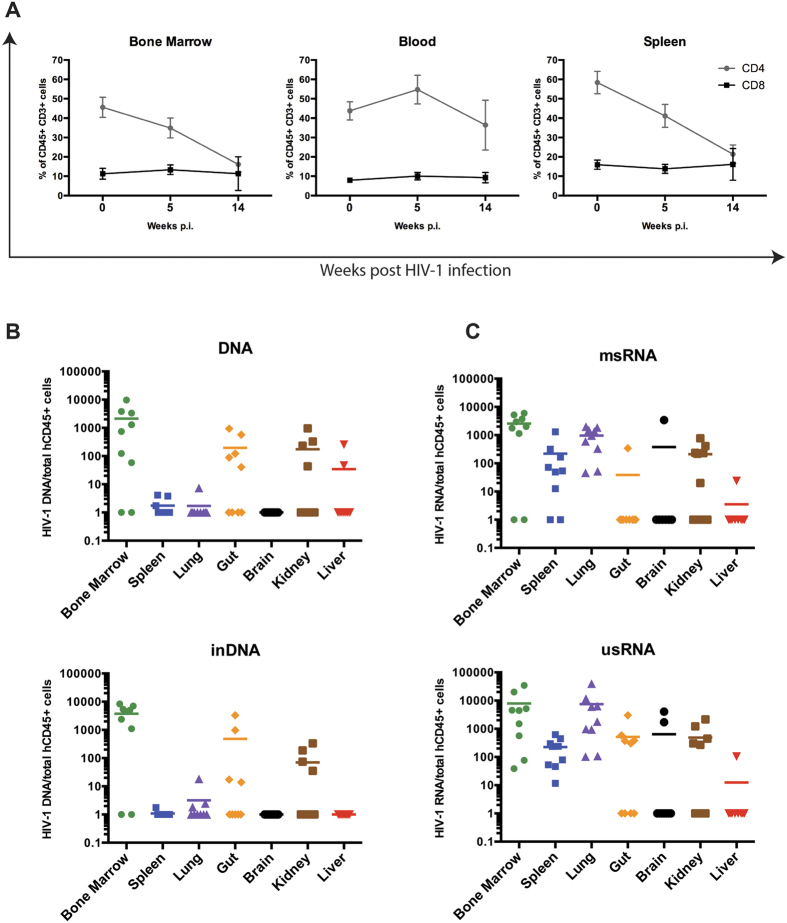
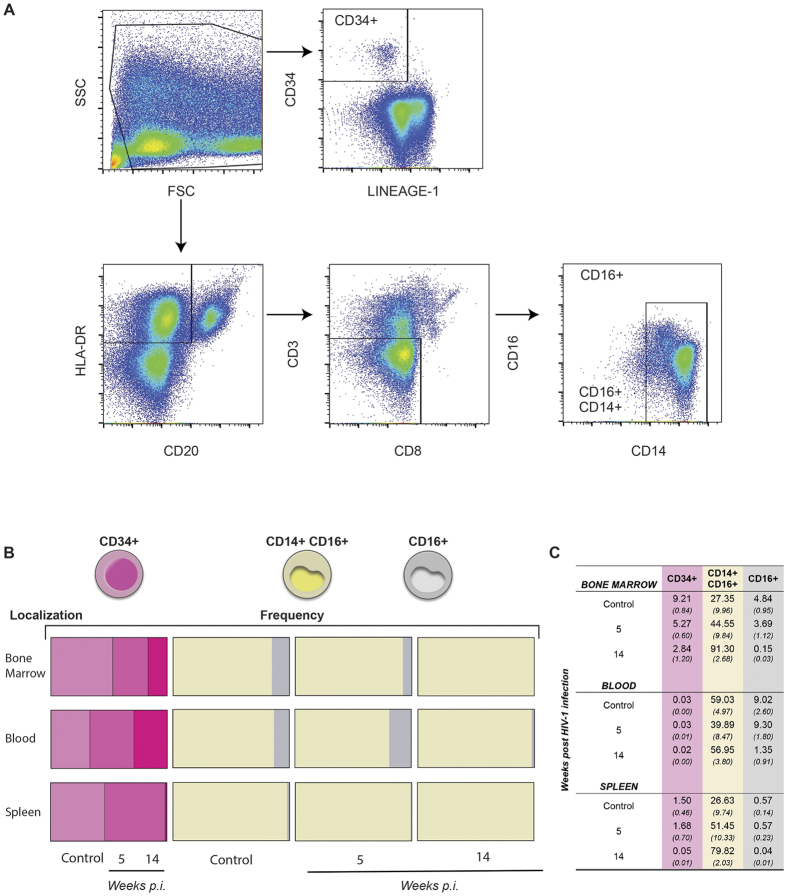
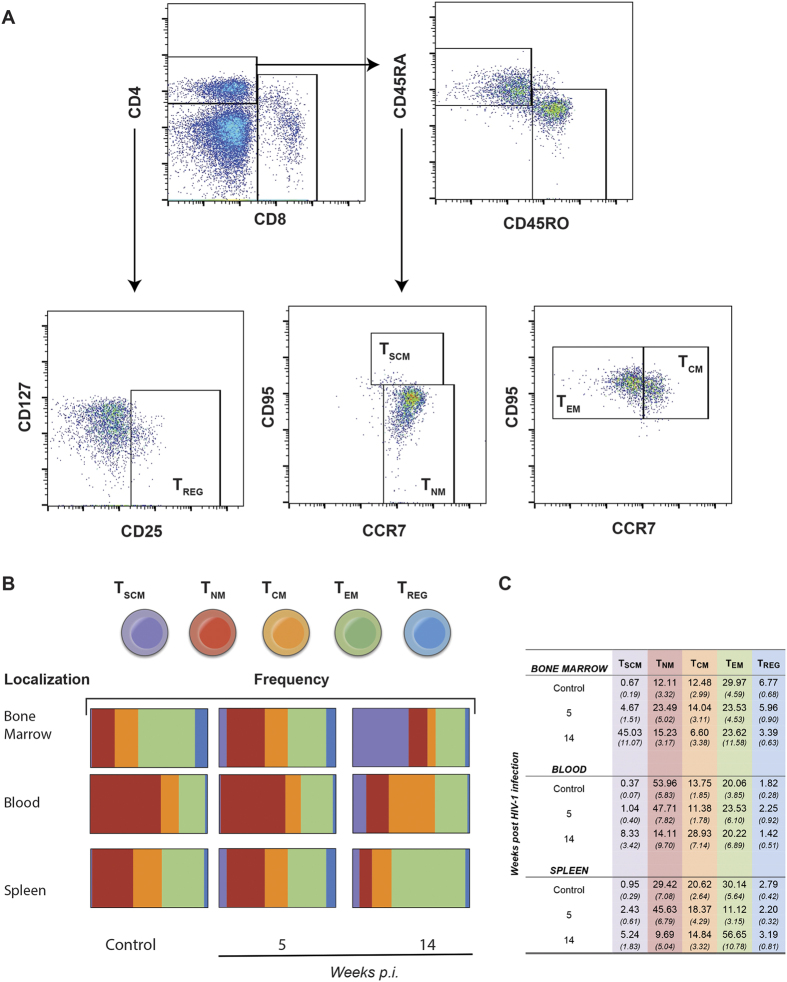
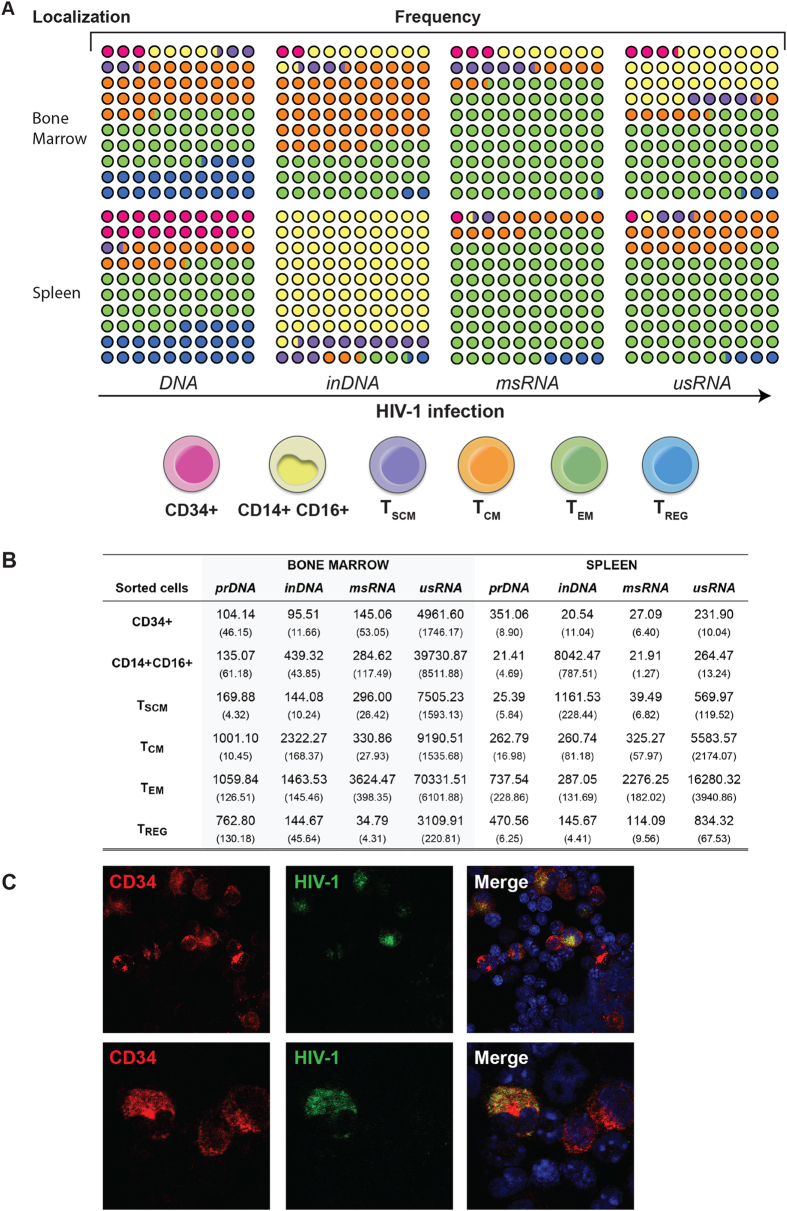
Humanized mice have emerged as a testing platform for HIV-1 pathobiology by reflecting natural human disease processes. Their use to study HIV-1 biology, virology, immunology, pathogenesis and therapeutic development has served as a robust alternative to more-well developed animal models for HIV/AIDS. A critical component in reflecting such human pathobiology rests in defining the tissue and cellular sites for HIV-1 infection. To this end, we examined the tissue sites for viral infection in bone marrow, blood, spleens, liver, gut, brain, kidney and lungs of human CD34+ hematopoietic stem cell engrafted virus-infected NOD.Cg-Prkdc(scid) Il2rg(tm1Wjl)/SzJ mice. Cells were analyzed by flow cytometry and sorted from species mixtures defined as CD34+ lineage negative progenitor cells, CD14+CD16+ monocyte-macrophages and central, stem cell and effector memory T cells. The cell distribution and viral life cycle were found dependent on the tissue compartment and time of infection. Cell subsets contained HIV-1 total and integrated DNA as well as multi-spliced and unspliced RNA in divergent proportions. The data support the idea that humanized mice can provide a means to examine the multifaceted sites of HIV-1 replication including, but not limited to progenitor cells and monocyte-macrophages previously possible only in macaques and human.
Conflict of interest statement
The authors declare no competing financial interests.
Figures
Similar articles
-
A mature macrophage is a principal HIV-1 cellular reservoir in humanized mice after treatment with long acting antiretroviral therapy.Retrovirology. 2017 Mar 9;14(1):17. doi: 10.1186/s12977-017-0344-7. Retrovirology. 2017. PMID: 28279181 Free PMC article.
-
Hematopoietic stem cell-engrafted NOD/SCID/IL2Rgamma null mice develop human lymphoid systems and induce long-lasting HIV-1 infection with specific humoral immune responses.Blood. 2007 Jan 1;109(1):212-8. doi: 10.1182/blood-2006-04-017681. Epub 2006 Sep 5. Blood. 2007. PMID: 16954502
-
Immune Activations and Viral Tissue Compartmentalization During Progressive HIV-1 Infection of Humanized Mice.Front Immunol. 2019 Feb 28;10:340. doi: 10.3389/fimmu.2019.00340. eCollection 2019. Front Immunol. 2019. PMID: 30873181 Free PMC article.
-
Cell-to-Cell Spread of HIV and Viral Pathogenesis.Adv Virus Res. 2016;95:43-85. doi: 10.1016/bs.aivir.2016.03.001. Epub 2016 Apr 4. Adv Virus Res. 2016. PMID: 27112280 Review.
-
Cellular reservoirs of HIV-1 and their role in viral persistence.Curr HIV Res. 2008 Sep;6(5):388-400. doi: 10.2174/157016208785861195. Curr HIV Res. 2008. PMID: 18855649 Free PMC article. Review.
Cited by
-
Perspectives on Non-BLT Humanized Mouse Models for Studying HIV Pathogenesis and Therapy.Viruses. 2021 Apr 28;13(5):776. doi: 10.3390/v13050776. Viruses. 2021. PMID: 33924786 Free PMC article. Review.
-
Combined cART including Tenofovir Disoproxil, Emtricitabine, and Dolutegravir has potent therapeutic effects in HIV-1 infected humanized mice.J Transl Med. 2021 Oct 30;19(1):453. doi: 10.1186/s12967-021-03120-w. J Transl Med. 2021. PMID: 34717655 Free PMC article.
-
The Promise of Long-Acting Antiretroviral Therapies: From Need to Manufacture.Trends Microbiol. 2019 Jul;27(7):593-606. doi: 10.1016/j.tim.2019.02.009. Epub 2019 Apr 10. Trends Microbiol. 2019. PMID: 30981593 Free PMC article. Review.
-
Human Immune System Mice for the Study of Human Immunodeficiency Virus-Type 1 Infection of the Central Nervous System.Front Immunol. 2018 Apr 4;9:649. doi: 10.3389/fimmu.2018.00649. eCollection 2018. Front Immunol. 2018. PMID: 29670623 Free PMC article. Review.
-
Humanized mice: models for evaluating NeuroHIV and cure strategies.J Neurovirol. 2018 Apr;24(2):185-191. doi: 10.1007/s13365-017-0567-3. Epub 2017 Aug 22. J Neurovirol. 2018. PMID: 28831774 Free PMC article. Review.
References
Publication types
MeSH terms
Substances
Grants and funding
- R01 NS036126/NS/NINDS NIH HHS/United States
- P01 NS043985/NS/NINDS NIH HHS/United States
- R21 DA041018/DA/NIDA NIH HHS/United States
- P01 DA028555/DA/NIDA NIH HHS/United States
- P30 MH062261/MH/NIMH NIH HHS/United States
- P01 NS031492/NS/NINDS NIH HHS/United States
- P01 NS31492/NS/NINDS NIH HHS/United States
- R24 OD 018546-01/OD/NIH HHS/United States
- 2R01 NS034239/NS/NINDS NIH HHS/United States
- P01 MH64570/MH/NIMH NIH HHS/United States
- P01 MH064570/MH/NIMH NIH HHS/United States
- R01 AG043540/AG/NIA NIH HHS/United States
- R01 NS034239/NS/NINDS NIH HHS/United States
- P01 NS43985/NS/NINDS NIH HHS/United States
- R24 OD018546/OD/NIH HHS/United States
- R01 NS36126/NS/NINDS NIH HHS/United States
LinkOut - more resources
Full Text Sources
Other Literature Sources
Medical
Research Materials
