. 2016 Mar 24;165(1):180-191.
doi: 10.1016/j.cell.2016.01.046. Epub 2016 Mar 17.

Neuronal Firing Rate Homeostasis Is Inhibited by Sleep and Promoted by Wake

Affiliations

Neuronal Firing Rate Homeostasis Is Inhibited by Sleep and Promoted by Wake

Keith B Hengen et al. Cell. .

Abstract

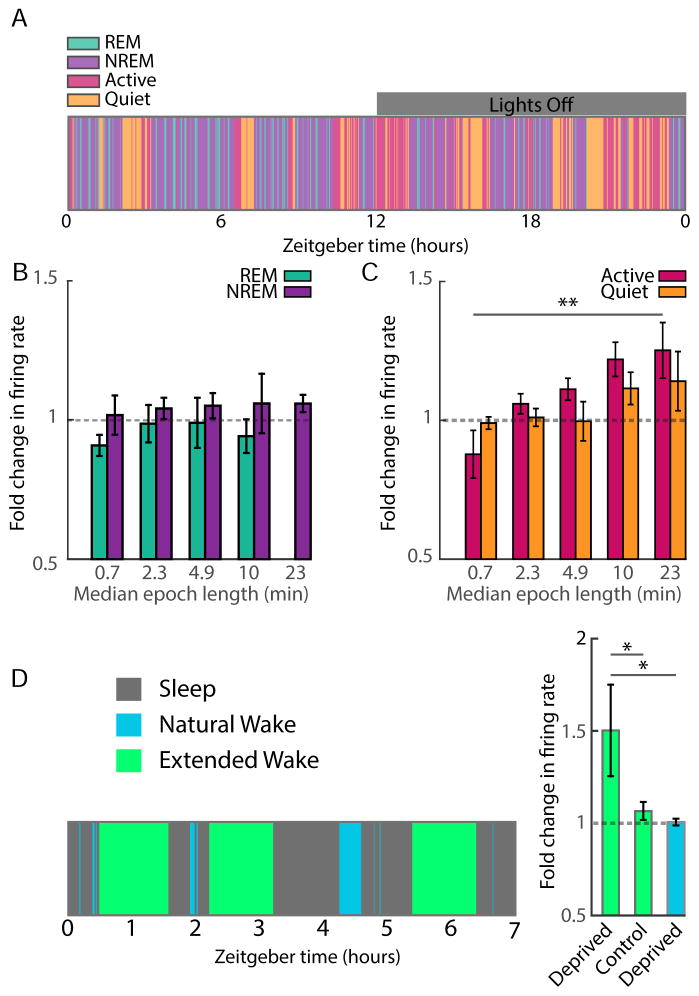
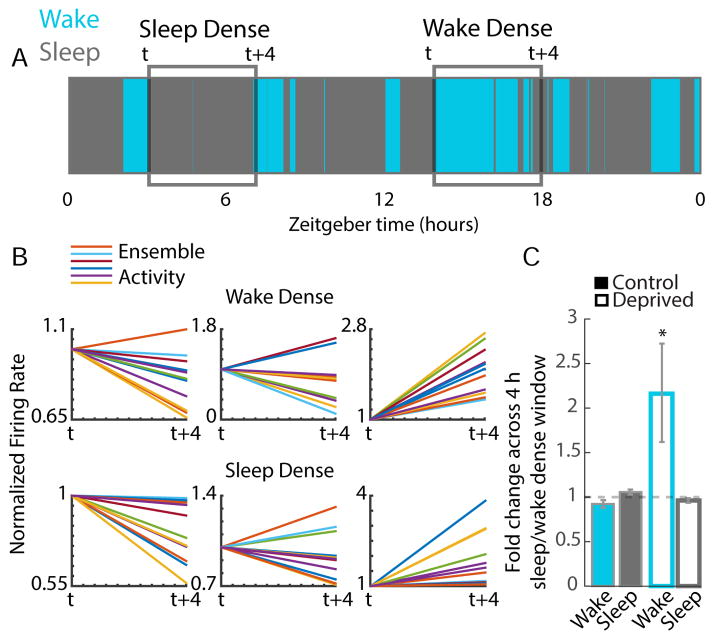
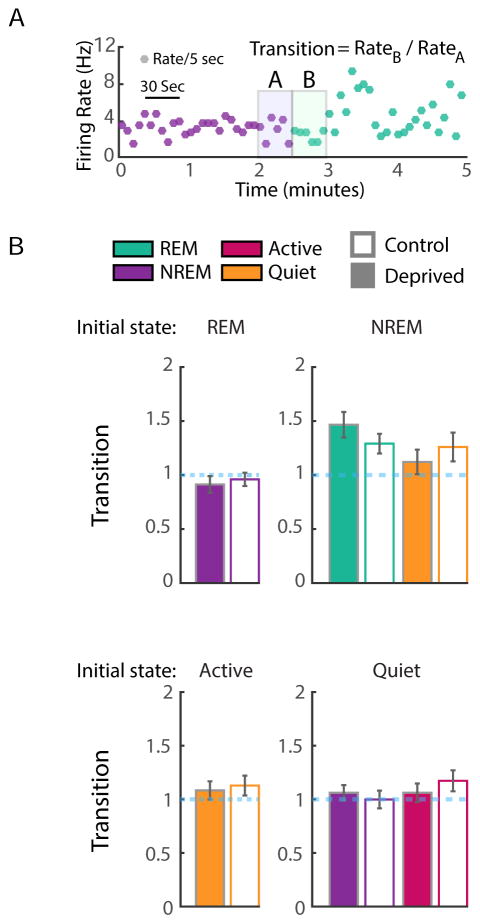
Homeostatic mechanisms stabilize neural circuit function by keeping firing rates within a set-point range, but whether this process is gated by brain state is unknown. Here, we monitored firing rate homeostasis in individual visual cortical neurons in freely behaving rats as they cycled between sleep and wake states. When neuronal firing rates were perturbed by visual deprivation, they gradually returned to a precise, cell-autonomous set point during periods of active wake, with lengthening of the wake period enhancing firing rate rebound. Unexpectedly, this resetting of neuronal firing was suppressed during sleep. This raises the possibility that memory consolidation or other sleep-dependent processes are vulnerable to interference from homeostatic plasticity mechanisms. PAPERCLIP.


Figures

Figure 1
Figure 1. Firing of individual neurons in V1 followed continuously for nine days in freely behaving rats
A) PCA clustering of spike waveforms from a single electrode across 9 days of recording. A subset of points is shown for clarity. On this wire, two clusters were identified algorithmically as separable single units (labeled by the pink/yellow spectrum and blue/purple spectrum). Points within a cluster are colored according to the day the spike was acquired. WavePC1 and Wave PC2 are the first two principal components of waveforms. WaveFFT is a weighted sum of the Fast Fourier Transform of waveforms. B) Cluster centroids were calculated and color-coded for each day of recording and overlaid on the cluster projections shown in (A). C) Mean waveform trace per 24h of recording was calculated for each of the two clusters, and color-coded as in (A). D) Mean waveform traces in (C) are peak-scaled and overlaid to demonstrate stability of waveforms for Cells 1 and 2. E) The sum of squared errors (SSE) for each continuous unit was calculated for all possible comparisons of the 9 waveforms, averaged across continuous units, and plotted (Continuous). This was compared to the SSE obtained when waveforms from continuous units were randomly shuffled and reassigned to mock units (Random Pairs). F) RSUs recorded for 9 days from control hemisphere of a representative animal. Here and below, gray and white bars represent 12h of dark and light, respectively. *** = p < 0.001. See also Figure S1 and S6.
Figure 2
Figure 2. Effects of sleep and wake states on cortical unit activity
A) Polysomnography was used to identify behavioral states. Local field potential (LFP) spectral density plot (0 to 15 Hz; bottom) is shown for three state transitions. LFPs, EMGs, and motion recording were combined to identify vigilance states. B) The FR of each neuron in the various states was normalized to its rate during REM, and values were averaged across control neurons. C) The coefficient of variation (CV) was calculated for each neuron in each state and then averaged. D) Normalized average FRs were calculated as in (B), but for light and dark. E) The FR of a given cell in one state was plotted against its FR in another (i.e. Active versus Quiet wake; top left). The blue line is the unity line. ** = P < 0.01. See also Figure S2 and S3.
Figure 3
Figure 3. Neurons return to an individual FR set-point during prolonged monocular deprivation
A) Example plot of two simultaneously recorded neurons from the deprived hemisphere, showing FRs over three days of baseline and six days of monocular deprivation (MD). Eyelid suture was performed at arrow. B) The average, baseline-normalized FR plot of 44 neurons recorded from 6 animals during MD. Shaded area represents SEM. Gold arrow indicates time of lid suture. Dashed green line indicates a baseline-normalized FR of 1.0. C) FR changes in individual neurons during MD. For each control (gold) or deprive (purple) neuron mean FR on baseline day 3 (X-axis) was plotted against mean FR during early MD (MD2, Y-axis). D) Same as in (C), but for baseline vs late MD (~MD5, Y-axis). Inset: difference in rate between baseline and early or late MD, calculated for each neuron and then averaged by condition. E) Cumulative distribution of FRs for control neurons. Rank in the distribution was determined at baseline and color-coded for each neuron according to scale at right; the unique color of each neuron was carried forward in the cumulative distributions for early and late MD. F) Same as in (E), but for neurons from the deprived hemisphere. Inset: change in rank order. For each neuron the absolute difference in rank order between control and early or late MD was calculated, and this difference was averaged across conditions and expressed as % change from baseline. ** = p <0.01, **** = p<0.001.
Figure 4
Figure 4. Homeostatic rebound in FR occurs during active waking
The rebound in firing of deprived neurons during late MD could happen continuously across behavioral states (A), or could be a discontinuous process that is gated by behavioral state (B). C) Schematic of state-dependent analysis of changes in FR during the rebound period of MD. (Left) Inset: example neuron from deprived hemisphere, showing drop and rebound during MD; gray box indicates the region expanded in plot below, with firing (30 s bins) colored according to the animal’s behavioral state. All instances of a state are identified (boxed regions), and D) data normalized on X and Y axes for each epoch; examples correspond to the colored boxes in (C). Data are then averaged (bottom purple panel) to produce the plots in (E) and (F). E) Fold change in firing across behavioral states for control neurons during late MD2-5. F) Same as in (B) but for deprived neurons. Inset compares fold changes across conditions. G) Quantification of the fold change in firing across epoch types for control and deprived neurons. H) Same analysis as in (F), but for L vs. D. * = p<0.05. See also Figure S4.
Figure 5
Figure 5. Relationship between behavioral state duration and homeostatic rebound
A) An example area plot of behavioral states from a single animal during a 24h day (12:12 light/dark), illustrating the variability in epoch length. Gray bar denotes dark period. B, C) The distribution of epoch lengths was divided into quintiles and the relationship between epoch length and fold change in firing during the rebound (quantified as in Fig. 4E, F) plotted for REM and non-REM sleep (B) or Active and Quiet wake (C). D) Example of extended waking protocol during the rebound, showing interspersed prolonged and natural waking epochs. E) Plot of fold change in firing during rebound for deprived neurons during prolonged (~1 hr duration) and natural (~5 min duration) waking epochs. Extended waking had no effect on firing of neurons in the control hemisphere (Control). ** = p <0.01; * = p<0.05.
Figure 6
Figure 6. Baseline firing is stable during long sleep and wake episodes
A) We identified 4 hr periods that were sleep- or wake-dense (>65% sleep or wake), and quantified changes in firing for control neurons, or deprived neurons during the rebound period. Area plot from one animal showing the distribution of sleep and wake across a 24h period. Example sleep dense and wake dense blocks are identified in the gray boxes (blocks start at time “t” and end at “t+4”). B) Sleep and wake dense periods did not have consistent effects on the FRs of ensembles of single units in the control hemisphere. Example blocks demonstrate that both wake and sleep dense blocks could exhibit increasing rates, no net change, and decreasing rates. C) Quantification of FR changes averaged across all sleep- or wake-dense blocks. In control conditions (filled), firing is stable across both sleep- and wake-dense blocks of time. During MD, in the deprived hemisphere (open), FRs increased only in wake-dense periods. See also Figure S5.
Figure 7
Figure 7. FR changes during state transitions
A) Example of the firing activity of one neuron in 5-second bins (dots), colored by state. To consider the transition from NREM (purple) to REM (green), we calculated the ratio of the first thirty seconds of REM firing to the last thirty seconds of NREM firing (gray boxes). B) Quantification of the transition ratio (Rate B/Rate A) for all four states. The starting state (Rate A) is indicated at the top of each panel, and the ending state (Rate B) is color-coded. State transitions that represented less than five percent of all transitions were excluded from this plot for simplicity (e.g. REM to active waking). No state transitions differed significantly between control and deprived conditions (including those not plotted).

Comment in

References

    1. Abasolo D, Simons S, Morgado da Silva R, Tononi G, Vyazovskiy VV. Lempel-Ziv complexity of cortical activity during sleep and waking in rats. J Neurophysiol. 2015;113:2742–2752. - PMC - PubMed
    1. Abbott LF, Nelson SB. Synaptic plasticity: taming the beast. Nat Neurosci. 2000;3:1178–1183. - PubMed
    1. Abel T, Havekes R, Saletin JM, Walker MP. Sleep, plasticity and memory from molecules to whole-brain networks. Curr Biol. 2013;23:R774–788. - PMC - PubMed
    1. Aton SJ, Broussard C, Dumoulin M, Seibt J, Watson A, Coleman T, Frank MG. Visual experience and subsequent sleep induce sequential plastic changes in putative inhibitory and excitatory cortical neurons. Proc Natl Acad Sci U S A. 2013;110:3101–3106. - PMC - PubMed
    1. Aton SJ, Seibt J, Dumoulin M, Jha SK, Steinmetz N, Coleman T, Naidoo N, Frank MG. Mechanisms of sleep-dependent consolidation of cortical plasticity. Neuron. 2009;61:454–466. - PMC - PubMed

Publication types