. 2016 Apr 7;165(2):343-56.
doi: 10.1016/j.cell.2016.02.023. Epub 2016 Mar 17.

The Effect of Sustained Inflammation on Hepatic Mevalonate Pathway Results in Hyperglycemia

Affiliations

The Effect of Sustained Inflammation on Hepatic Mevalonate Pathway Results in Hyperglycemia

Daniel Okin et al. Cell. .

Abstract

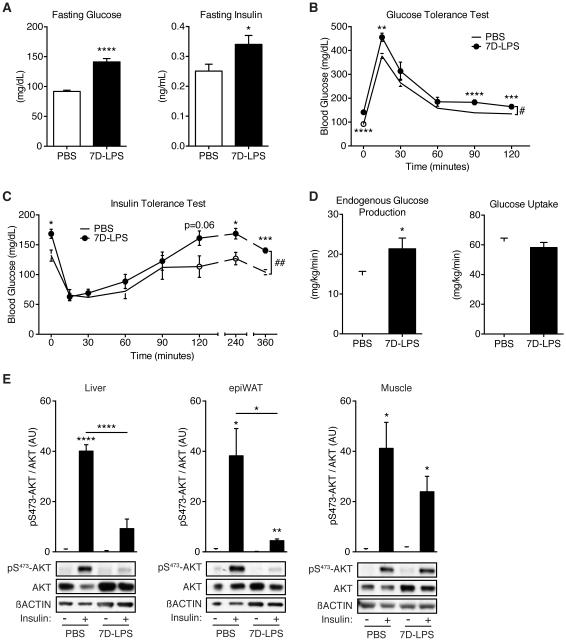
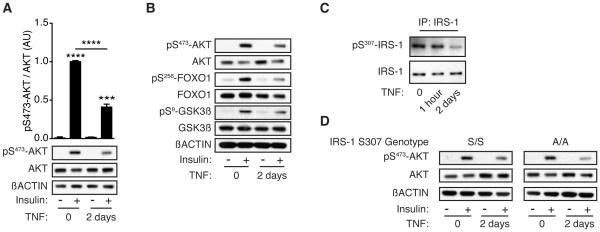
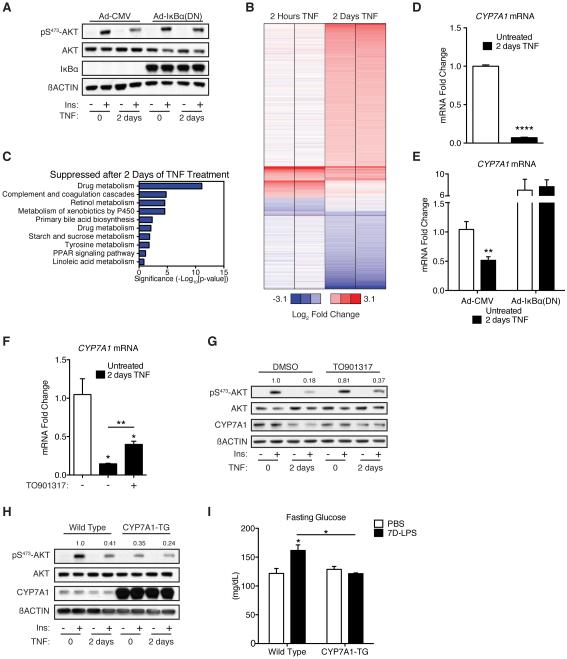
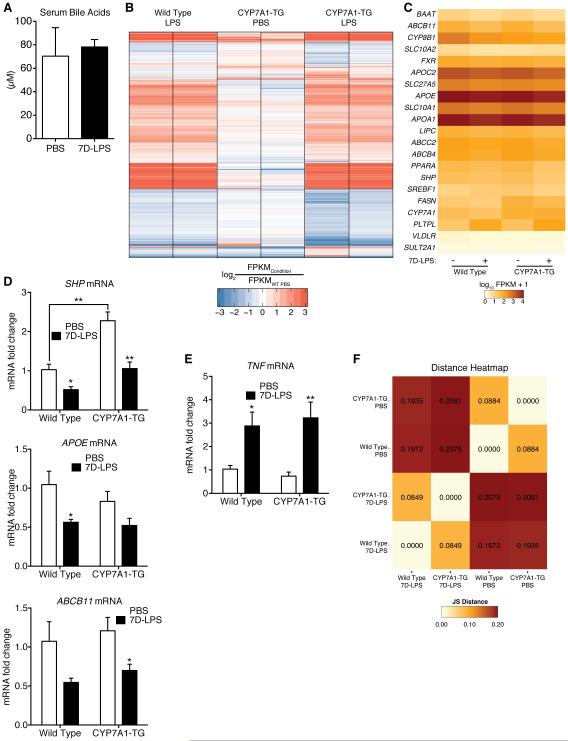
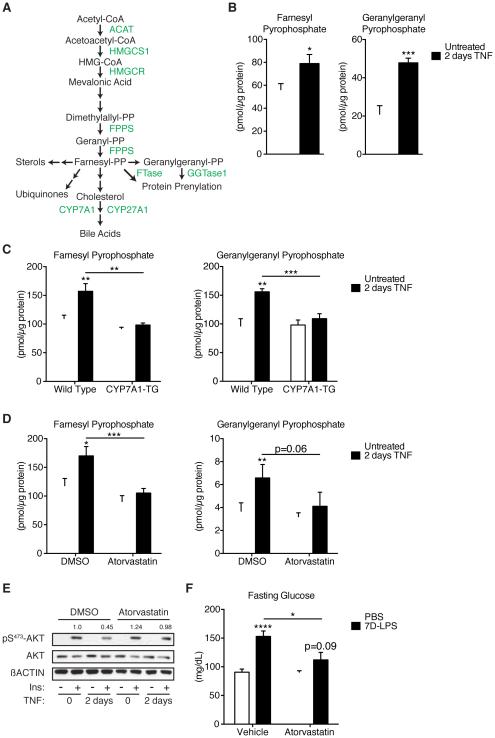
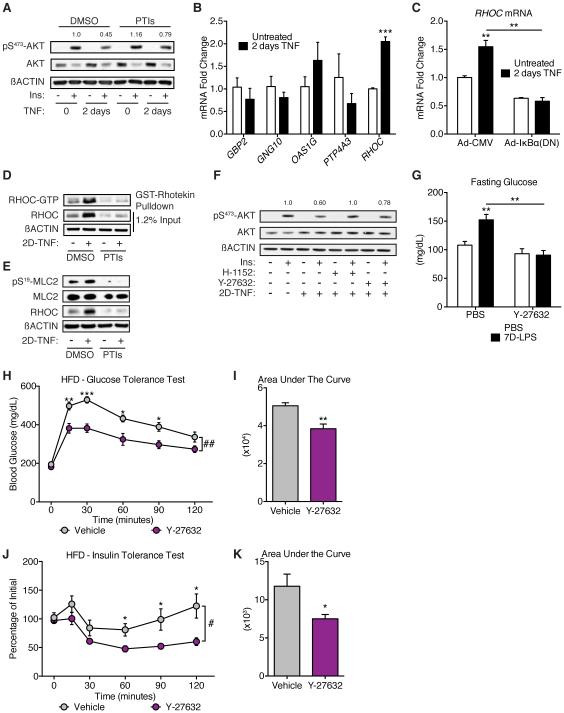
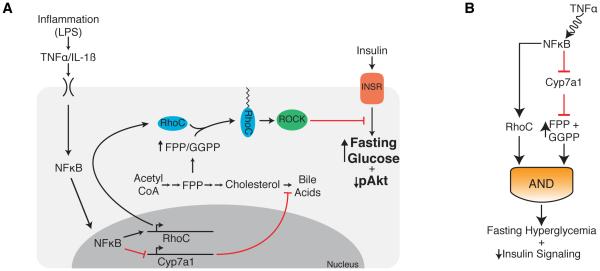
Control of plasma glucose level is essential to organismal survival. Sustained inflammation has been implicated in control of glucose homeostasis in cases of infection, obesity, and type 2 diabetes; however, the precise role of inflammation in these complex disease states remains poorly understood. Here, we find that sustained inflammation results in elevated plasma glucose due to increased hepatic glucose production. We find that sustained inflammation suppresses CYP7A1, leading to accumulation of intermediate metabolites at the branch point of the mevalonate pathway. This results in prenylation of RHOC, which is concomitantly induced by inflammatory cytokines. Subsequent activation of RHO-associated protein kinase results in elevated plasma glucose. These findings uncover an unexpected mechanism by which sustained inflammation alters glucose homeostasis.


Figures

Figure 1
Figure 1. Sustained inflammation induces fasting hyperglycemia
(A) Fasting plasma glucose and insulin levels in mice given LPS for 7 days (7D-LPS) or mice receiving PBS as control (n=10/condition). (B) Glucose tolerance test (GTT) in PBS or 7D-LPS treated mice (n=10/condition). (C) Insulin tolerance test (ITT) in PBS or 7D-LPS treated mice (n=5/condition). (D) Hyperinsulinemic-euglycemic clamp was performed on PBS or 7D-LPS treated mice and endogenous glucose production and glucose uptake were measured (n=4-7/condition). (E) Insulin stimulated phosphorylated-AKT on serine 473 (pS473-AKT) was evaluated in tissues from overnight fasted PBS or 7D-LPS mice. Bar plots represent densitometry analysis of pS473-AKT/AKT (n=3-4/condition). Data is presented as mean ± SEM. * p < 0.05, ** p < 0.01, *** p < 0.001, **** p < 0.0001 by Student’s T-Test. # p < 0.05, ## p < 0.01 by two-way analysis of variance (2-ANOVA). See also Figure S1.
Figure 2
Figure 2. Sustained inflammation suppresses primary hepatocyte insulin signaling
(A) Insulin-stimulated pS473-AKT in primary hepatocytes after 2 days of 2ng/mL TNF (2D-TNF) treatment. Bar plots represent densitometry analysis of pS473-AKT/AKT (n=3/condition). (B) Insulin-stimulated phosphorylation of targets downstream of AKT after 2D-TNF treatment. (C) Phosphorylation of insulin receptor substrate 1 (IRS-1) on serine 307 after 1 hour or 2 days TNF treatment. (D) Insulin-stimulated pS473-AKT in hepatocytes isolated from mice with targeted replacement of IRS-1 serine 307 with alanine (A/A) or control (S/S) after 2D-TNF treatment. Data is presented as mean ± SEM. * p < 0.05, ** p < 0.01, *** p < 0.001, **** p < 0.0001 by Student’s T-Test. See also Figure S2.
Figure 3
Figure 3. Suppression of CYP7A1 is required for induction of fasting hyperglycemia by sustained inflammation
(A) Insulin-stimulated pS473-AKT in primary hepatocytes transduced with control adenovirus [Ad-CMV] or adenovirus expressing dominant negative IκBα [Ad-IκBα(DN)] after treatment with 2D-TNF. All cells were cultured in the presence of 10µM zVAD-FMK, which did not change the effect of 2D-TNF treatment on insulin-stimulated pS473-AKT in the absence of adenoviral transduction (data not shown). (B) Heat map displaying the fold change in mRNA expression, as measured by microarray, after either 2 hours or 2 days of TNF treatment. Expression levels were normalized to untreated controls (not shown) and displayed as relative values (log2). (C) Pathway analysis on the subset of genes suppressed >1.5-fold after 2D-TNF treatment, but unchanged after 2 hours of TNF treatment. (D) CYP7A1 expression in primary hepatocytes after 2D-TNF treatment (n=3/condition). (E) CYP7A1 expression in primary hepatocytes treated as described in Figure 3A (n=3/condition). (F) CYP7A1 expression in primary hepatocytes treated with 2D-TNF +/− 10µM TO901317 (n=3/condition). (G) Insulin-stimulated pS473-AKT and CYP7A1 levels in primary hepatocytes treated with 2D-TNF and 10µM TO901317 or DMSO control. (H) Insulin-stimulated pS473-AKT in primary hepatocytes isolated from mice with a liver specific transgenic expression of CYP7A1 (CYP7A1-TG) or wild type (WT) mice after 2D-TNF treatment. (I) Fasting glucose levels in WT and CYP7A1-TG animals after treatment with 7D-LPS or PBS (n=3-5/condition). Data is presented as mean ± SEM. * p < 0.05, ** p < 0.01, *** p < 0.001, **** p < 0.0001 by Student’s T-Test. See also Figure S3 and Table S1.
Figure 4
Figure 4. Regulation of CYP7A1 does not have transcriptional effects on FXR target genes or 7D-LPS responsiveness
(A) Serum total bile acids in mice treated with 7D-LPS or PBS (n=5/condition). (B) Heat map displaying fold change of mRNA expression, as measured using RNA sequencing, in whole livers from WT and CYP7A1-TG animals treated with 7D-LPS or PBS. Expression levels were normalized to WT, Untreated livers (not shown), and fold change plotted as log2 values. (C) Heatmap of FXR target genes from RNA sequencing experiment. Values represent log10 of FPKM+1. (D-E) Expression analysis of genes in the FXR pathway (SHP, APOE, ABCB11) and TNF in WT and CYP7A1-TG animals treated with 7D-LPS or PBS (n=4-6/condition). (F) Heatmap representing sample relatedness as calculated by Jensen-Shannon divergence. Lower numbers mean samples are similar, or more related. Data is presented as mean ± SEM. * p < 0.05, ** p < 0.01 by Student’s T-Test. See also Figure S4 and Table S2.
Figure 5
Figure 5. Accumulation of intermediate metabolites in the mevalonate pathway mediate inflammatory control of glucose homeostasis
(A) Diagram of the mevalonate pathway with molecules (black) and enzymes (green). (B) Farnesyl pyrophosphate, FPP, and geranylgeranyl pyrophosphate, GGPP, levels in primary hepatocytes treated with 2D-TNF (n=6/condition). (C) FPP and GGPP levels in WT or CYP7A1-TG primary hepatocytes treated with 2D-TNF (n=6/condition). (D) FPP and GGPP levels in primary hepatocytes treated with 2D-TNF and 10µM atorvastatin hemicalcium or DMSO (n=6/condition). (E) Insulin stimulated pS473-AKT in primary hepatocytes treated with 2D-TNF and 10µM atorvastatin or DMSO. (F) Fasting glucose levels in mice treated with PBS or 7D-LPS and 10mg/kg/day atorvastatin or vehicle control (n=8-10/condition). Data is presented as mean ± SEM. * p < 0.05, ** p < 0.01, *** p < 0.001, **** p < 0.0001 by Student’s T-Test. See also Figure S5.
Figure 6
Figure 6. RHO-associated protein kinase as a mediator of sustained inflammatory control of glucose homeostasis
(A) Insulin-stimulated pS473-AKT in primary hepatocytes treated with 2D-TNF and prenyltransferase inhibitors, PTIs, (1µM LB42708 and 10µM GGTI-2133). (B) Expression of genes with known isoprenylation motifs in primary hepatocytes after 2D-TNF treatment (n=3/condition). (C) RHOC expression in primary hepatocytes treated as described in Figure 3A (n=3/condition). (D) RHOC and GTP-bound RHOC protein levels in primary hepatocytes treated with 2D-TNF and PTIs or DMSO. (E) Myosin light chain 2 (MLC2) phosphorylation on serine 19 (pS19-MLC2) in primary hepatocytes treated with 2D-TNF and PTIs or DMSO. (F) Insulin-stimulated pS473-AKT in primary hepatocytes treated with 2D-TNF and one of two Rho-associated protein kinase (ROCK) inhibitors, H-1152 (1µM) or Y-27632 (40µM). (G) Fasting glucose levels in mice treated with PBS or 7D-LPS and 30mg/kg/day Y-27632 or vehicle control (n=4-5/condition). (H-I) GTT and AUC of mice fed a HFD for 12 weeks followed by daily injections with 30mg/kg/day Y-27632 or PBS for 2 weeks. During the 2 weeks of injections, mice were maintained on HFD (n=5/condition). (J-K) ITT and AUC of mice treated as in (H-I), (n=6/condition). Data is presented as mean ± SEM. * p < 0.05, ** p < 0.01, *** p < 0.001, **** p < 0.0001 by Student’s T-Test. # p < 0.05, ## p < 0.01 by 2-ANOVA. See also Figures S6 & S7.
Figure 7
Figure 7. Model of how sustained inflammation affects glucose homeostasis
(A) Model depicting the effects of TNF treatment on hepatocyte function. TNF activates NFκB, suppressing CYP7A1, inducing accumulation of FPP and GGPP. Accumulated FPP and GGPP stabilize TNF induced RHOC, which then goes on to activate ROCK, inducing fasting hyperglycemia in mice. (B) The model above can be represented as a coherent feed-forward loop whereby both induction of RHOC and accumulation of FPP and GGPP work together to regulate fasting glucose levels.

Comment in

References

    1. Alon U. Network motifs: theory and experimental approaches. Nat Rev Genet. 2007;8:450–461. - PubMed
    1. Andrews RC, Walker BR. Glucocorticoids and insulin resistance: old hormones, new targets. Clin Sci. 1999;96:513–523. - PubMed
    1. Arkan MC, Hevener AL, Greten FR, Maeda S, Li Z-W, Long JM, Wynshaw-Boris A, Poli G, Olefsky J, Karin M. IKK-beta links inflammation to obesity-induced insulin resistance. Nat Med. 2005;11:191–198. - PubMed
    1. Barbour LA, McCurdy CE, Hernandez TL, Kirwan JP, Catalano PM, Friedman JE. Cellular Mechanisms for Insulin Resistance in Normal Pregnancy and Gestational Diabetes. Diabetes Care. 2007;30:S112–S119. - PubMed
    1. Berglund ED, Li CY, Poffenberger G, Ayala JE, Fueger PT, Willis SE, Jewell MM, Powers AC, Wasserman DH. Glucose metabolism in vivo in four commonly used inbred mouse strains. Diabetes. 2008;57:1790–1799. - PMC - PubMed

Publication types