

Effect of increased protein intake on renal acid load and renal hemodynamic responses
- PMID: 26997623
- PMCID: PMC4823604
- DOI: 10.14814/phy2.12687
Effect of increased protein intake on renal acid load and renal hemodynamic responses
Abstract
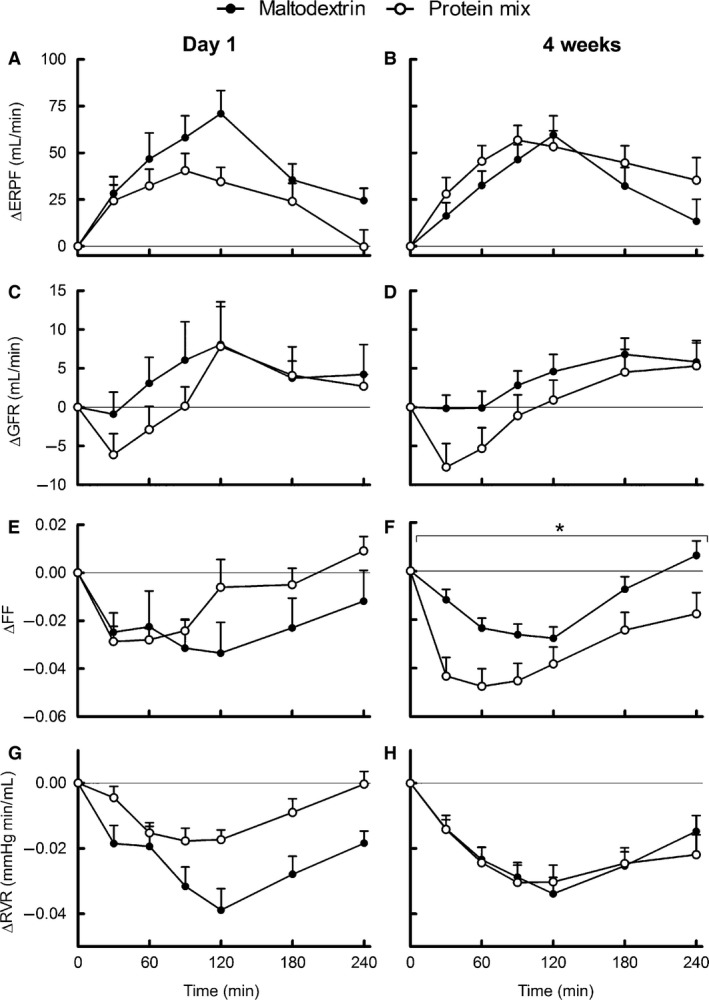
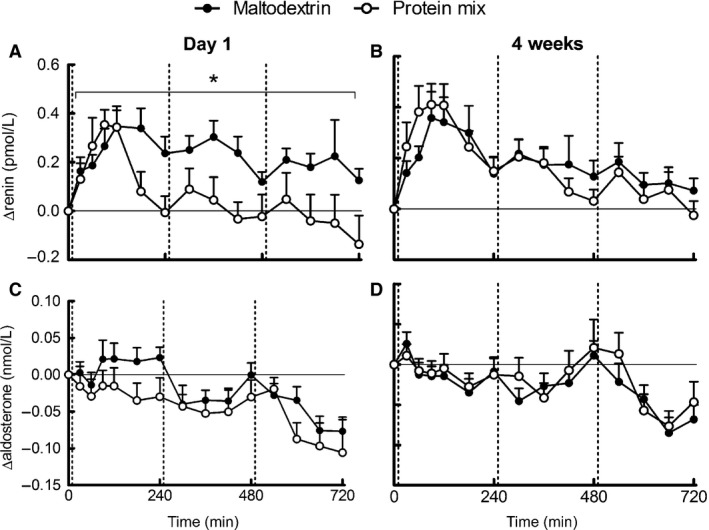
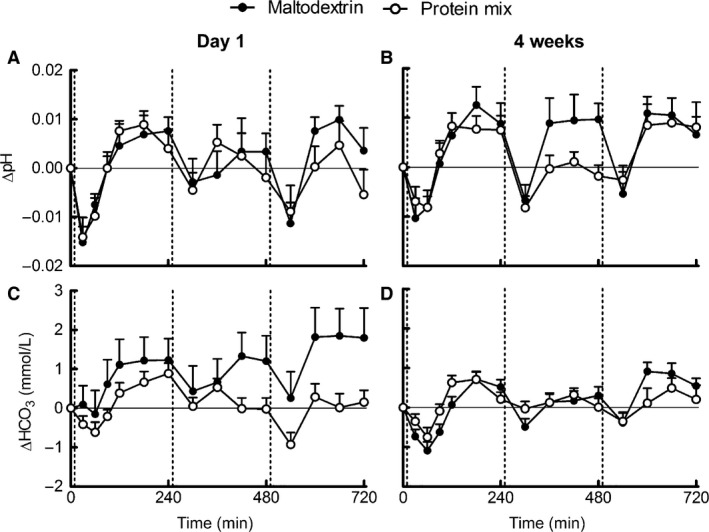
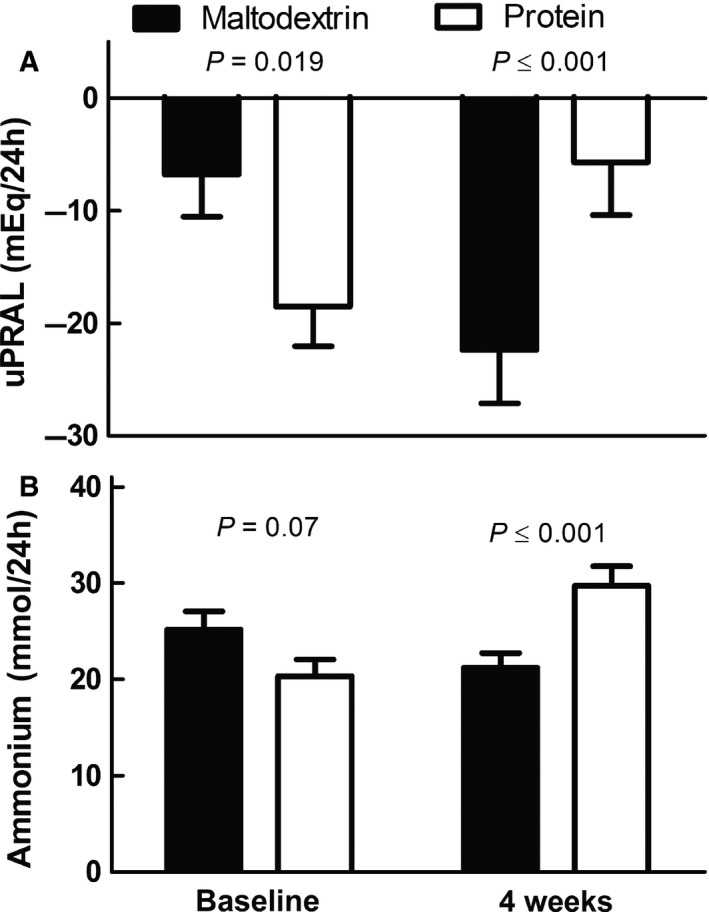
Increased protein intake versus maltodextrin intake for 4 weeks lowers blood pressure. Concerns exist that high-protein diets reduce renal function. Effects of acute and 4-week protein intake versus maltodextrin intake on renal acid load, glomerular filtration rate and related parameters were compared in this study. Seventy-nine overweight individuals with untreated elevated blood pressure and normal kidney function were randomized to consume a mix of protein isolates (60 g/day) or maltodextrin (60 g/day) for 4 weeks in energy balance. Twenty-four-hour urinary potential renal acid load (uPRAL) was compared between groups. A subgroup (maltodextrin N = 27, protein mix N = 25) participated in extra test days investigating fasting levels and postprandial effects of meals supplemented with a moderate protein- or maltodextrin-load on glomerular filtration rate, effective renal plasma flow, plasma renin, aldosterone, pH, and bicarbonate. uPRAL was significantly higher in the protein group after 4 weeks (P ≤ 0.001). Postprandial filtration fraction decreased further after the protein-supplemented breakfast than after the maltodextrin-supplemented breakfast after 4 weeks of supplementation (P ≤ 0.001). Fasting and postprandial levels of glomerular filtration rate, effective renal plasma flow, renin, aldosterone, angiotensin-converting enzyme, pH and bicarbonate did not differ between groups. In conclusion, 4 weeks on an increased protein diet (25% of energy intake) increased renal acid load, but did not affect renal function. Postprandial changes, except for filtration fraction, also did not differ between groups. These data suggest that a moderate increase in protein intake by consumption of a protein mix for 4 weeks causes no (undesirable) effects on kidney function in overweight and obese individuals with normal kidney function.
Keywords: Acid load; carbohydrate; glomerular filtration rate; kidney; protein.
© 2016 The Authors. Physiological Reports published by Wiley Periodicals, Inc. on behalf of the American Physiological Society and The Physiological Society.
Figures
Comment in
-
Increased protein intake and corresponding renal acid load under a concurrent alkalizing diet regime.Physiol Rep. 2016 Jul;4(13):e12851. doi: 10.14814/phy2.12851. Physiol Rep. 2016. PMID: 27405969 Free PMC article. No abstract available.
References
-
- van den Berg, E. , Hospers F. A., Navis G., Engberink M. F., Brink E. J., Geleijnse J. M., et al. 2011. Dietary acid load and rapid progression to end‐stage renal disease of diabetic nephropathy in Westernized South Asian people. J. Nephrol. 24:11–17. - PubMed
-
- Bie, P. , and Astrup A.. 2015. Dietary protein and kidney function: when higher glomerular filtration rate is desirable. Am. J. Clin. Nutr. 102:3–4. - PubMed
-
- Bosch, J. P. , Lew S., Glabman S., and Lauer A.. 1986. Renal hemodynamic changes in humans. Response to protein loading in normal and diseased kidneys. Am. J. Med. 81:809–815. - PubMed
-
- Brosnan, J. T. , and Brosnan M. E.. 2006. The sulfur‐containing amino acids: an overview. J. Nutr. 136:1636S–1640S. - PubMed
Publication types
MeSH terms
Substances
LinkOut - more resources
Full Text Sources
Other Literature Sources
Medical
