. 2016 Apr 12;6(4):496-510.
doi: 10.1016/j.stemcr.2016.02.011. Epub 2016 Mar 17.

Establishment of In Vitro FUS-Associated Familial Amyotrophic Lateral Sclerosis Model Using Human Induced Pluripotent Stem Cells

Affiliations

Establishment of In Vitro FUS-Associated Familial Amyotrophic Lateral Sclerosis Model Using Human Induced Pluripotent Stem Cells

Naoki Ichiyanagi et al. Stem Cell Reports. .

Abstract

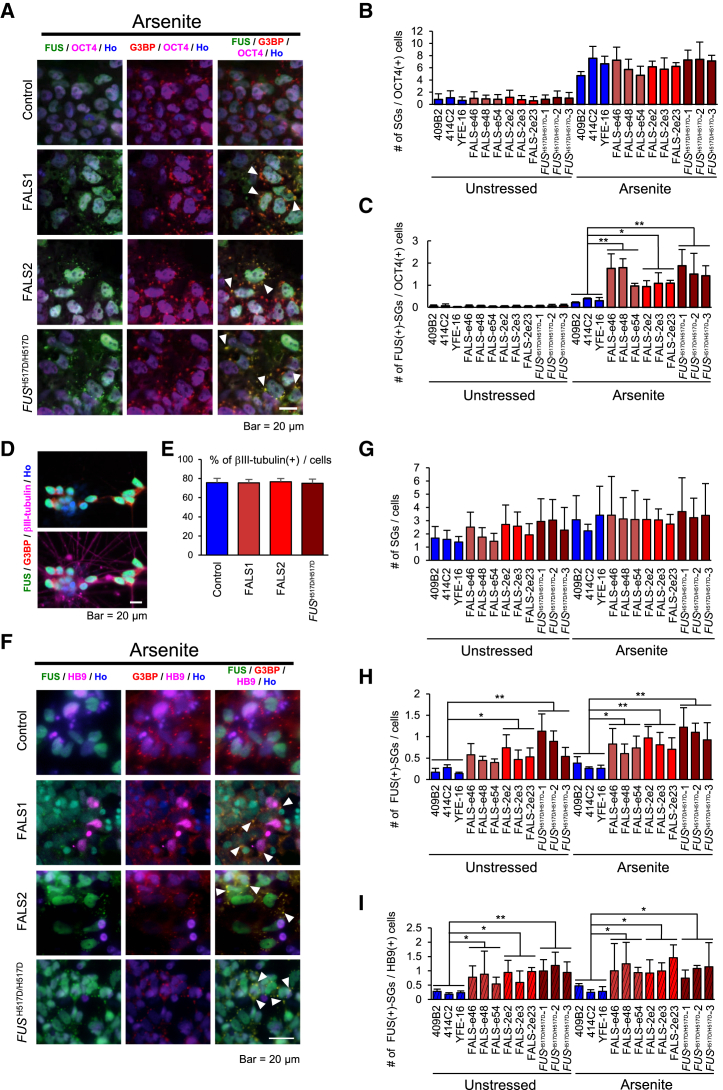
Amyotrophic lateral sclerosis (ALS) is a late-onset motor neuron disorder. Although its neuropathology is well understood, the cellular and molecular mechanisms are yet to be elucidated due to limitations in the currently available human genetic data. In this study, we generated induced pluripotent stem cells (iPSC) from two familial ALS (FALS) patients with a missense mutation in the fused-in sarcoma (FUS) gene carrying the heterozygous FUS H517D mutation, and isogenic iPSCs with the homozygous FUS H517D mutation by genome editing technology. These cell-derived motor neurons mimicked several neurodegenerative phenotypes including mis-localization of FUS into cytosolic and stress granules under stress conditions, and cellular vulnerability. Moreover, exon array analysis using motor neuron precursor cells (MPCs) combined with CLIP-seq datasets revealed aberrant gene expression and/or splicing pattern in FALS MPCs. These results suggest that iPSC-derived motor neurons are a useful tool for analyzing the pathogenesis of human motor neuron disorders.


Figures

None
Graphical abstract
Figure 1
Figure 1
Characterization of iPSCs and Differentiation into Motor Neurons (A) Human dermal fibroblasts from two ALS patients who carried the FUS H517D heterozygous mutation (C-to-G heterozygous mutation); the mutation was maintained in the generated iPSCs. (B) Representative image of immunochemical analysis of pluripotent markers, OCT4, SSEA4 and TRA-1-60. Control, YFE-16; FALS, FALS-2e2. The same images are shown in Figure S1B. The scale bar represents 200 μm. (C) Representative karyotypes of the generated FALS1 and FALS2 iPSC lines are shown. (D) Representative image of immunocytochemistry for the neural stem cell marker (SOX2) and motor neuron progenitor markers (OLIG2 and ISLET1). The scale bar represents 20 μm. (E) Quantitative data of the ratio of each MPC marker-positive cell/Hoechst-positive cell (n = 3 independent experiments; means ± SD; Tukey's test). (F) Representative image of immunocytochemistry for motor neuron markers (HB9, ISLET1 and SMI32) and other neural markers (βIII-TUBULIN, MAP2, VGLUT1 and GLUR1). The scale bars represent 60 μm. (G) Quantitative data of the ratio of each marker-positive cell/βIII-TUBULIN-positive cell (n = 3 independent experiments; mean ± SD; Tukey's test).
Figure 2
Figure 2
Exon Array Analysis Using MPCs and Comparison with FUS CLIP-Seq (A) Scatterplot analysis of gene expression using control and FALS MPCs. A total of 124 genes were upregulated (blue) and 35 were downregulated (red) in FALS MPCs compared with control MPCs. (B) The heatmap of correlation coefficients. (C) Major GO terms showed both increases and decreases in gene expression in FALS versus control MPCs. (D) Reanalysis of previously reported CLIP-seq (Lagier-Tourenne et al., 2012). (E) Quantitative RT-PCR analysis of the expression levels for eight randomly selected genes in control and FALS iPSC-derived MPCs. Solid and hatched bars show qRT-PCR and exon array data, respectively (n = 3–6 independent samples; mean ± SD; Dunnett's test).
Figure 3
Figure 3
Alternative Splicing Analysis on MPCs (A) The plots of the expression levels in exon probes. Red and blue lines show control and FALS expression levels, respectively. The yellow arrows show the change points of splicing between controls and FALS in each gene. (B) RT-PCR of splicing variants in RSU1, RPH3AL and EFCAB13 in iPSC-derived MPCs. The PCR cycle validated the PCR cycle numbers. (C) Schematic figure of alternative splicing in each gene (left) and the measurement of the expression level of each of the spliced bands in (B) (right) (n = 3–6 independent samples; mean ± SD; p < 0.05; ∗∗∗p < 0.001; Student's t test). (D) RT-PCR of splicing variants in RSU1, RPH3AL and EFCAB13 in 409B2 and FUSH517D/H517D-1 iPSC-derived MPCs. (E) Expression levels of each of the spliced bands in (D) (n = 3 independent experiments; mean ± SD; p < 0.05; Student's t test).
Figure 4
Figure 4
FUS Localization in iPSCs and iPSC-Derived Neurons (A) Schematic diagram of FUS. The H517D mutation is located in the nuclear localization signal; RRM, RNA recognition motif; R/G, R/G rich region; Z, zinc finger domain. (B) Representative images of immunocytochemistry for FUS in iPSCs. Arrowheads indicate cytosolic FUS. The scale bar represents 20 μm. (C) Quantitative data of the percentages of cytosolic FUS ratio per OCT4-positive cells in iPSCs (n = 3 independent experiments; mean ± SD; ∗∗p < 0.01; Dunnett's test). (D) Representative images of immunocytochemistry for FUS in iPSC-derived neurons. Arrowheads indicate cytosolic FUS. The scale bar represents 20 μm. (E) Quantitative data of the percentage of cytosolic FUS ratio per Hoechst-positive cell in iPSC-derived neurons (n = 3 independent experiments; mean ± SD; p < 0.05, ∗∗p < 0.01; Dunnett's test). (F) Quantitative data of the percentage of cytosolic FUS ratio per HB9-positive cell in iPSC-derived neurons (n = 3 independent experiments; mean ± SD; ∗∗p < 0.01; Dunnett's test).
Figure 5
Figure 5
FUS Protein Localization into Stress Granules (A) Representative images of immunocytochemistry for SG in iPSCs under 0.5 mM sodium arsenite stress conditions. FUS in FALS and FUSH517D/H517D iPSCs co-localized with the SG marker G3BP (arrowhead), whereas FUS in control iPSCs remained in the nucleus. The scale bar represents 20 μm. In (A)–(I) images or graphs, Arsenite means addition of 0.5 mM sodium arsenite, 1 hr treatment. (B) Quantitative data of the number of SGs per OCT4-positive cell in iPSCs (n = 3 independent experiments; mean ± SD; Dunnett's test). (C) Quantitative data of the number of FUS-positive SGs per OCT4-positive cell in iPSCs (n = 3 independent experiments; mean ± SD; p < 0.05, ∗∗p < 0.01; Dunnett's test). (D) Representative images of immunocytochemistry for βIII-TUBULIN-positive neurons. The scale bar represents 20 μm. (E) Quantitative data of the percentage of βIII-TUBULIN-positive neurons (n = 3 independent experiments; mean ± SD; Dunnett's test). (F) Representative images of immunocytochemistry for SG in iPSC-derived neurons under 0.5 mM sodium arsenite stress conditions. FUS co-localized with the SG marker G3BP (arrowhead). The scale bar represents 20 μm. (G) Quantitative data of the number of SGs per Hoechst-positive cell in iPSC-derived neurons (n = 3 independent experiments; mean ± SD; Dunnett's test). (H) Quantitative data of the number of FUS-positive SGs per Hoechst-positive cell in iPSC-derived neurons (n = 3 independent experiments; mean ± SD; p < 0.05, ∗∗p < 0.01; Dunnett's test). (I) Quantitative data of the number of FUS-positive SGs per HB9-positive cell in iPSC-derived neurons (n = 3 independent experiments; mean ± SD; p < 0.05, ∗∗p < 0.01; Dunnett's test).
Figure 6
Figure 6
Shorter Neurites in FALS iPSC-Derived Motor Neurons (A) Representative images of HB9::Venus-positive living motor neurons. The scale bars represent 50 μm. (B) Representative images of immunocytochemistry for HB9::Venus-positive motor neurons with anti-GFP antibody. The scale bar represents 20 μm. In (B)–(D) images or graphs, Arsenite means 1.0 mM sodium arsenite, 1 hr treatment; Glutamate means 1.0 mM glutamate, 24 hr treatment. (C) Quantitative data of the neurite length of βIII-TUBULIN-positive neurons (n = 3 independent experiments; mean ± SD; Dunnett's test). (D) Quantitative data of the neurite length of GFP-positive motor neurons (n = 3 independent experiments; mean ± SD; ∗∗p < 0.01; Dunnett's test).
Figure 7
Figure 7
Enhanced Apoptosis in FALS iPSC-Derived Motor Neurons (A) Representative images of immunocytochemistry for apoptotic HB9-positive motor neurons using markers for apoptosis (cleaved-CASPASE3), immature neurons (βIII-TUBULIN), and motor neurons (HB9). Arrowheads indicate HB9 positive cells. The scale bars represent 20 μm. In (A)–(C) images or graphs, Arsenite means 0.5 mM sodium arsenite, 1 hr treatment; Glutamate means 3.0 mM glutamate, 24 hr treatment. (B) Quantitative data of the ratio of cleaved-CASPASE3-positive cells in βIII-TUBULIN-positive neurons (n = 3 independent experiments; mean ± SD; p < 0.05, ∗∗p < 0.01; Dunnett's test). (C) Quantitative data of the ratio of cleaved-CASPASE3-positive cells in HB9-positive motor neurons (n = 3 independent experiments; mean ± SD; p < 0.05, ∗∗p < 0.01; Dunnett's test).

References

    1. Akiyama T., Warita H., Kato M., Nishiyama A., Izumi R., Ikeda C., Kamada M., Suzuki N., Aoki M. Genotype-phenotype relationships in familial ALS with FUS/TLS mutations in Japan. Muscle Nerve. 2016 - PubMed
    1. Almeida S., Gascon E., Tran H., Chou H.J., Gendron T.F., Degroot S., Tapper A.R., Sellier C., Charlet-Berguerand N., Karydas A. Modeling key pathological features of frontotemporal dementia with C9ORF72 repeat expansion in iPSC-derived human neurons. Acta Neuropathol. 2013;126:385–399. - PMC - PubMed
    1. Aruga J., Mikoshiba K. Identification and characterization of Slitrk, a novel neuronal transmembrane protein family controlling neurite outgrowth. Mol. Cell. Neurosci. 2003;24:117–129. - PubMed
    1. Atkin J.D., Farg M.A., Turner B.J., Tomas D., Lysaght J.A., Nunan J., Rembach A., Nagley P., Beart P.M., Cheema S.S. Induction of the unfolded protein response in familial amyotrophic lateral sclerosis and association of protein-disulfide isomerase with superoxide dismutase 1. J. Biol. Chem. 2006;281:30152–30165. - PubMed
    1. Aulas A., Stabile S., Vande Velde C. Endogenous TDP-43, but not FUS, contributes to stress granule assembly via G3BP. Mol. Neurodegener. 2012;7:54. - PMC - PubMed

Publication types

MeSH terms