. 2016 Mar 13:10:5-18.
doi: 10.4137/BBI.S38075. eCollection 2016.

Modeling Intercellular Communication as a Survival Strategy of Cancer Cells: An In Silico Approach on a Flexible Bioinformatics Framework

Affiliations

Modeling Intercellular Communication as a Survival Strategy of Cancer Cells: An In Silico Approach on a Flexible Bioinformatics Framework

Maura Cárdenas-García et al. Bioinform Biol Insights. .

Abstract

Intercellular communication is very important for cell development and allows a group of cells to survive as a population. Cancer cells have a similar behavior, presenting the same mechanisms and characteristics of tissue formation. In this article, we model and simulate the formation of different communication channels that allow an interaction between two cells. This is a first step in order to simulate in the future processes that occur in healthy tissue when normal cells surround a cancer cell and to interrupt the communication, thus preventing the spread of malignancy into these cells. The purpose of this study is to propose key molecules, which can be targeted to allow us to break the communication between cancer cells and surrounding normal cells. The simulation is carried out using a flexible bioinformatics platform that we developed, which is itself based on the metaphor chemistry-based model.

Keywords: bioinformatics framework; cancer cells; in silico experiments; intracellular communication.


Figures

Figure 1
Figure 1
Wnt/β-catenin canonical pathway. When it is off, as most of the time occurs in normal cells, the β-catenin is linked to an enzyme complex that phosphorylates it? And this phosphorylation favors its ubiquitinylation and posterior emeute degradation in the proteasome. When the pathway is turned on, β-catenin promotes the transcription of genes involved in proliferation, differentiation, adhesion, and cell survival. Wnt cross talks with the MAPK pathway-related cytoskeletal rearrangement and cell survival way and G proteins. Red arrows indicate inhibition, green arrows indicate activation, previously modeled parts are shown in violet, and the new interactions added to the model in purple.
Figure 2
Figure 2
Wnt cross talk. Cross activation of Wnt/β-catenin with Notch, EGF, Hh, TGFb, hypoxia, and other pathways that activate RTK interactions. All these pathways are incorporated in our model. For a better understanding of the figure, only some components of the signaling pathway are shown. Red arrows indicate inhibition, green arrows indicate activation, violet arrows indicate consequence, previously modeled parts are shown in light blue, and the new interactions added to the model in blue.
Figure 3
Figure 3
Different types of intercellular junctions, particularly Wnt/β-catenin regulates the formation of adherents junctions. As shown, both cells should produce the same protein junctions. If this does not occur, junctions do not form.
Figure 4
Figure 4
Main GUI of bioinformatics platform BTSSOC-Cellulat.
Figure 5
Figure 5
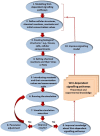
Modeling and simulation workflow.
Figure 6
Figure 6
Simplification of the interactions modeled in this study.
Figure 7
Figure 7
The general role of the proteins used for in silico experiments. APC protein is a part of the complex that favors ubiquitination of β-catenin and thus its destruction and NKD2 inhibits the disruption, promoting the complex of β-catenin. Usually, when the Wnt/β-catenin pathway is inactive, ie, Wnt has not joined its FZD receptor, β-catenin linked to the degradation complex (Axin, APC, CKI, and GSK-β), and in the β complex, catenin is phosphorylated at residues 33, 35, 41 and 47. Then the protein is ubiquitinated and subsequently degraded by the proteasome. NKD2 inhibits the DVL, and DVL prevents β-catenin phosphorylation and degradation.
Figure 8
Figure 8
APC = 0.001 μM. On the chart, the x-axis represents the time in milliseconds, and the y-axis represents the concentration of reactants in micromolar. With the lowest level, we should expect about 2,500 ms to observe the disappearance of β-CateninCyt and DVL. Only the receptor and Wnt remain present.
Figure 9
Figure 9
APC = 0.01 μM. On the chart, the x-axis represents the time in milliseconds, and the y-axis represents the concentration of reactants in micromolar. At this level, it was observed that β-CateninCyt and DVL disappear within 1,000–3,000 ms, something similar happens with concentrations of 0.1 and 1 μM. Only the receptor and Wnt remain present.
Figure 10
Figure 10
APC = 10 μM. On the chart, the x-axis represents the time in milliseconds, and the y-axis represents the concentration of reactants in micromolar. For concentrations of 10, 100, and 1,000 μM, DVL is not observed, and β-CateninCyt disappears after 2,500 ms. Note that in all cases the concentration of the FZD receptor is maintained or increases apparently due to having no response to the binding of Wnt; new receptors appear, since Wnt exists in the cytoplasm.
Figure 11
Figure 11
NKD2 = 0.001 μM. On the chart, the x-axis represents the time in milliseconds and the y-axis represents the concentration of reactants in micromolar. For the first concentration of 0.001 μM, β-CateninCyt disappears after 1,000 ms, and DVL is not observed.
Figure 12
Figure 12
NKD2 = 0.01 μM. On the chart, the x-axis represents the time in milliseconds, and the y-axis represents the concentration of reactants in micromolar. The disappearance of β-CateninCyt is even faster, 500 ms, when using a concentration of 0.01 μM.
Figure 13
Figure 13
NKD2 = 0.1 μM. On the chart, the x-axis represents the time in milliseconds, and the y-axis represents the concentration of reactants in micromolar. Interestingly, for this concentration, DVL disappearance occurs after 3,000 ms and β-CateninCyt after 100 ms, something similar happens with a concentration of 1 μM.
Figure 14
Figure 14
NKD2 = 10 μM. On the chart, the x-axis represents the time in milliseconds, and the y-axis represents the concentration of reactants in micromolar. For this concentration, β-CateninCyt is not observed and DVL disappears after 2,000 ms.
Figure 15
Figure 15
NKD2 = 100 μM. On the chart, the x-axis represents the time in milliseconds and the y-axis represents the concentration of reactants in micromolar. For 100 and 1,000 μM concentrations, similar behavior is observed. β-CateninCyt and DVL are not seen.

References

    1. Niklas KJ, Newman SA. The origins of multicellular organisms. Evol Dev. 2013;15:41–52. - PubMed
    1. Brücher BLDM, Jamall IS. Cell-cell communication in the tumor microenvironment, carcinogenesis, and anticancer treatment. Cell Physiol Biochem. 2014;34:213–43. - PubMed
    1. Lum L, Chen C. Chemical disruption of WNT-dependent cell fate decision-making mechanisms in cancer and regenerative medicine. Curr Med Chem. 2015;22(35):4091–103. - PMC - PubMed
    1. Stamos JL, Weis WL. The β-catenin destruction complex. Cold Spring Harb Perspect Biol. 2013;5(1):a007898. - PMC - PubMed
    1. Vinken M. Non-channel functions of connexins in cell growth and cell death. Biochim Biophys Acta. 2012;1818(8):2002–8. - PubMed

LinkOut - more resources