. 2016 Jan;2(1):20-27.
doi: 10.4103/2394-8108.178544. Epub 2016 Mar 11.

Magnetic Resonance Imaging of Cerebral Blood Flow in Animal Stroke Models

Affiliations

Magnetic Resonance Imaging of Cerebral Blood Flow in Animal Stroke Models

Qiang Shen et al. Brain Circ. 2016 Jan.

Abstract

Perfusion could provide useful information on metabolic and functional status of tissue and organs. This review summarizes the most commonly used perfusion measurement methods: dynamic susceptibility weighted contrast (DSC) and arterial spin labeling (ASL) and their applications in experimental stroke. Some new developments of CBF techniques in animal models are also discussed.

Keywords: arterial spin labeling (ASL); dynamic susceptibility weighted contrast (DSC); functional MRI; perfusion MRI.


Conflict of interest statement

There are no conflicts of interest.

Figures

Figure 1
Figure 1
Representative (a) ADC and (b) CBF maps from one animal. The gray scale bar indicates ADC ranges from 0 mm2/s to 0.001 mm2/s and CBF ranges from -1 mL/g/min to 2 mL/g/min (c) Temporal progression of ADC-defined and CBF-defined lesion volumes (LVs) determined by using the group average viability thresholds (57% and 30% reduction for CBF and ADC, respectively) (d) Correlation ADC-defined or CBF-defined LV versus TTC-infarct volumes. Correlation coefficient (r) and one-to-one correspondence (y = x) coefficient (R) were calculated. Group I CBF (r = 0.98, R = 0.95), group II CBF (r = 0.95, R = 0.92), group I ADC (r = 0.94, R = 0.99), and group II ADC (r = 0.93, R = 0.99). Adapted from reference[13]
Figure 2
Figure 2
Arterial spin labeling (ASL) cerebral blood flow (CBF) image, dynamic susceptibility contrast (DSC) CBF image, and ASL:DSC ratio maps from one animal of each of the three experimental groups. In the stroke animal (top row), the stroke lesion shows hyperperfusion. ASL yields a higher CBF than DSC. In the hypercapnia animal (middle row), CBF increases globally. ASL- and DSC-CBF maps show similar increases. In a normal animal injected with mannitol (bottom row), CBF increases in the affected hemisphere. ASL yields a higher CBF increase than DSC. Adapted from reference[5]
Figure 3
Figure 3
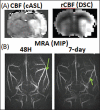
(a) Cerebral blood flow (CBF) maps obtained by continuous arterial spin labeling (cASL) and DSC 48 h after occlusion from the same animal. Display CBF scale is 0-2 mL/g/min. DSC and cASL showed essentially identical hyperperfusion territories (b) Maximum intensity projection (MRA) at 48 h (thicker and brighter blood vessels with many smaller branches becoming more apparent in the ipsilateral hemisphere) and 7 days after occlusion (similar size and brightness in both hemispheres but tortuous in the ipsilateral hemisphere) from the same animal. Adapted from reference[21]
Figure 4
Figure 4
Representative CBF and ADC maps, ISODATA clusters overlaid on ADC maps, ΔCBFCO2 and ΔBOLDCO2 percent change maps overlaid on CBF images of a rat subjected to permanent focal ischemia at the 30-min time point. ISODATA cluster analysis yielded “normal” (blue), “perfusion-diffusion mismatch” (green), and “ischemic core” (red) clusters. Hypercapnia-induced CBF increase was essentially absent in regions with perfusion deficit (core and mismatch). Interestingly, hypercapnia-induced BOLD response was still observable in the mismatch region. Grayscale bar indicates ADC 0-0.001 mm2/s and CBF 0-3 mL/g/min. Color bar indicates ΔCBF 10-400% and ΔBOLD 1-10%. Adapted from reference[22]
Figure 5
Figure 5
The CBF and BOLD fMRI responses and spatial profiles at 100 × 76 × 1,000 μm3 obtained using a smaller surface coil. CBF fMRI responses peaked in layers IV-V, dropped off in layers I-II and VI, whereas the BOLD fMRI responses peaked in the superficial layers II-III. The distance from 0 μm to 2,000 μm is from the cortical surface to corpus callosum boundary. Data were obtained from two animals with three repeated fMRI trials for each animal (mean ± SD). Adapted from reference[23]
Figure 6
Figure 6
(a) CBF images of cASL and IR-cASL acquisition (horizontal view) showed similarly good CBF contrast (b) CBF values versus labeling durations. Whole-brain CBF values were similar across different labeling durations. Scale bars indicate CBF units in mL/g/min (c) Temporal standard deviation maps of cASL and IR-cASL acquisition (LD = 2s) (d) Temporal standard deviations (SDs) of cASL and IR-cASL versus labeling durations. The whole-brain temporal SD of IR-cASL was significantly (P < 0.05) smaller than that of cASL for LD = 1.4-2.0 s because of the BS effect. At LD = 3.0 s, magnetization mostly recovered toward equilibrium and thus, IR-cASL and cASL yielded similar temporal SD as expected (P = 0.09). Adapted from reference[30]
Figure 7
Figure 7
Multislice high spatial resolution CBF images of a rat brain at 75 × 56 × 1,000 μm3 from one animal. Excellent blood-flow contrasts were observed among different cortical and subcortical structures. CBF MRI showed column-like alternating bright and dark bands in the neocortices, reflecting the layout of descending arterioles and ascending venules, respectively. Adapted from reference[23]
Figure 8
Figure 8
Higher resolution CBF (a) images, and (b) profiles at 50 × 38 × 1,000 μm3 obtained using the smaller surface coil. In B, the distance from 0 μm to 2,000 μm is from cortical surface to corpus callosum boundary. Data were obtained from 4 animals (mean ± SD). CBF MRI showed lamina-like alternating bright and dark layers across the cortical thicknesses, consistent with the underlying vascular density. CBF profiles across the cortical thickness showed two peaks in layer IV and VI and a shallow trough in layer V. Adapted from reference[23]
Figure 9
Figure 9
High-resolution CBF maps of a MCAO stroke rat before and after reperfusion. The rat was reperfused after 90-min CBF acquisition. During MCAO, regions of normal perfusion and hypoperfusion were heterogeneous. Recannulation was successful and perfusion image showed heterogeneous blood flow with regions of hypoperfusion (i.e., thalamus) and hyperperfusion (i.e., S2) (Unpublished data)
Figure 10
Figure 10
Multislice mouse CBF images at 100 × 100 × 1,000 μm3. CBF images showed heterogeneous blood flow contrast, as expected. CBF is lower in the corpus callosum (white matter) compared to gray matter. Adapted from reference[32]

References

    1. Jahng GH, Li KL, Ostergaard L, Calamante F. Perfusion magnetic resonance imaging: A comprehensive update on principles and techniques. Korean J Radiol. 2014;15:554–77. - PMC - PubMed
    1. Rosen BR, Belliveau JW, Vevea JM, Brady TJ. Perfusion imaging with NMR contrast agents. Magn Reson Med. 1990;14:249–65. - PubMed
    1. Edelman RR, Mattle HP, Atkinson DJ, Hill T, Finn JP, Mayman C, et al. Cerebral blood flow: Assessment with dynamic contrast-enhanced T2*-weighted MR imaging at 1.5 T. Radiology. 1990;176:211–20. - PubMed
    1. Østergaard L. Principles of cerebral perfusion imaging by bolus tracking. J Magn Reson Imaging. 2005;22:710–7. - PubMed
    1. Tanaka Y, Nagaoka T, Nair G, Ohno K, Duong TQ. Arterial spin labeling and dynamic susceptibility contrast CBF MRI in postischemic hyperperfusion, hypercapnia, and after mannitol injection. J Cereb Blood Flow Metab. 2011;31:1403–11. - PMC - PubMed