

doi: 10.1038/ng.3531.
Epub 2016 Mar 21.
Genetic predisposition for beta cell fragility underlies type 1 and type 2 diabetes
Affiliations
- PMID: 26998692
- PMCID: PMC5584070
- DOI: 10.1038/ng.3531
Item in Clipboard
Genetic predisposition for beta cell fragility underlies type 1 and type 2 diabetes
Nat Genet.
2016 May.
Abstract
Type 1 (T1D) and type 2 (T2D) diabetes share pathophysiological characteristics, yet mechanistic links have remained elusive. T1D results from autoimmune destruction of pancreatic beta cells, whereas beta cell failure in T2D is delayed and progressive. Here we find a new genetic component of diabetes susceptibility in T1D non-obese diabetic (NOD) mice, identifying immune-independent beta cell fragility. Genetic variation in Xrcc4 and Glis3 alters the response of NOD beta cells to unfolded protein stress, enhancing the apoptotic and senescent fates. The same transcriptional relationships were observed in human islets, demonstrating the role of beta cell fragility in genetic predisposition to diabetes.
Figures
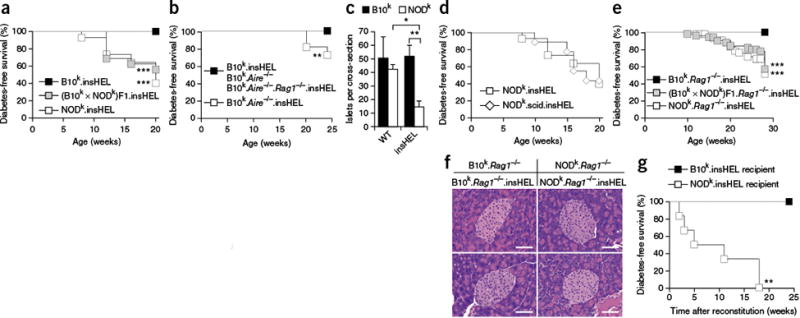
NOD mouse susceptibility to immune-independent diabetes demonstrated through a
sensitized transgenic model. (a) Incidence of diabetes in male
insHEL transgenic mice on the B10k (n = 22),
NODk (n = 43) and (B10k
× NODk)F1 (n = 16) backgrounds. No
diabetes was observed in non-transgenic male littermates. (b)
Incidence of diabetes in male insHEL transgenic mice on the B10k
(n = 22),
B10k.Aire−/−
(n = 11) and
B10k.Aire−/−.Rag1−/−
(n = 23) backgrounds.
B10k.Aire−/− mice
without the insHEL transgene did not develop diabetes (n
= 22). (c) Average number of islets per pancreatic section
in B10k, B10k.insHEL, NODk and
NODk.insHEL mice at 28 weeks of age (n =
4–5 mice/group; WT, wild type). Data are shown as means ± s.e.m.
(d) Incidence of diabetes in male insHEL transgenic mice on the
NODk (n = 43) and NODk.scid
(n = 9) backgrounds. No diabetes was observed in
nontransgenic male littermates. (e) Diabetes incidence in male
insHEL transgenic mice on the
B10k.Rag1−/−
(n = 58), NODk.
Rag1−/− (n
= 44) and (B10k × NODk)F1.
Rag1−/− (n
= 51) backgrounds. (f) Hematoxylin and eosin histology of
pancreatic islets at 28 weeks of age (representative of 7–15
mice/group). Scale bars, 50 μm. (g) B10k.insHEL
mice and NODk.insHEL mice were irradiated and reconstituted with
NODk or B10k bone marrow, respectively, before aging
for diabetes incidence (n = 7 and 6).
*P < 0.05,
**P < 0.001,
***P < 0.0001.
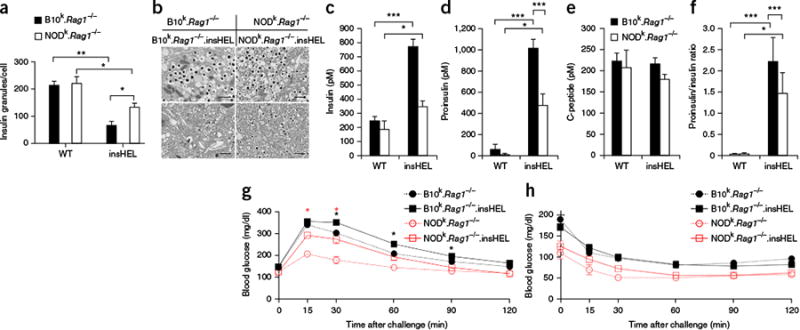
Transgene-induced beta cell stress results in disturbed insulin processing and
glucose intolerance. (a)Electron microscopy of beta cells from
wild-type and insHEL transgenic
B10k.Rag1−/− and
NODk.Rag1−/− mice at
12 weeks of age was used to assess the number of insulin granules per cellular
cross-section (n = 3 mice/group).
(b)Electron microscopy images of the cells described in
a. Images are representative of three mice per group. Scale
bars, 1 μm. (c–f) Fasting serum samples from
B10k.Rag1−/−,
B10k.Rag1−/−.insHEL,
NODk.Rag1−/− and
NODk.Rag1−/−. insHEL
mice at 24 weeks of age were assessed by ELISA for insulin (n
= 10, 33, 9 and 24 mice) (c), proinsulin
(n = 31, 44, 9 and 26 mice) (d),
C-peptide (n = 10, 33, 9 and 24 mice) (e)
and proinsulin/insulin ratio (n = 10, 33, 5 and 24
mice) (f). (g,h) Blood glucose levels in 12-week-old
B10k.Rag1−/−,
B10k.Rag1−/−.insHEL,
NODk.Rag1−/− and
(non-diabetic)
NODk.Rag1−/−.insHEL
mice following a glucose tolerance test (n = 28, 47, 9
and 21 mice) (g) or an insulin tolerance test (n
= 8, 17, 3 and 13 mice) (h). Data are shown as means
± s.e.m. *P < 0.05,
**P < 0.001,
***P < 0.0001.
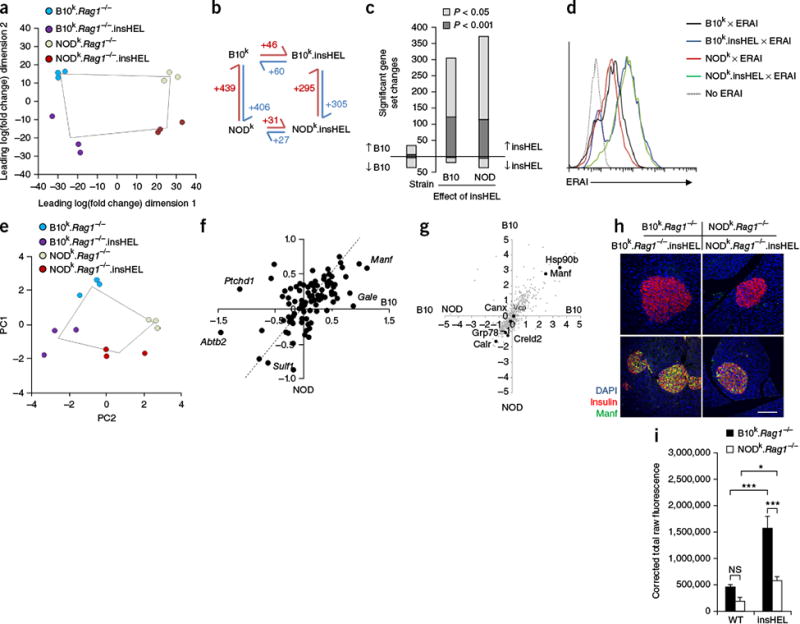
Qualitative rather than quantitative differences in the UPR on the B10 and NOD
backgrounds. (a) Globa principal-components analysis (PCA) of
RNA-seq data for islets (n = 3 mice/group).
(b) Schematic of the number of significant (corrected P
< 0.05) gene expression differences for pairs of sample
conditions. (c) Number of significant gene set changes in gene set
enrichment analysis (GSEA) using cutoffs of P < 0.05
and P < 0.001. (d) ERAI mice were crossed
to B10k.Rag1−/−.insHEL
and NODk.Rag1−/−.insHEL
mice, and islets were analyzed by flow cytometry. Histograms show Xbp1s (Venus)
expression in insulin-expressing beta cells. Results are representative of three
experiments. (e) PCA of the Xbp1 response gene set in islets
(n = 3 mice/group). (f) Scatterplot of
individual Xbp1 response genes, showing the average log2-transformed fold change
in expression induced by insHEL on the B10 background versus the NOD background.
The dashed line indicates equivalent regulation; outlier genes are annotated.
(g) Dot plot of mass spectrometry expression ratios, showing on
each axis the log2-transformed ratio of expression in
B10k.Rag1−/−.insHEL
islets as compared to
NODk.Rag1−/−.insHEL
islets in duplicate experiments. All reproducibly detected proteins are
displayed in gray, with black dots indicating annotated UPR-related proteins.
(h,i) Immunofluorescence of wild-type and insHEL transgenic
islets with a polyclonal antibody to insulin, antibody to Manf and DAPI.
Staining is representative of three experiments (h), with Manf
quantification (n = 10 mice/group) (i).
Scale bar, 100 μm. Data are shown as means ± s.e.m.
*P < 0.05,
***P < 0.0001. NS, not
significant.
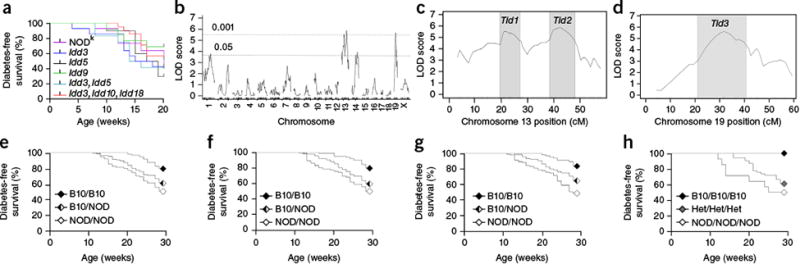
Genetic control of NOD mouse susceptibility to transgene-induced diabetes.
(a) Diabetes incidence in insHEL transgenic male mice on the
NODk background (n = 43) or on
NODk congenic backgrounds homozygous for B6- or B10-derived
chromosomal segments containing the diabetes resistance allele of
Idd3 (n = 14),
Idd5 (n = 10),
Idd9 (n = 13),
Idd3 and Idd5 (n
= 12), and Idd3, Idd10 and
Idd18 (n = 21). (b) A
cohort of (NOD × B10)F2.Rag1-/-.insHEL male
mice (n = 331) was assessed for diabetes incidence at
28 weeks of age and genotyped for 740 informative SNPs. Quantitative trait locus
(QTL) association is shown across the genome. LOD, logarithm of odds.
(c,d) LOD scores for chromosomes 13 (c) and 19
(d), indicating the LOD support intervals (LOD drop of 1) for
the associated Tid1, Tid2 and
Tid3 loci. (e–g) Diabetes development
in the (NOD × B10)F2.Rag1-/-.insHEL cohort
when stratified by genotype at the linkage SNP (rs13481783) in the
Tid1 locus (n = 98, 157 and 75
mice) (e), at the linkage SNP (gnf13.088.732) in the
Tid2 locus (n = 100, 163 and 67
mice) (f) and at the linkage SNP (rs6237466) in the
Tid3 locus (n = 68, 166 and 96
mice) (g). (h) Diabetes development in the (NOD
× B10)F2.Rag1-/-.insHEL cohort with the B10
homozygous, B10/NOD heterozygous (Het) and NOD homozygous genotypes at all Tid
loci (n = 12, 54 and 14 mice).
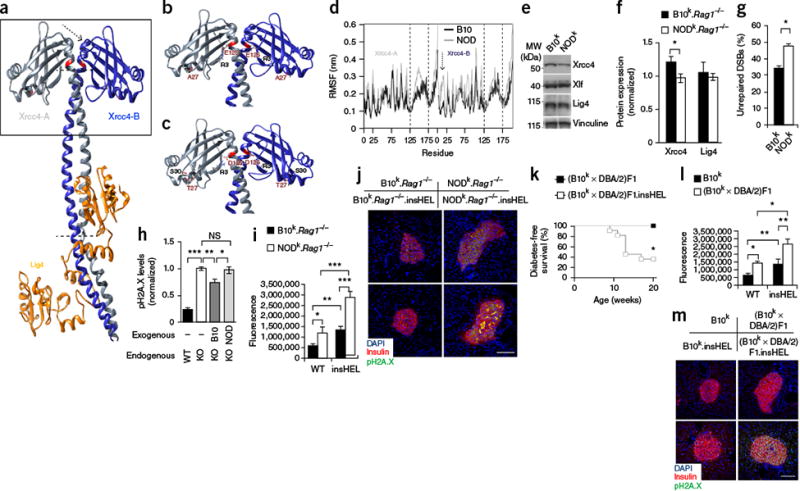
Xrcc4 mutation drives enhanced susceptibility to senescence.
(a) Three-dimensional structure of the Lig4 complex, determined
using the human structure as scaffolding. Modified residues are highlighted in
red, and the arrow and dotted lines indicate regions of major instability. The
box highlights the regions shown in detail in b and c.
(b,c) Molecular interactions calculated along the represented
trajectory for the B10 (b) and NOD (c) alleles of
Xrcc4. (d) Per-residue root-mean-square
fluctuation (RMSF) in Xrcc4 between 70–100 ns of simulation. Regions
with a different fluctuation profile are highlighted by the dashed lines and one
arrow, corresponding to the regions indicated in a. The results are
representative of four simulations. (e,f) Representative
immunoblotting of mouse embryonic fibroblasts (MEFs) for Xrcc4, Xlf and Lig4
(e), with quantification (n = 5
technical replicates/group) (f). (g) Proportion of
MEFs that remained positive for H2A.X (Ser139) phosphorylation (pH2A.X;
indicative of DSBs) after etoposide exposure (n = 6
technical replicates/group). (h) Wild-type CHO cells and
Xrcc4-deficient (KO) CHO cells reconstituted with the B10
or NOD Xrcc4 allele were exposed to etoposide, and unrepaired
DNA damage was quantified (n = 6–8 technical
replicates/group). (i,j) Immunofluorescence with a polyclonal
antibody to insulin, antibody to phosphorylated H2A.X and DAPI on pancreata from
the B10k.Rag1−/− and
NODk.Rag1−/−
backgrounds. Quantification is shown for islet raw fluorescence in the channel
for phosphorylated H2A.X (n = 19, 17, 20 and 20
sections) (i), with images of representative sections
(j). Scale bar, 100 μm. (k) Diabetes
incidence of (B10k × DBA/2)F1 and (B10k ×
DBA/2)F1.insHEL mice (n = 6 and 11 mice).
(l,m) Immunofluorescence with a polyclonal antibody to insulin,
antibody to phosphorylated H2A.X and DAPI on pancreata from the B10k
and (B10k × DBA/2)F1 backgrounds. Quantification is shown of
islet raw fluorescence in the channel for phosphorylated H2A.X
(n = 19, 17, 16 and 20 sections) (l), with images
of representative sections (m). Scale bar, 100 μm. Data are shown as
means ± s.e.m. *P < 0.05,
**P < 0.01,
***P < 0.0001; NS, not
significant.
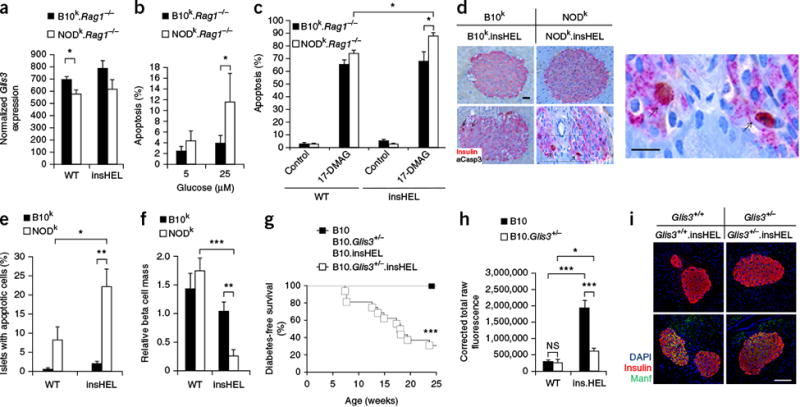
Reduced Glis3 expression results in enhanced susceptibility to
apoptosis. (a) Islet expression of Glis3, based on
RNA-seq analysis (n = 3 mice/group). (b)
The percentage of apoptotic cells in the islets of wild-type and insHEL
transgenic B10k.Rag1-/- and
NODk.Rag1-/- mice after culturing in
the presence of low (5 mM) and high (25 mM) concentrations of glucose
(n = 5–6 replicates/group).
(c) The percentage of apoptotic cells in the islets of
B10k.Rag1-/- and
NODk.Rag1-/- cells, with and without
insHEL, after culturing in the presence of the geldanamycin analog 17-DMAG and a
low (5 mM) glucose concentration (n = 6–18
replicates/group). (d–f) Representative sections
(d), average observation of apoptosis in islets
(e) and beta cell mass (f) after immunohistochemistry with a
polyclonal antibody to insulin and antibody to activated caspase-3 (aCasp3)
(n = 4–5 replicates/group). In d, the box
highlights the magnified region. Arrows indicate example apoptotic cells. Scale
bars, 100 μm. (g) Diabetes incidence in B10
(n = 6),
B10.Glis3+/- (n
= 11), B10.insHEL (n = 12) and
B10.Glis3+/-.insHEL (n
= 23) littermates. (h,i) Pancreas immunofluorescence with a
polyclonal antibody to insulin, antibody to Manf and DAPI. Fluorescence in the
channel for Manf was quantified in islets (n = 8, 8, 10
and 10 mice) (h), with representative staining shown
(i). Scale bar, 100 μm. Data are shown as means
± s.e.m. *P < 0.05,
**P < 0.01,
***P < 0.0001; NS, not
significant.
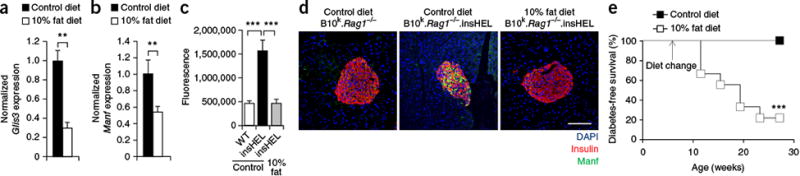
Dietary change recapitulates the effect of the NOD genetic background on a
resistant mouse strain.
B10k.Rag1−/−.insHEL
mice were maintained on a control diet or converted to a 10% fat diet at
6 weeks of age. (a,b) Islet expression (quantitative PCR) of
Glis3 (a) and Manf
(b), normalized to Rpl37a expression
(n = 6 mice/group). (c,d) Pancreas
immunofluorescence with a polyclonal antibody to insulin, antibody to Manf and
DAPI, with wild-type
B10k.Rag1−/− mice and
B10k.Rag1−/−.insHEL
mice on a control diet and
B10k.Rag1−/−.insHEL
mice on a 10% fat diet. Quantification is shown of islet raw
fluorescence in the channel for Manf (n = 8, 10 and 10)
(c), with images of representative sections (d).
Scale bar, 100 μm. (e) Diabetes incidence of
B10k.Rag1−/−.insHEL
mice fed with a control diet (n = 17) or a 10%
fat diet (n = 9). Data are shown as means ±
s.e.m. **P < 0.01,
***P < 0.0001.
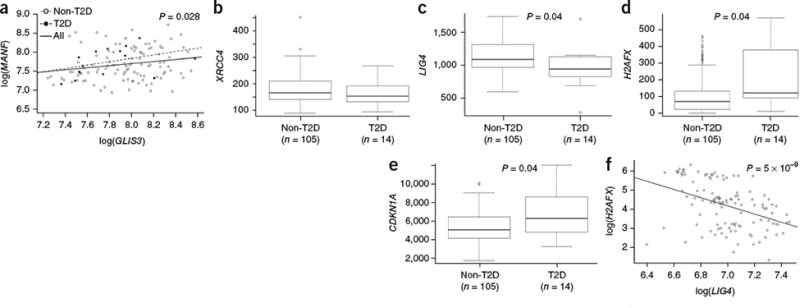
Molecular changes in the islets of patients with T2D mirror the processes altered
in NOD mice. mRNA expression in human pancreatic islets from healthy individuals
(n = 105) and those diagnosed with T2D
(n = 14) was assessed through RNA-seq analysis.
(a) Relationship between GLIS3 and
MANF expression in healthy ndividuals (Spearman correlation
P value = 0.043), individuals with T2D (Spearman
correlation P value = 0.075) and all individuals
(Spearman correlation P value = 0.028).
(b-e) Expression of XRCC4 (b)
LIG4 (c), H2AFX
(d) and CDKN1A (e) in healthy
islets as compared to i slets from patients withT2D (P values
shown after multiple-testing correction). The median and interquartile range
(IQR; box) are shown, with error bars indicating 1.5 times the IQR. Individual
values are shown if beyond 1.5 times the IQR. (f) Relationship
between H2AFX and LIG4 expression in human
islets (Spearman correlation P value = 5 ×
10-9).
Comment in
-
Intolerable secretion and diabetes in tolerant transgenic mice, revisited.Nat Genet. 2016 Apr 27;48(5):476-7. doi: 10.1038/ng.3560. Nat Genet. 2016. PMID: 27120442
Similar articles
-
GLIS3: A Critical Transcription Factor in Islet β-Cell Generation.Cells. 2021 Dec 9;10(12):3471. doi: 10.3390/cells10123471. Cells. 2021. PMID: 34943978 Free PMC article. Review.
-
GLIS3, a susceptibility gene for type 1 and type 2 diabetes, modulates pancreatic beta cell apoptosis via regulation of a splice variant of the BH3-only protein Bim.PLoS Genet. 2013 May;9(5):e1003532. doi: 10.1371/journal.pgen.1003532. Epub 2013 May 30. PLoS Genet. 2013. PMID: 23737756 Free PMC article.
-
Substance P preserves pancreatic β-cells in type 1 and type 2 diabetic mice.Biochem Biophys Res Commun. 2018 May 23;499(4):960-966. doi: 10.1016/j.bbrc.2018.04.028. Epub 2018 Apr 9. Biochem Biophys Res Commun. 2018. PMID: 29626466
-
The IGFBP3/TMEM219 pathway regulates beta cell homeostasis.Nat Commun. 2022 Feb 3;13(1):684. doi: 10.1038/s41467-022-28360-2. Nat Commun. 2022. PMID: 35115561 Free PMC article.
-
The importance of the Non Obese Diabetic (NOD) mouse model in autoimmune diabetes.J Autoimmun. 2016 Jan;66:76-88. doi: 10.1016/j.jaut.2015.08.019. Epub 2015 Sep 26. J Autoimmun. 2016. PMID: 26403950 Free PMC article. Review.
Cited by
-
Genetics of type-1 diabetes.Diabetol Int. 2024 Sep 2;15(4):688-698. doi: 10.1007/s13340-024-00754-1. eCollection 2024 Oct. Diabetol Int. 2024. PMID: 39469551 Review.
-
Identification of the Genetic Association Between Type-2-Diabetes and Pancreatic Cancer.Biochem Genet. 2023 Jun;61(3):1143-1162. doi: 10.1007/s10528-022-10308-2. Epub 2022 Dec 9. Biochem Genet. 2023. PMID: 36484959
-
Diabetes, Pancreatogenic Diabetes, and Pancreatic Cancer.Diabetes. 2017 May;66(5):1103-1110. doi: 10.2337/db16-1477. Diabetes. 2017. PMID: 28507210 Free PMC article.
-
Transcription factor GLIS3: Critical roles in thyroid hormone biosynthesis, hypothyroidism, pancreatic beta cells and diabetes.Pharmacol Ther. 2020 Nov;215:107632. doi: 10.1016/j.pharmthera.2020.107632. Epub 2020 Jul 18. Pharmacol Ther. 2020. PMID: 32693112 Free PMC article. Review.
-
Sphingolipids in Type 1 Diabetes: Focus on Beta-Cells.Cells. 2020 Aug 4;9(8):1835. doi: 10.3390/cells9081835. Cells. 2020. PMID: 32759843 Free PMC article. Review.
References
-
- Wicker LS, et al. Type 1 diabetes genes and pathways shared by humans and NOD mice. J Autoimmun. 2005;25(suppl.):29–33. - PubMed
-
- Islam MS, Wilson RD. Experimentally induced rodent models of type 2 diabetes. Methods Mol Biol. 2012;933:161–174. - PubMed
-
- Butler AE, et al. Beta-cell deficit and increased beta-cell apoptosis in humans with type 2 diabetes. Diabetes. 2003;52:102–110. - PubMed
-
- DIAbetes Genetics Replication And Meta-analysis (DIAGRAM) Consortium, Asian Genetic Epidemiology Network Type 2 Diabetes (AGEN-T2D) Consortium, South Asian Type 2 Diabetes (SAT2D) Consortium, Mexican American Type 2 Diabetes (MAT2D) Consortium & Type 2 Diabetes Genetic Exploration by Nex-generation sequencing in muylti-Ethnic Samples (T2D-GENES) Consortium. Genome-wide transancestry meta-analysis provides insight into the genetic architecture of type 2 diabetes susceptibility. Nat Genet. 2014;46:234–244. - PMC - PubMed
Publication types
MeSH terms
Substances
Grants and funding
LinkOut - more resources
Full Text Sources
Other Literature Sources
Medical
Molecular Biology Databases
