. 2016 Mar 22:6:23129.
doi: 10.1038/srep23129.

Human gut colonisation may be initiated in utero by distinct microbial communities in the placenta and amniotic fluid

Affiliations

Human gut colonisation may be initiated in utero by distinct microbial communities in the placenta and amniotic fluid

Maria Carmen Collado et al. Sci Rep. .

Abstract

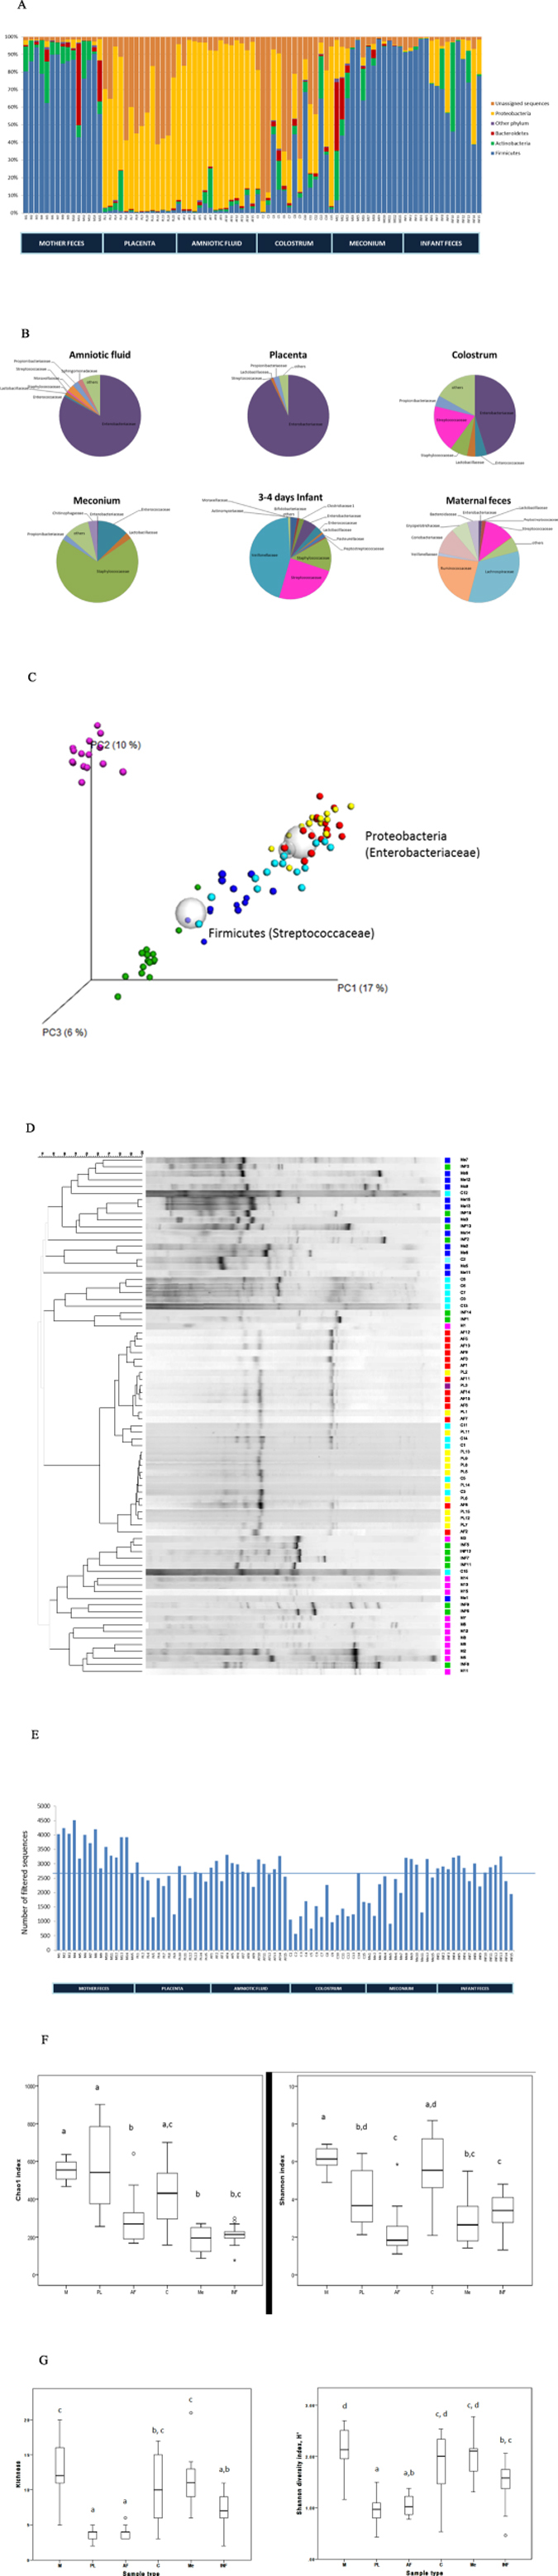
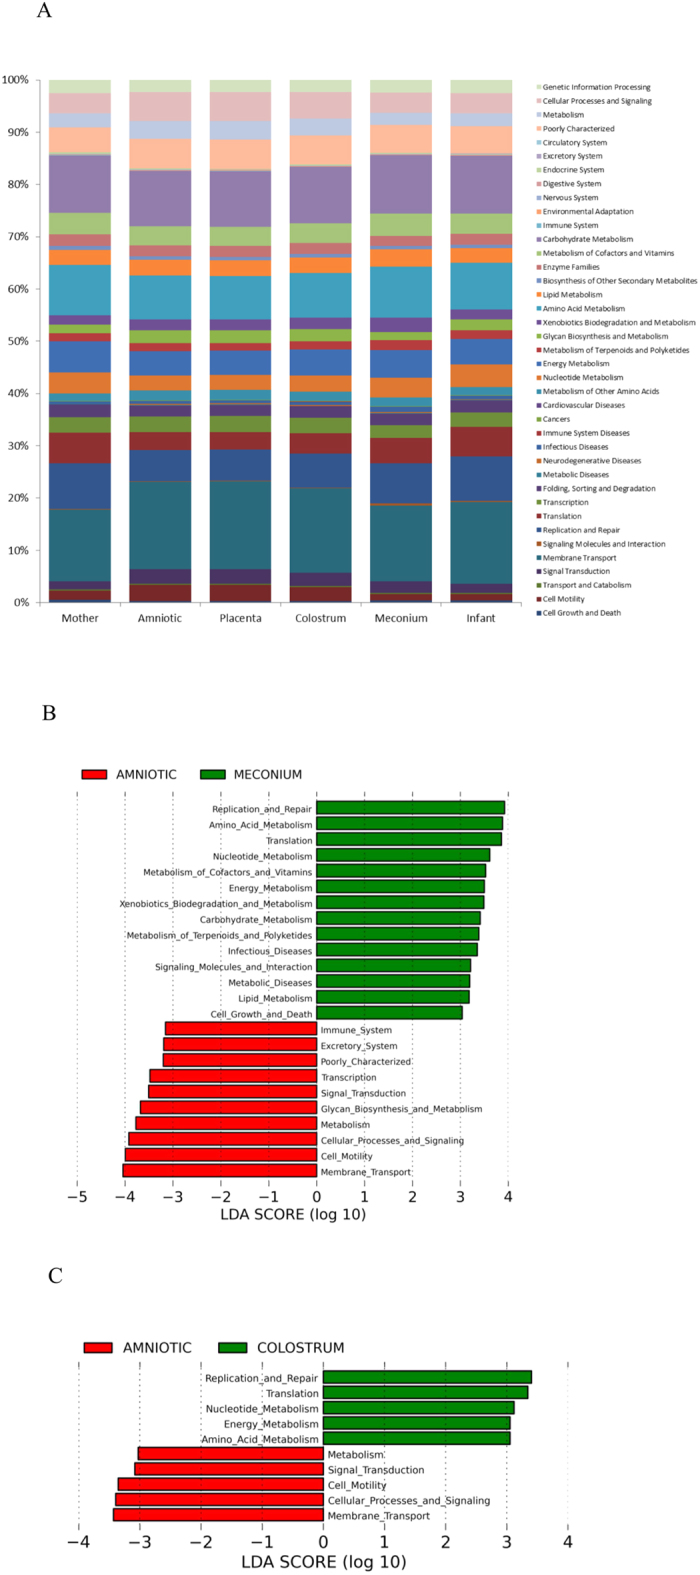
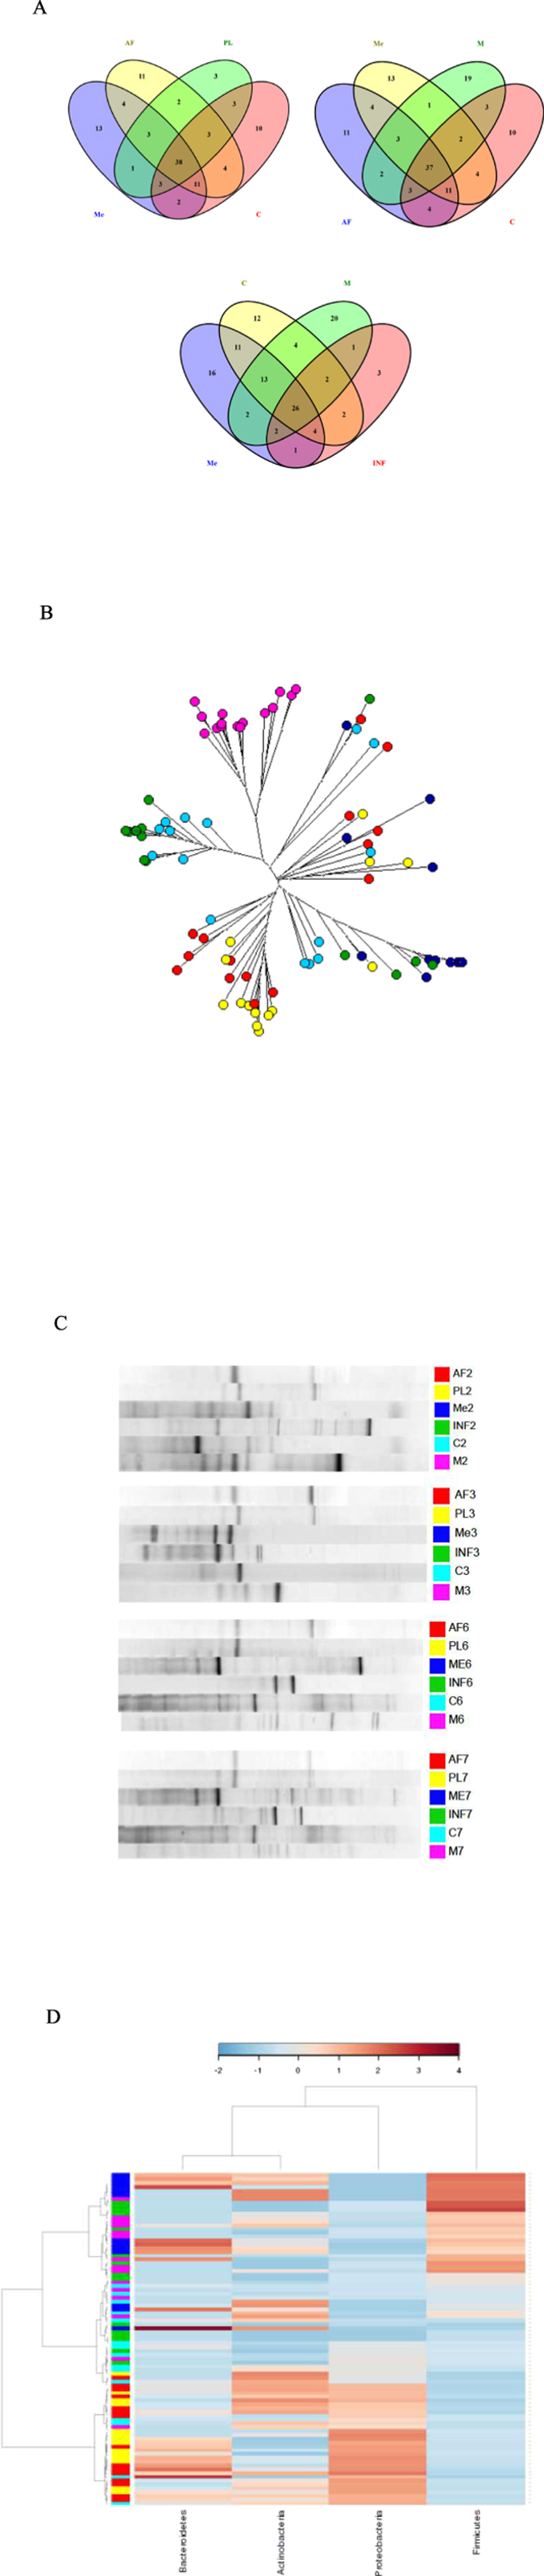
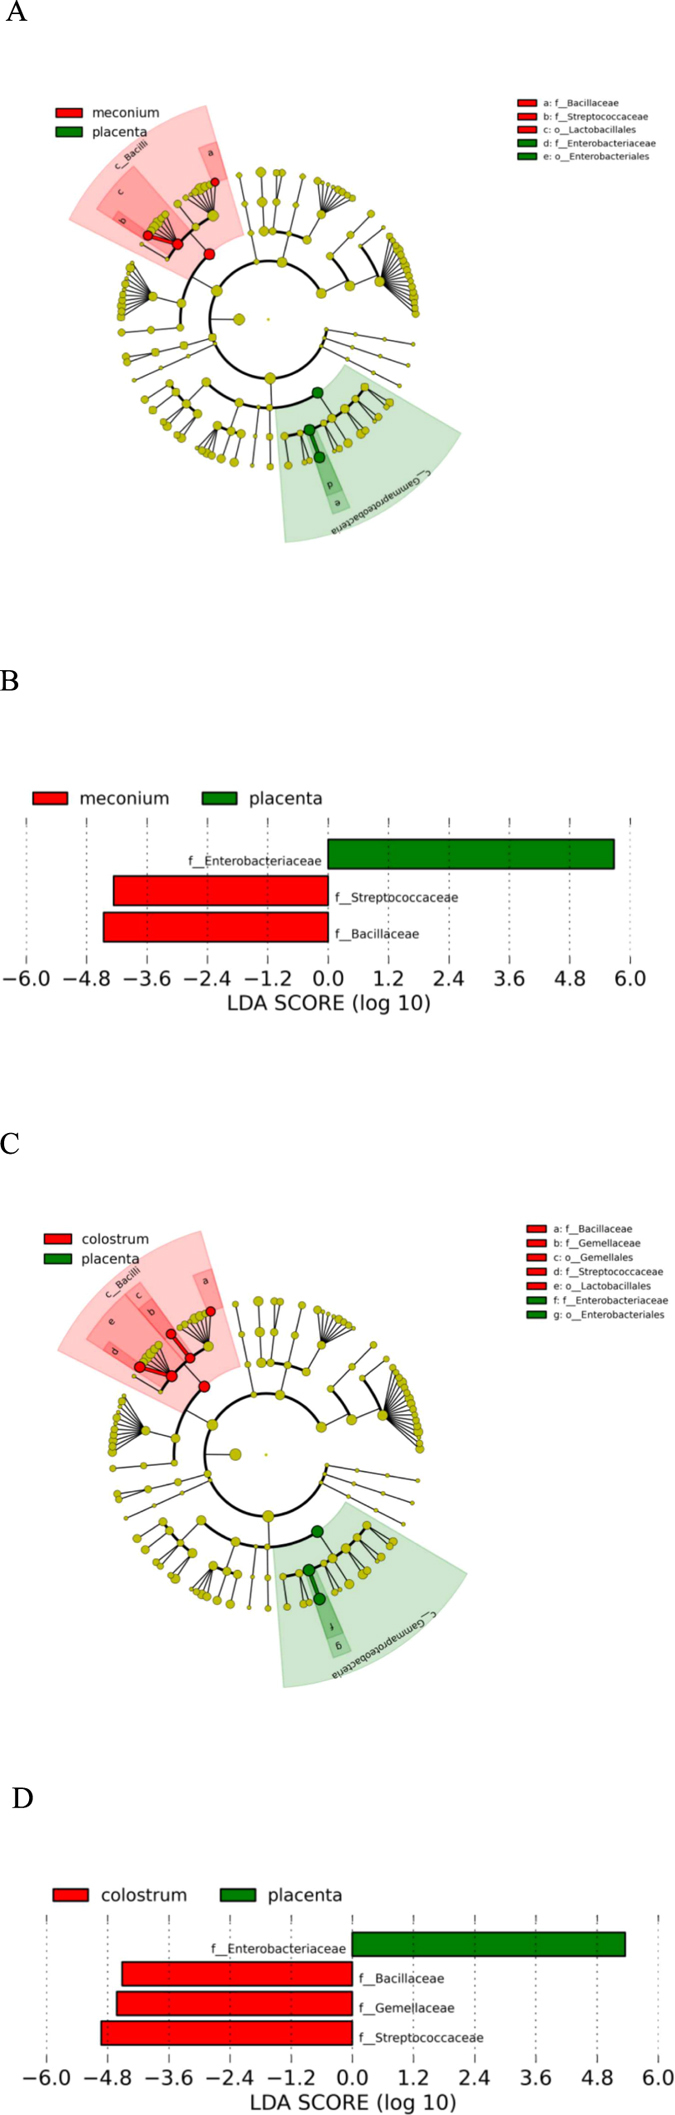
Interaction with intestinal microbes in infancy has a profound impact on health and disease in later life through programming of immune and metabolic pathways. We collected maternal faeces, placenta, amniotic fluid, colostrum, meconium and infant faeces samples from 15 mother-infant pairs in an effort to rigorously investigate prenatal and neonatal microbial transfer and gut colonisation. To ensure sterile sampling, only deliveries at full term by elective caesarean section were studied. Microbiota composition and activity assessment by conventional bacterial culture, 16S rRNA gene pyrosequencing, quantitative PCR, and denaturing gradient gel electrophoresis revealed that the placenta and amniotic fluid harbour a distinct microbiota characterised by low richness, low diversity and the predominance of Proteobacteria. Shared features between the microbiota detected in the placenta and amniotic fluid and in infant meconium suggest microbial transfer at the foeto-maternal interface. At the age of 3-4 days, the infant gut microbiota composition begins to resemble that detected in colostrum. Based on these data, we propose that the stepwise microbial gut colonisation process may be initiated already prenatally by a distinct microbiota in the placenta and amniotic fluid. The link between the mother and the offspring is continued after birth by microbes present in breast milk.


Figures

Figure 1
Figure 1. Microbial community analysis of maternal faeces (M), placenta (PL), amniotic fluid (AF), colostrum (C), meconium (Me) and infant faeces (INF) samples.
(A) Relative abundances of operational taxonomic units (OTUs) at phylum level. Relative abundances of OTUs accounting for >1% of the total bacterial community are shown for each sample. OTUs representing ≤1% are grouped as “other phylum”. (B) Diversity of the most abundant bacterial taxa identified at family level. Taxonomic assignment of 16S rRNA sequences was carried out by use of a naïve Bayesian classifier, the Ribosomal Database Project (RDP) Classifier with a cut-off 50% of homology. (C) Principal Coordinate Analysis (PCoA) plot based on the unweighted UniFrac distance matrix. Individual samples of maternal faeces (pink), placenta (yellow), amniotic fluid (red), colostrum (light blue), meconium (dark blue), and infant faeces (green) are shown as single points. Significant differences were reported between groups of samples (ANOSIM = 0.6805 & P = 0.001 with 999 permutations). (D) UPGMA Cluster analysis using Pearson similarity coefficient performed on PCR-DGGE analysis fingerprints from all samples. Maternal faeces (pink), placenta (yellow), amniotic fluid (red), colostrum (light blue), meconium (dark blue) and infant faeces (green) samples are shown as single pattern profiles. (E) Number of trimmed and filtered sequences obtained by 16S rRNA gene pyrosequencing. The numbers refer to individual mother-infant pairs. The horizontal line reflects the average number of sequences for all samples. (F) Alpha-diversity Box-whisker plots of taxa richness (Chao1 index) and diversity (Shannon-Wiener index) in samples analysed by 16S rRNA gene pyrosequencing. The letters above the bars indicate results of Tukey HSD test following a significant 1-way ANOVA. Mean values not sharing the same letters are significantly different from each other (p < 0.05). (G) Box-whisker plots Richness (Chao index) and diversity (Shannon index) of the microbiome in different sample types based on the PCR-DGGE fingerprints. The letters above the bars indicate results of Tukey HSD test following a significant 1-way ANOVA. Mean values not sharing the same letters are significantly different from each other (p < 0.05).
Figure 2
Figure 2. Microbial metagenomic activity in maternal faeces, placenta, amniotic fluid, colostrum, meconium and infant faeces samples.
(A) Relative abundances of KEGG pathways at level 2 encoded in the microbiome present in maternal faeces (M), placenta (PL), amniotic fluid (AF), colostrum (C), meconium (Me) and infant faeces (INF) samples. (B) LDA scores for differentially abundant PICRUSt predicted microbial genes (specified as KEGG Orthology groups), pathways, and classified functional categories (Log LDA > 3.00) in amniotic fluid and meconium samples. (C) LDA scores for differentially abundant PICRUSt predicted microbial genes (specified as KEGG Orthology groups), pathways, and classified functional categories (Log LDA > 3.00) in amniotic fluid and colostrum samples.
Figure 3
Figure 3. Shared microbial features between maternal faeces (M), placenta (PL), amniotic fluid (AF), colostrum (C), meconium (Me) and infant faeces (INF) samples.
(A) Venn diagram of exclusive and shared family-level phylotypes (non-singleton OTUs, sequences at greater than or equal to 97% sequence identity and present >1%). (B) A neighbour joining phylogenetic tree representing the sequences obtained from maternal faeces samples, placenta, amniotic fluid, colostrum, meconium and infant faeces samples. Maternal faeces (pink), placenta (yellow), amniotic fluid (red), colostrum (light blue), meconium (dark blue) and infant faeces (green) samples are shown as single points. (C) Representative fingerprints of different samples types from four mother-infant pairs obtained by DGGE-PCR targeting the 16S rRNA gene. (D) Heatmap plot of Hierarchical Ward-linkage clustering based on the similarity measure (Euclidean distance) of phylum proportion. Unassigned & unmapped reads were excluded and also, variables with over percent zeroes were removed. Sequences were normalized by log transformation. Individual maternal faeces (pink), placenta (yellow), amniotic fluid (red), colostrum (light blue), meconium (dark blue) and infant faeces (green) samples are shown as single points.
Figure 4
Figure 4. Differences in abundance of bacterial communities at family level as assessed by LEfSe.
(A) Bacterial taxa that were differentially abundant in placenta and meconium samples visualised using a cladogram generated from LEfSe analysis. (B) Differences in key OTUs identified as differentiating between placenta and meconium samples. (C) Bacterial taxa that were differentially abundant in placenta and colostrum samples visualized using a cladogram generated from LEfSe analysis. (D) Differences in key OTUs identified as differentiating between placenta and colostrum samples.

References

    1. Rautava S., Luoto R., Salminen S. & Isolauri E. Microbial contact during pregnancy, intestinal colonization and human disease. Nat. Rev. Gastroenterol. Hepatol. 9, 565–576 (2012). - PubMed
    1. Sevelsted A., Stokholm J., Bønnelykke K. & Bisgaard H. Cesarean section and chronic immune disorders. Pediatrics 135, 92–98 (2015). - PubMed
    1. Goksör E. et al. Early fish introduction and neonatal antibiotics affect the risk of asthma into school age. Pediatr. Allergy Immunol 24, 339–344 (2013). - PMC - PubMed
    1. Russell S. L. et al. Perinatal antibiotic treatment affects murine microbiota, immune responses and allergic asthma. Gut Microbes 4, 158–164 (2013). - PMC - PubMed
    1. Gevers D. et al. The treatment-naive microbiome in new-onset Crohn’s disease. Cell Host Microbe 15, 382–392 (2014). - PMC - PubMed

Publication types

LinkOut - more resources