. 2016 Apr 20;44(7):3233-52.
doi: 10.1093/nar/gkw162. Epub 2016 Mar 21.

Functional annotation of the vlinc class of non-coding RNAs using systems biology approach

Affiliations

Functional annotation of the vlinc class of non-coding RNAs using systems biology approach

Georges St Laurent et al. Nucleic Acids Res. .

Abstract

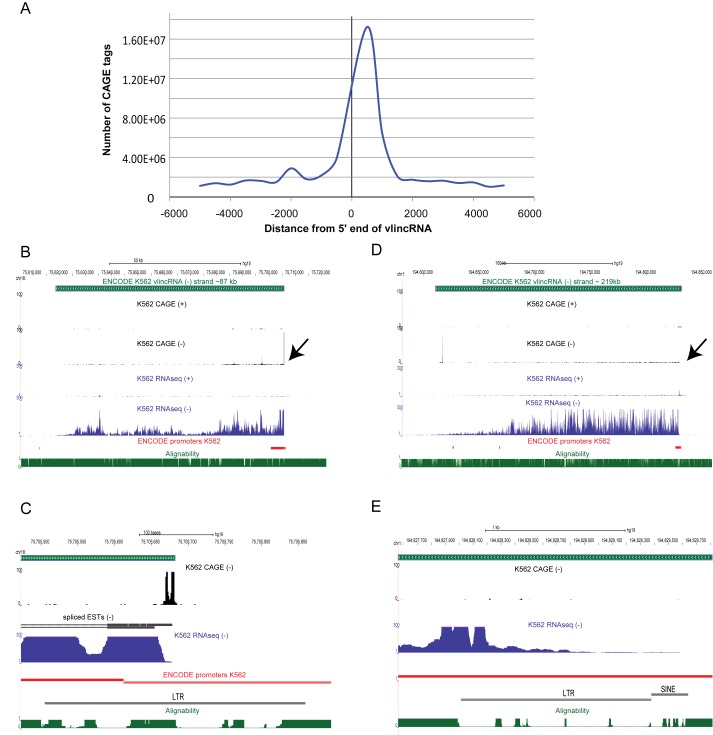
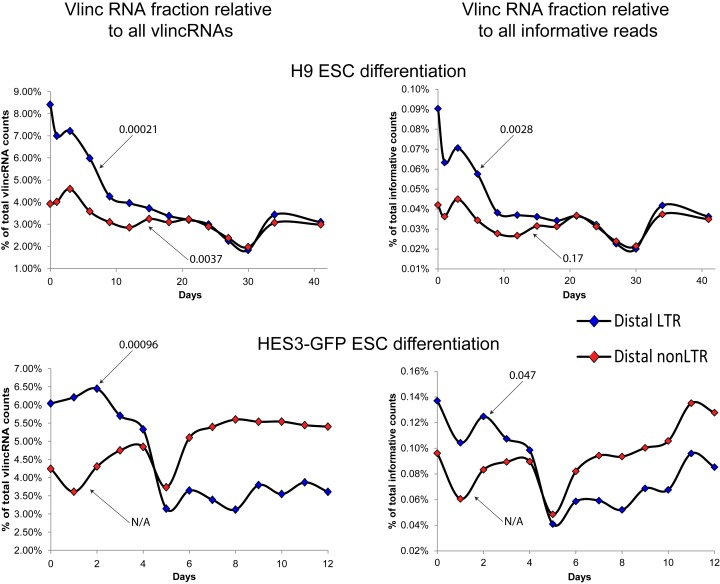
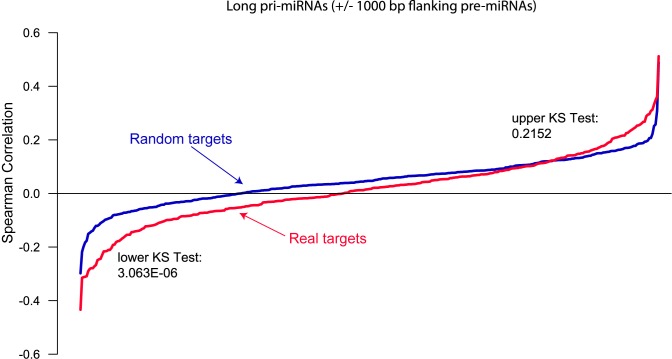
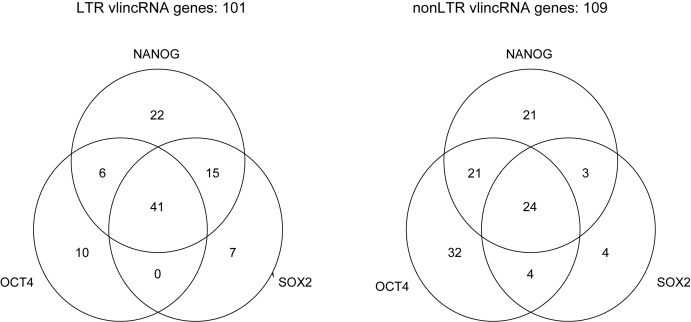
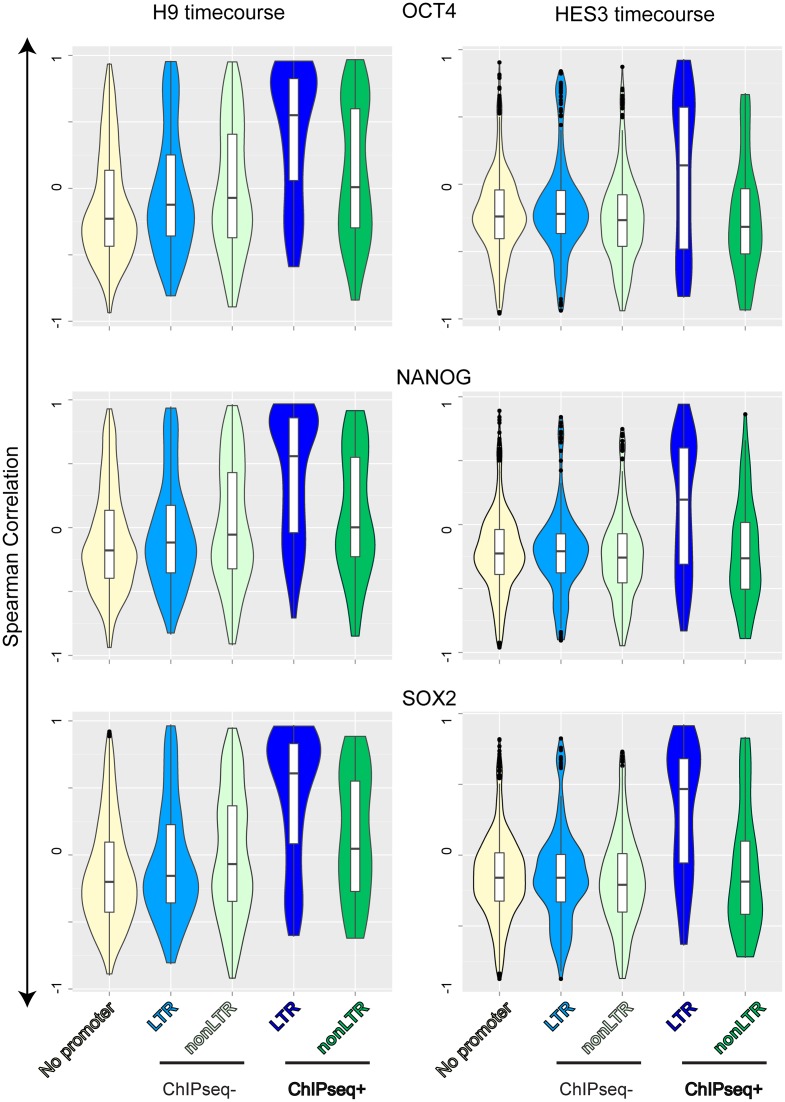
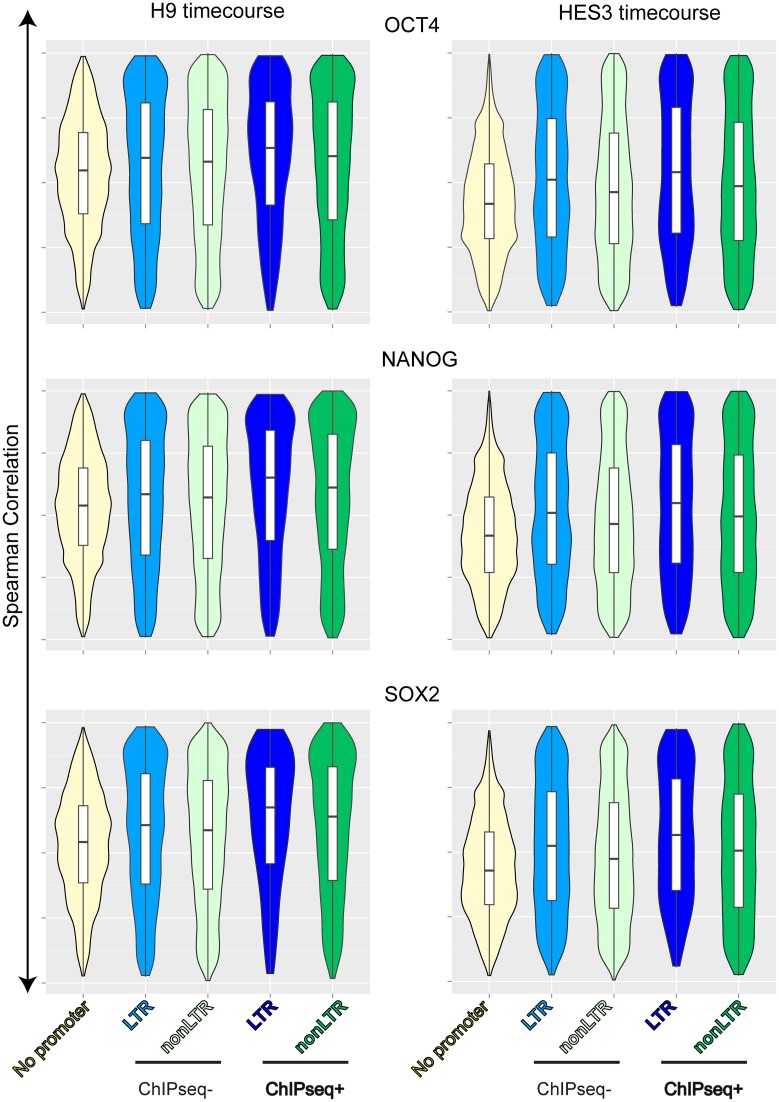
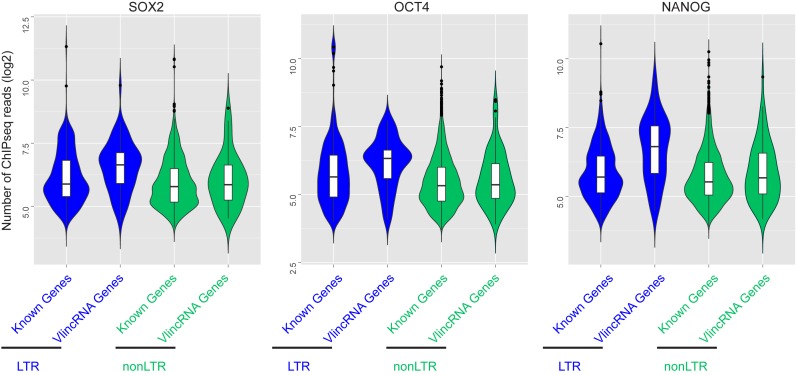
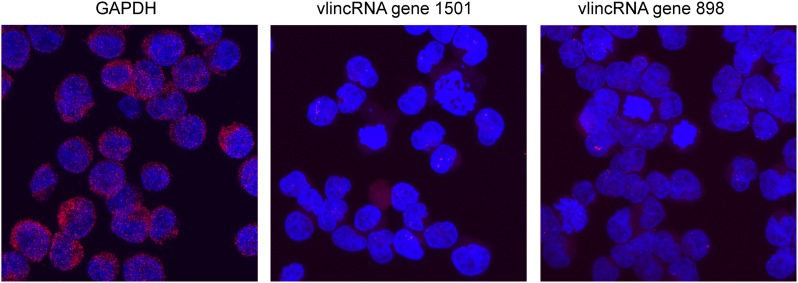
Functionality of the non-coding transcripts encoded by the human genome is the coveted goal of the modern genomics research. While commonly relied on the classical methods of forward genetics, integration of different genomics datasets in a global Systems Biology fashion presents a more productive avenue of achieving this very complex aim. Here we report application of a Systems Biology-based approach to dissect functionality of a newly identified vast class of very long intergenic non-coding (vlinc) RNAs. Using highly quantitative FANTOM5 CAGE dataset, we show that these RNAs could be grouped into 1542 novel human genes based on analysis of insulators that we show here indeed function as genomic barrier elements. We show that vlinc RNAs genes likely function in cisto activate nearby genes. This effect while most pronounced in closely spaced vlinc RNA-gene pairs can be detected over relatively large genomic distances. Furthermore, we identified 101 vlinc RNA genes likely involved in early embryogenesis based on patterns of their expression and regulation. We also found another 109 such genes potentially involved in cellular functions also happening at early stages of development such as proliferation, migration and apoptosis. Overall, we show that Systems Biology-based methods have great promise for functional annotation of non-coding RNAs.


Figures

Figure 1.
Figure 1.
Detection of vlincRNAs using CAGE. (A) Cumulative plot of CAGE tags from all 833 samples around the annotated borders of 3955 individual vlincRNAs, where 3955 is a sum of 2762 strand specific vlincRNAs and 1193 vlincRNAs with calculated strand. Coordinates of vlincRNAs are from (3). The position ‘0’ (X-axis) indicates 5′ end of a vlicnRNAs, while the negative values represent base pairs in the 5′ flanking regions. For each base pair, CAGE tags were summed up across all vlincRNAs and all samples (Y-axis). Three outlier vlincs (chr12:49525312–49578581: minus, chr2:43290436–43449539: minus, chr14:77402830–77490884: minus) with extremely high CAGE expression were not used. The CAGE method can successfully detect the 5' end of vlincRNA ID-1102 (B,C) but not vlincRNA ID-1209 (D,E). Both vlincRNAs were initially found in K562 cell line ((3), Supplementary Table S1). ENCODE nuclear polyA- RNAseq track and CAGE data both from K562 cell line are shown. ENCODE alignability track for 36 mers is also shown. The ENCODE/Broad promoters represent combined promoters from ‘Active’, ‘Weak’ and ‘Poised’ categories (16).
Figure 2.
Figure 2.
Distribution of fractions of distal LTR and nonLTR vlincRNAs during time course of embryonic stem cell differentiation. The fractions of distal (>50 kb) LTR (blue diamonds) and nonLTR (red diamonds) vlincRNAs at every time point were calculated as the ratio of number of reads relative to all informative reads (right) or all 3955 vlincRNA reads (left). Number of reads for vlincs were calculated without exon and rRNA in vlincs. The fractions (Y-axes) were plotted as functions of time of differentiation (X-axes) of two human ESC lines H1 (top) and HES-GFP (bottom). The numbers indicate P-values for the decreasing trend using Fisher F-test. N/A—the actual trend was to increase.
Figure 3.
Figure 3.
Distribution of Spearman correlations between experimentally validated and random targets of miRNAs. For each miRNA in miRTarBase, median Spearman correlations between its experimentally validated (red) and random (blue) targets were plotted for the primary forms of miRNAs. The P-values from the KS test that the distribution of the correlations for the real targets is either lower or higher than that for random targets are shown.
Figure 4.
Figure 4.
Fraction of each category of vlincRNA genes with binding sites for the pluripotency-associated TFs in the promoters. The number of LTR and nonLTR vlincRNA genes out of 1542 with the corresponding combination of TF binding sites at their promoters is shown.
Figure 5.
Figure 5.
Distributions of Spearman correlations between levels of vlincRNAs and pluripotency-associated TFs. Spearman correlations were calculated between levels of each vlincRNA and each one of the three pluripotency TFs (SOX2, NANOG and OCT4) in the H1 (left) and HES-GFP (right) ESC differentiation timecoures. Violin plot distributions of these correlations are shown for different groups of vlincRNAs based on the presence of LTR (LTR and nonLTR) or ChIPseq signal (‘ChIPseq+’ or ‘ChIPseq-’) in their promoters. VlincRNAs without promoters are also included as controls.
Figure 6.
Figure 6.
Distributions of Spearman correlations between levels of Known Genes and pluripotency-associated TFs. Spearman correlations were calculated between levels of each UCSC transcript and each one of the three pluripotency TFs (SOX2, NANOG and OCT4) in the H1 (left) and HES-GFP (right) ESC differentiation timecoures. Violin plot distributions of these correlations are shown for different groups of transcripts based on the presence of LTR (LTR and nonLTR) or ChIPseq signal (‘ChIPseq+’ or ‘ChIPseq-’) in their promoters. UCSC transcripts without promoters are also included as controls.
Figure 7.
Figure 7.
Distributions of ChIPseq signal in LTR and nonLTR promoters of vlincRNAs and Known Genes. Violin plots of the number of ChIPseq reads (log2 scale, Y-axes) for each of three pluripotency TFs in the different categories (LTR and nonLTR) of vlincRNA and UCSC Gene promoters are shown. For the latter, promoters with unique coordinates were used in cases when one promoter could be assigned to different transcripts. Only promoters that had at least one ChipSeq read were used for this analysis.
Figure 8.
Figure 8.
In-situ localization of vlincRNAs using RNA-FISH. K562 human erythroleukemia cells were fixed and analysed by RNA-FISH for with probes against GAPDH and two LTR vlincRNAs vlinc_377 and vlinc_500 originally identified in (4) corresponding to vlincRNA genes with IDs 1501 and 898 correspondingly in Supplementary Table S6. RNA probes were labelled with ATTO red (red), hybridized and washed extensively prior to counterstaining of DNA with DAPI (blue). Confocal microscopy was used to obtain z-stacks of images that were then digitally flattened, and then the red and blue channels were merged to produce the composite image.

References

    1. Morris K.V., Mattick J.S. The rise of regulatory RNA. Nat. Rev. Genet. 2014;15:423–437. - PMC - PubMed
    1. Herbert A., Rich A. RNA processing in evolution. The logic of soft-wired genomes. Ann. N Y Acad. Sci. 1999;870:119–132. - PubMed
    1. St Laurent G., Shtokalo D., Dong B., Tackett M., Fan X., Lazorthes S., Nicolas E., Sang N., Triche T., McCaffrey T., et al. VlincRNAs controlled by retroviral elements are a hallmark of pluripotency and cancer. Genome Biol. 2013;14:R73. - PMC - PubMed
    1. Kapranov P., St Laurent G., Raz T., Ozsolak F., Reynolds C.P., Sorensen P.H., Reaman G., Milos P., Arceci R.J., Thompson J.F., et al. The majority of total nuclear-encoded non-ribosomal RNA in a human cell is ‘dark matter’ un-annotated RNA. BMC Biol. 2010;8:149. - PMC - PubMed
    1. St Laurent G., Wahlestedt C., Kapranov P. The Landscape of long noncoding RNA classification. Trends Genet. 2015;31:239–251. - PMC - PubMed

Publication types

LinkOut - more resources