. 2016 Apr 4;213(4):585-603.
doi: 10.1084/jem.20151764. Epub 2016 Mar 21.

The macrophage IRF8/IRF1 regulome is required for protection against infections and is associated with chronic inflammation

Affiliations

The macrophage IRF8/IRF1 regulome is required for protection against infections and is associated with chronic inflammation

David Langlais et al. J Exp Med. .

Abstract

IRF8 and IRF1 are transcriptional regulators that play critical roles in the development and function of myeloid cells, including activation of macrophages by proinflammatory signals such as interferon-γ (IFN-γ). Loss of IRF8 or IRF1 function causes severe susceptibility to infections in mice and in humans. We used chromatin immunoprecipitation sequencing and RNA sequencing in wild type and inIRF8andIRF1mutant primary macrophages to systematically catalog all of the genes bound by (cistromes) and transcriptionally activated by (regulomes) IRF8, IRF1, PU.1, and STAT1, including modulation of epigenetic histone marks. Of the seven binding combinations identified, two (cluster 1 [IRF8/IRF1/STAT1/PU.1] and cluster 5 [IRF1/STAT1/PU.1]) were found to have a major role in controlling macrophage transcriptional programs both at the basal level and after IFN-γ activation. They direct the expression of a set of genes, the IRF8/IRF1 regulome, that play critical roles in host inflammatory and antimicrobial defenses in mouse models of neuroinflammation and of pulmonary tuberculosis, respectively. In addition, this IRF8/IRF1 regulome is enriched for genes mutated in human primary immunodeficiencies and with loci associated with several inflammatory diseases in humans.


Figures

Figure 1.
Figure 1.
Differential effect of IFN-γ on recruitment of IRF8 and IRF1 to chromatin. (A) Peak heights (number per 107 reads) for IRF8, IRF1, STAT1, and PU.1 binding sites determined by ChIP seq before and after IFN-γ stimulation of BMDMs. (B) Distribution of the individual TF binding sites (after IFN-γ) relative to the closest annotated gene. (C) De novo motif analysis was performed for the IRF8, IRF1, STAT1, and PU.1 binding peaks and after treatment with IFN-γ. Shown are the top motifs identified for each TF, reference to their published names, and the fraction of peaks containing these motifs within a 100-bp region of the binding peak. (D) Volcano plot showing pairwise analysis of differential gene expression (RNA seq data) in BMDMs after 3 h of IFN-γ treatment (fold change ≥|2|; adjusted p-value ≤10−5). RNA seq data were validated by RT-qPCR for a subset of 25 transcripts on independent biological samples (Fig. S1 A). (E) Mean number of peaks per gene (per 10-kb intervals) plotted for all expressed genes and for up- or down-regulated genes after IFN-γ treatment, and for control random (Rdm) gene sets. TSS, transcription start site.
Figure 2.
Figure 2.
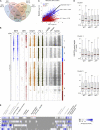
Different IRF8/IRF1 binding combinations in macrophages and association with epigenetic profiles. (A) Venn diagram depicting overlaps between IRF8, IRF1, STAT1, and PU.1 binding sites genome wide (sites located <100 bp from each other). (B) Clustering analysis of the 21,248 unique IRF1- and/or IRF8-containing regulatory regions (including STAT1 and PU.1) before or after IFN-γ treatment. Each horizontal line presents the read density in a ±1-kb region around a unique position; DNA accessibility (FAIRE; Ostuni et al., 2013) and H3K4me1 and H3K27Ac epigenetic datasets are shown for a ±2-kb region surrounding the cluster peaks. Different binding combinations before or after IFN-γ treatment are shown (clusters numbered 1–7). TF enrichment at various cluster peaks was validated by qPCR (Fig. S1 C). (C) Global changes in H3K27Ac levels at IRF8- or IRF1-bound sites in response to IFN-γ in Irf1−/− and in Irf8m/m mutant macrophages (log2 fold changes of H3K27Ac peak heights). Linear regressions are shown for Irf8m/m and Irf1−/− cells and are compared with an expected regression (black) if Irf mutations had no effect. (D) Box plots of H3K27Ac ChIP seq read density for TF binding clusters 1 and 3 and for the subset IFN-γ–activated sites of cluster 5 (5′); the dotted red lines identify median K27Ac levels in untreated WT BMDMs; p-values (Wilcoxon rank sum test; **, P ≤ 0.01; ***, P < 0.001) were calculated for each group compared with untreated WT controls. (E) GO category enrichment analysis for genes in the different TF binding clusters; the gray/white/blue color gradient indicates the significance of category enrichment (−10*log10 of the FDR q-value using a minimal threshold of 0.01; NE, nonenriched).
Figure 3.
Figure 3.
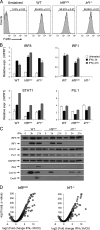
Characteristics of Irf8m/m and Irf1−/− mutant BMDMs. (A) The differentiation of BM cells from WT B6 and Irf8 and Irf1 mutants into macrophages (BMDMs) was assessed by flow cytometry. The fraction of F4/80 positive cells (±SD) for each genotype (representative of at least of five independent experiments). (B) Basal and IFN-γ–stimulated RNA expression levels of the four studied TFs in BMDMs from each genotype; data are presented relative to Hprt mRNA (±SD of biological replicates) used as an internal control (representative of three independent experiments). (C) Western blot analysis of IRF8, IRF1, STAT1, PU.1, inducible nitric oxide synthase, Cxcl10, and Cxcl9 protein expression in WT and Irf8m/m and Irf1−/− mutants before and after treatment with IFN-γ. (D) Volcano plot of differential gene expression (RNA seq data) of Irf8m/m and Irf1−/− BMDMs in response to 3 h of IFN-γ treatment; responsive genes were identified using a fold change ≥|2| and an adjusted p-value ≤10−5.
Figure 4.
Figure 4.
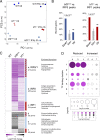
IRF8 and IRF1 are required for macrophage basal transcriptional programs. (A) Principal component analysis of RNA seq data from WT, IRF8-deficient (Irf8m/m), and IRF1-deficient (Irf1−/−) BMDMs before and after 3 h of stimulation with IFN-γ. (B) Fraction of genes showing decreased (down) or increased (up) expression in Irf8m/m and Irf1−/− BMDMs and that harbor IRF8 or IRF1 binding sites within 20 kb of their transcription start site (p-values are Fisher’s exact test relative to random [Rdm] expectations). ns, not significant. (C) Expression level changes for genes significantly dysregulated at the basal level in mutant Irf8m/m and Irf1−/− BMDMs (fold change ≥|2|; adjusted p-value ≤10−5). Genes were grouped (a–f) for the effect of IRF8 and IRF1 loss of function (enriched GO categories are shown). (D) Bubble histogram showing the association of TF binding clusters with genes showing reduced (a–c) or increased (d–f) expression. The bubble size reflects the strength of the –log10 Fisher’s exact test p-value for the association of dysregulated genes (compared with random gene sets). The color gradient reflects the ratio in the number of peaks associated with dysregulated genes versus control sets of randomly selected genes.
Figure 5.
Figure 5.
IRF1 and IRF8 are required for transcriptional activation by IFN-γ in macrophages. (A) Heatmap identifying three groups of genes (labeled I–III) in which activation by IFN-γ is altered by more than or equal to twofold in BMDMs mutated for Irf8 (II), Irf1 (III), or both (I). (B) Bubble histogram showing the association of TF binding clusters with groups of genes dysregulated in Irf8m/m and Irf1−/− mutant BMDMs in response to IFN-γ (groups I–III), other IFN-γ activated (Act), or repressed (Rep) genes; see Fig. 4 D. (C) Proportions of dysregulated genes in Irf8m/m and Irf1−/− mutant macrophages at steady state and in response to IFN-γ (p-values calculated using the Fisher’s exact test for TF-specific dysregulated genes vs. total number of dysregulated genes). (D) Schematic models for IRF8- and IRF1-dependent regulation of basal and IFN-γ–induced transcriptional programs (see Results for details).
Figure 6.
Figure 6.
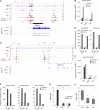
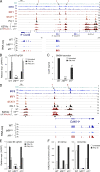
Tlr9 and Nos2 are transcriptionally coregulated by IRF8 and IRF1 in macrophages. (A) Genomic snapshot of the Tlr9 locus (group I gene). Density of ChIP seq reads (for IRF8, IRF1, STAT1, PU.1, and H3K27Ac) and RNA seq reads in BMDMs (WT, and Irf1−/− and Irf8m/m mutants) are shown, with arrows pointing to cluster 1, 3, and 5 binding schemes. (B) RT-qPCR validation of Tlr9 gene expression in response to IFN-γ in WT and mutant BMDMs (mean ± SD of independent biological replicates; Student’s t test relative to WT). HPRT, hypoxanthine-guanine phosophoribosyltransferase. (C) Genomic snapshot (as in A) of the Nos2 locus (group I gene). (D) ChIP-qPCR validation of H3K27Ac levels (relative to histone H3) at Tlr9 cluster 3 and 1 peaks (results are representative of three independent experiments). (E) RT-qPCR validation of Nos2 expression (as in B). (F) H3K27Ac levels (ChIP-qPCR relative to histone H3) at three cluster 5 peaks at the Nos2 locus (designated A, B, and C) showing increased K27Ac deposition in WT BMDMs after IFN-γ stimulation, which is diminished in Irf8m/m and abolished in Irf1−/− BMDMs (results are representative of three independent experiments). (G) Nitric oxide production by WT, Irf8m/m, and Irf1−/− mutant BMDMs in vitro in response to IFN-γ (mean of biological replicates ± SD; p-values were calculated using Student’s t test). (H) Nitric oxide (NO) production by splenocytes from Irf8m/m and Irf1−/− Plasmodium berghei ANKA-infected mice (compared with WT) treated with 400 U/ml IFN-γ for 48 h and 1.5 µg/ml TLR9 ligand CpG oligonucleotides. Box plots show the mean nitric oxide production from four to five mice per strain (whiskers extending to 5–95 percentiles; p-values were calculated using Student’s t test). *, P ≤ 0.05; **, P ≤ 0.01; ***, P ≤ 0.001.
Figure 7.
Figure 7.
T cell costimulatory and chemoattractive genes are regulated in an IRF8-dependent fashion in macrophages. Results are shown as in the legend to Fig. 6. (A) ChIP seq and RNA seq profiles at the Cxcl9-10 locus show IRF8-dependent regulation (group II gene). (B) RT-qPCR validation of Cxcl9 expression in WT and Irf mutant BMDMs (mean ± SD; p-values were calculated using Student’s t test). HPRT, hypoxanthine-guanine phosophoribosyltransferase. (C) Quantification of CXCL9 secretion by macrophages 44 h after IFN-γ treatment. (D) ChIP seq and RNA seq read density profiles at the Cd40 locus showing IRF8-dependent regulation (group II gene). (E) qPCR validation of Cd40 expression. (F) Irf8m/m BMDMs show altered H3K27Ac deposition at both IRF8-bound cluster 1 and 3 peaks (identified by the arrows in D; results are representative of three independent experiments). *, P ≤ 0.05; **, P ≤ 0.01; ***, P ≤ 0.001, from independent biological replicates.
Figure 8.
Figure 8.
Gbp4 and Clic5 are transcriptionally regulated in an IRF1-dependent fashion in macrophages. Results are shown as in the legend to Fig. 6. (A–C) Gbp4 (A) and Clic5 (C) are regulated in an IRF1-specific fashion (group III genes). The inset at the right side of A is a blowup of the key Gbp4 regulatory sites. (B) qPCR validation of Gbp4 gene expression under different conditions in WT and mutant Irf BMDMs (mean ± SD of independent biological replicates). (C) Clic5 as an IRF1-regulated gene (group III gene), including a cluster 1 peak 0.9 kb upstream of the transcription start site. (D and E) Clic5 mRNA expression (RT-qPCR; D) and H3K27Ac deposition (E) in response to IFN-γ in WT and Irf mutant BMDMs (ChIP-qPCR results are representative of three independent experiments). *, P ≤ 0.05; **, P ≤ 0.01; ***, P ≤ 0.001; Student’s t test relative to WT.
Figure 9.
Figure 9.
The IRF8/1 regulome in response to infections and in inflammatory diseases. (A) Bubble histograms showing a strong enrichment of TF binding clusters 1, 3, and 5 at genes activated in mouse lungs infected with Mycobacterium tuberculosis (TB) and in mouse brains during cerebral malaria–associated encephalitis (data are presented as in Fig. 4 D). (B) Enrichment of IRF8/IRF1 regulome transcripts among genes activated during pulmonary tuberculosis and during cerebral malaria. Histograms contrast enrichment of activated genes (Act) versus repressed genes (Rep) compared with sets of randomly selected genes (Rdm); p-values were calculated using Fisher’s exact test relative to random expectations (***, P < 0.001). (C) Same as B, but for genes with decreased expression in peripheral blood mononuclear cells from an immunodeficient patient homozygote for an IRF8K108E mutation. (D and E) Enrichment of the IRF8/1 regulome (D) among genes mutated in all eight categories (E) of human PIDs. (F) Enrichment of genes from the IRF8/IRF1 regulome within loci detected in GWASs of human chronic inflammatory diseases (red) compared with other noninflammatory diseases and other phenotypes (gray; Wilcoxon rank sum test; P = 1.3 × 10⁻⁶).

References

    1. Abdollahi A., Lord K.A., Hoffman-Liebermann B., and Liebermann D.A.. 1991. Interferon regulatory factor 1 is a myeloid differentiation primary response gene induced by interleukin 6 and leukemia inhibitory factor: role in growth inhibition. Cell Growth Differ. 2:401–407. - PubMed
    1. Al-Herz W., Bousfiha A., Casanova J.-L., Chatila T., Conley M.E., Cunningham-Rundles C., Etzioni A., Franco J.L., Gaspar H.B., Holland S.M., et al. 2014. Primary immunodeficiency diseases: an update on the classification from the international union of immunological societies expert committee for primary immunodeficiency. Front. Immunol. 5:162. - PMC - PubMed
    1. Aliberti J., Schulz O., Pennington D.J., Tsujimura H., Reis e Sousa C., Ozato K., and Sher A.. 2003. Essential role for ICSBP in the in vivo development of murine CD8α+ dendritic cells. Blood. 101:305–310. 10.1182/blood-2002-04-1088 - DOI - PubMed
    1. Barozzi I., Simonatto M., Bonifacio S., Yang L., Rohs R., Ghisletti S., and Natoli G.. 2014. Coregulation of transcription factor binding and nucleosome occupancy through DNA features of mammalian enhancers. Mol. Cell. 54:844–857. 10.1016/j.molcel.2014.04.006 - DOI - PMC - PubMed
    1. Beecham A.H., Patsopoulos N.A., Xifara D.K., Davis M.F., Kemppinen A., Cotsapas C., Shah T.S., Spencer C., Booth D., Goris A., et al. International IBD Genetics Consortium (IIBDGC) . 2013. Analysis of immune-related loci identifies 48 new susceptibility variants for multiple sclerosis. Nat. Genet. 45:1353–1360. 10.1038/ng.2770 - DOI - PMC - PubMed

Publication types

MeSH terms

Substances