. 2016 May 23;60(6):3380-97.
doi: 10.1128/AAC.00038-16. Print 2016 Jun.

Low-Frequency Drug Resistance in HIV-Infected Ugandans on Antiretroviral Treatment Is Associated with Regimen Failure

Affiliations

Low-Frequency Drug Resistance in HIV-Infected Ugandans on Antiretroviral Treatment Is Associated with Regimen Failure

Fred Kyeyune et al. Antimicrob Agents Chemother. .

Abstract

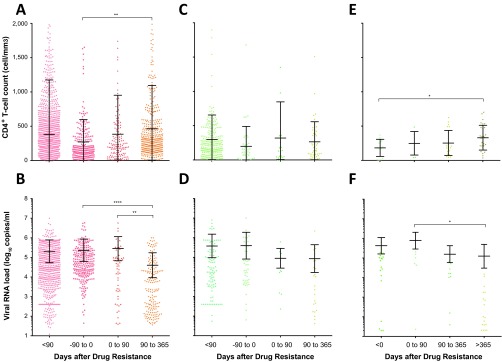
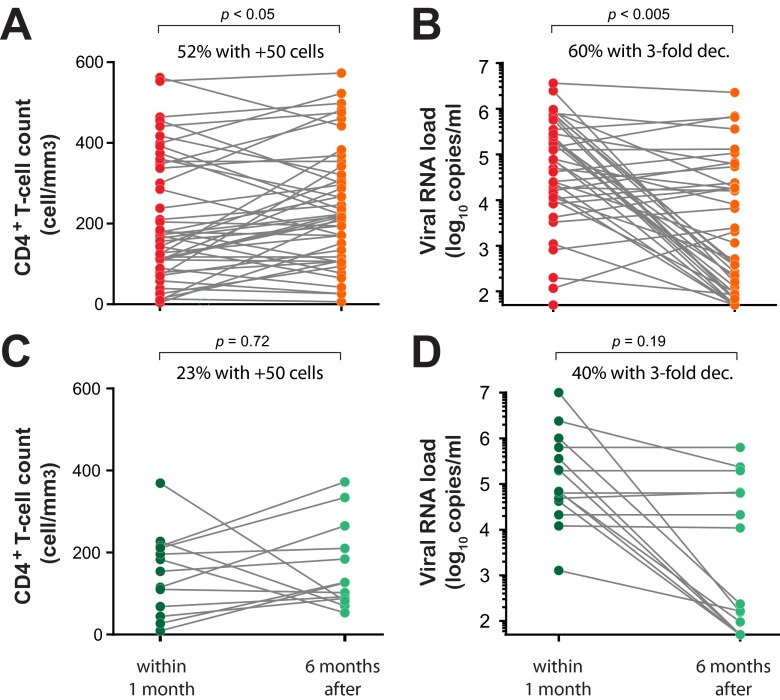
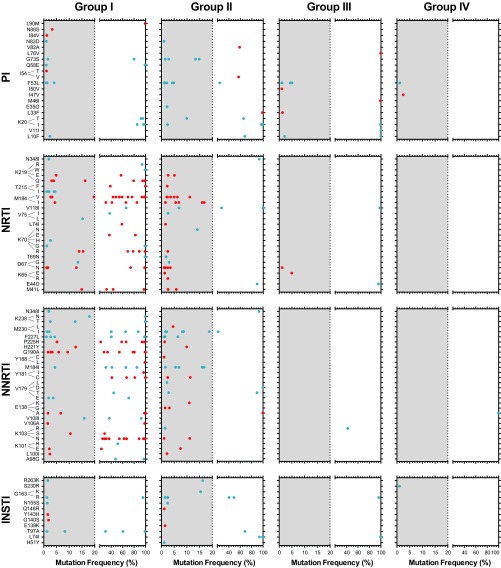
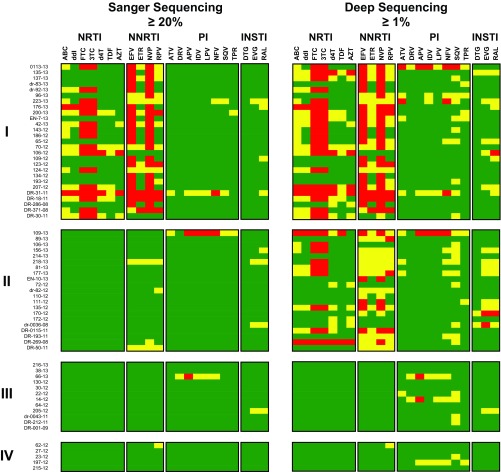
Most patients failing antiretroviral treatment in Uganda continue to fail their treatment regimen even if a dominant drug-resistant HIV-1 genotype is not detected. In a recent retrospective study, we observed that approximately 30% of HIV-infected individuals in the Joint Clinical Research Centre (Kampala, Uganda) experienced virologic failure with a susceptible HIV-1 genotype based on standard Sanger sequencing. Selection of minority drug-resistant HIV-1 variants (not detectable by Sanger sequencing) under antiretroviral therapy pressure can lead to a shift in the viral quasispecies distribution, becoming dominant members of the virus population and eventually causing treatment failure. Here, we used a novel HIV-1 genotyping assay based on deep sequencing (DeepGen) to quantify low-level drug-resistant HIV-1 variants in 33 patients failing a first-line antiretroviral treatment regimen in the absence of drug-resistant mutations, as screened by standard population-based Sanger sequencing. Using this sensitive assay, we observed that 64% (21/33) of these individuals had low-frequency (or minority) drug-resistant variants in the intrapatient HIV-1 population, which correlated with treatment failure. Moreover, the presence of these minority HIV-1 variants was associated with higher intrapatient HIV-1 diversity, suggesting a dynamic selection or fading of drug-resistant HIV-1 variants from the viral quasispecies in the presence or absence of drug pressure, respectively. This study identified low-frequency HIV drug resistance mutations by deep sequencing in Ugandan patients failing antiretroviral treatment but lacking dominant drug resistance mutations as determined by Sanger sequencing methods. We showed that these low-abundance drug-resistant viruses could have significant consequences for clinical outcomes, especially if treatment is not modified based on a susceptible HIV-1 genotype by Sanger sequencing. Therefore, we propose to make clinical decisions using more sensitive methods to detect minority HIV-1 variants.


Figures

FIG 1
FIG 1
CD4 cell counts and viral loads prior to and following antiretroviral drug resistance tests in Kampala, Uganda. (A to D) CD4+ T-cell counts (CD4) (A and C) and viral loads (VL) (B and D) were analyzed for <90 days to 1 year, up to 90 days preceding, 0 to 90 days following, or 90 days to 1 year following the identification of a drug-resistant genotype (A and B) or having a drug-susceptible genotype (C and D). A total of 356 and 67 patients with 3,017 CD4/1,727 VL and 451 CD4/239 VL tests were analyzed for panels A and B and for panels C and D, respectively. (E and F) A subset of 33 patients (groups II and II) lacking HIV-1 drug resistance by Sanger sequencing were analyzed for CD4+ T-cell counts (n = 69) (E) and viral loads (n = 66) (F). *, P < 0.05; **, P < 0.01; ****, P < 0.0001; ANOVA and multiple-comparison tests. Mean values and standard deviations are indicated.
FIG 2
FIG 2
Paired analyses of viral-load and CD4+ T-cell count changes before and after drug resistance testing. We performed paired analyses with CD4+ T-cell counts (A and C) and viral-RNA loads (B and D) and with samples taken prior to but closest to the drug resistance test date (within 1 month) and with the paired samples from the patients closest to 6 months after drug resistance testing. (A and B) A total of 46 patients were analyzed for CD4+ T-cell count pairs before and after detection of drug resistance by Sanger sequencing (A) and 42 patients for plasma viral-RNA loads before and after detection of drug resistance by Sanger sequencing (B). (C and D) Paired samples 1 month before and 6 months after drug resistance testing were also analyzed for patients with no detectable HIV drug resistance by Sanger sequencing, i.e., 13 patients/paired samples for CD4+ T-cell counts (C) and 15 patients/paired samples for plasma viral loads (D). The P values were calculated using paired one-tailed t tests.
FIG 3
FIG 3
Numbers and frequencies of HIV-1 drug resistance mutations in all 65 patients quantified using DeepGen. Primary and secondary/compensatory drug resistance mutations, defined by the Stanford University HIV Drug Resistance Database (http://hivdb.stanford.edu), are indicated by red and blue dots, respectively. Amino acid substitutions (mutations) associated with resistance to PIs, NRTIs, NNRTIs, and INSTIs identified in any of the 65 patients are shown. The gray shading depicts the range of minority HIV-1 mutations (i.e., ≥1% to <20%) identified by DeepGen but usually not detected by standard Sanger sequencing.
FIG 4
FIG 4
HIV-1 genotypic resistance interpretation based on Sanger or deep sequencing. A list of all the amino acid substitutions was used with the HIVdb Program Genotypic Resistance Interpretation Algorithm from the Stanford University HIV Drug Resistance Database (http://hivdb.stanford.edu) to infer the levels of susceptibility to protease, reverse transcriptase, and integrase inhibitors. High-level and intermediate resistance profiles are indicated in red and yellow, respectively, while a susceptible genotype is depicted in green. All 65 HIV-infected individuals classified in groups I, II, III, and IV, as described in Table 1, are indicated. NRTIs (ABC, ddI, FTC, 3TC, stavudine [d4T], TDF, and AZT), NNRTIs (EFV, ETR, NVP, and RPV), PIs (atazanavir [ATV], darunavir [DRV], amprenavir [APV], indinavir [IDV], lopinavir [LPV], nelfinavir [NFV], saquinavir [SQV], and tipranavir [TPV]), and INSTIs (dolutegravir [DTG], elvitegravir [EVG], and raltegravir [RAL]) are shown.
FIG 5
FIG 5
Neighbor-joining phylogenetic trees were constructed using reads with a frequency of ≥10 corresponding to 105-bp fragments from the protease, RT, and integrase regions. Each color-coded dot represents a unique variant (frequency not depicted) in each patient corresponding to groups I (blue), II (red), III (green), and IV (purple). HIV-1 subtype-specific clusters are depicted by clouds labeled for each subtype, i.e., A, C, or D. Bootstrap resampling (1,000 data sets) of the multiple alignments tested the statistical robustness of the trees, with percentages above 75% indicated by asterisks. s/nt, substitutions per nucleotide.
FIG 6
FIG 6
Intrapatient HIV-1 genetic-diversity analysis was performed by quantifying the unique deep-sequencing reads with a frequency of ≥10, corresponding to 105-bp fragments from the PR-, RT-, and INT-coding regions for each patient. Groups I, II, III, and IV were defined as shown in Table 1. Means ± standard deviations and statistically significant differences (unpaired t test; P values) are indicated.
FIG 7
FIG 7
Numbers and frequencies of all amino acid substitutions (mutations) detected at ≥1% in the entire HIV-1 pol gene (A), protease (B), reverse transcriptase (C), and integrase (D) coding regions using deep sequencing (DeepGen) in all 65 HIV-infected individuals. The median frequency and the mean number of mutations per sample in each group of patients are indicated. Statistically significant differences (Kruskal-Wallis ANOVA test) are marked: ****, P < 0.0001; ***, P < 0.001; **, P < 0.01; *, P < 0.05.
FIG 8
FIG 8
(A and B) Specific treatment outcomes in patients who switched (A) or remained on current (B) antiretroviral treatment regimens following the identification of drug resistance (A) or a drug-susceptible genotype (B) after a Sanger sequencing-based HIV-1-genotyping test. Viral-RNA levels (copies per milliliter of plasma) and CD4+ T-cell counts (cells per cubic millimeter of blood) were monitored over a 1,000- to 1,200-day period following a drug resistance test. (C) Frequencies of all amino acid substitutions (mutations) associated with resistance to PIs or RTIs detected at ≥1% using DeepGen. Primary (red) and secondary/compensatory (black) drug resistance mutations, defined by the Stanford University HIV Drug Resistance Database (http://hivdb.stanford.edu), are indicated. cART regimens for each patient are included.

Similar articles

Cited by

References

    1. Paredes R, Clotet B. 2010. Clinical management of HIV-1 resistance. Antiviral Res 85:245–265. doi:10.1016/j.antiviral.2009.09.015. - DOI - PubMed
    1. Zolopa AR. 2010. The evolution of HIV treatment guidelines: current state-of-the-art of ART. Antiviral Res 85:241–244. doi:10.1016/j.antiviral.2009.10.018. - DOI - PubMed
    1. UNAIDS. 2013. Global update on HIV treatment 2013: results, impact, and opportunities. UNAIDS, Geneva, Switzerland: http://apps.who.int/iris/bitstream/10665/85327/1/WHO_HIV_2013.9_eng.pdf.
    1. Tang JW, Pillay D. 2004. Transmission of HIV-1 drug resistance. J Clin Virol 30:1–10. doi:10.1016/j.jcv.2003.12.002. - DOI - PubMed
    1. Geretti AM. 2007. Epidemiology of antiretroviral drug resistance in drug-naive persons. Curr Opin Infect Dis 20:22–32. doi:10.1097/QCO.0b013e328013caff. - DOI - PubMed

Publication types

LinkOut - more resources