. 2016 Apr 5;113(14):3879-84.
doi: 10.1073/pnas.1503252113. Epub 2016 Mar 21.

Neural basis of reward anticipation and its genetic determinants

Collaborators, Affiliations

Neural basis of reward anticipation and its genetic determinants

Tianye Jia et al. Proc Natl Acad Sci U S A. .

Abstract

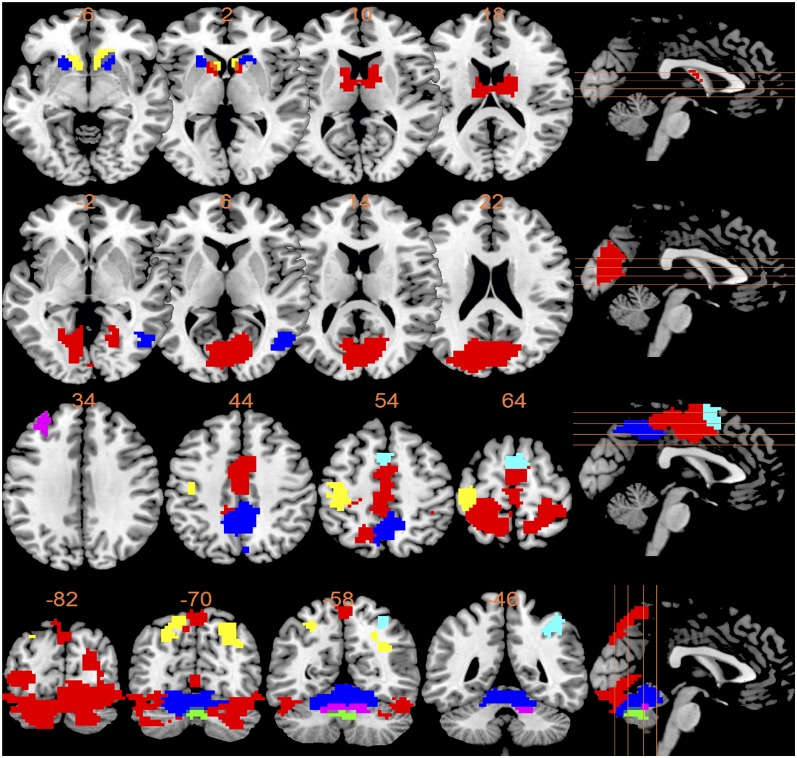
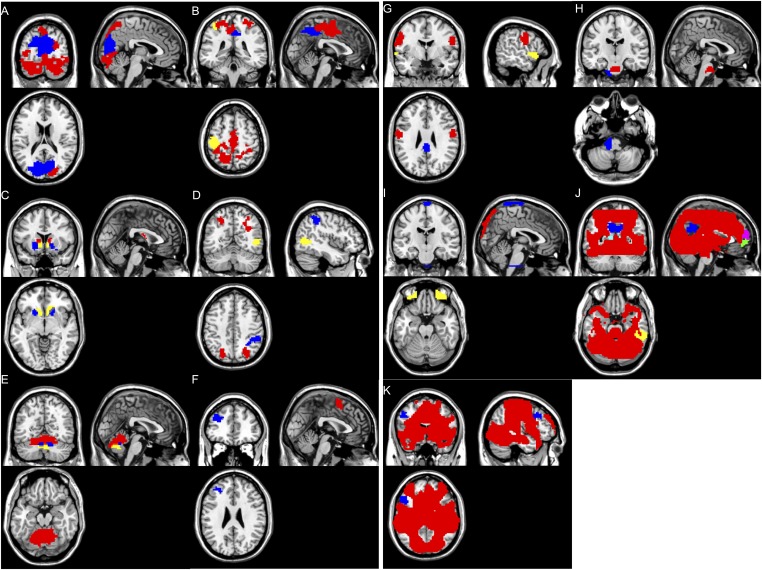
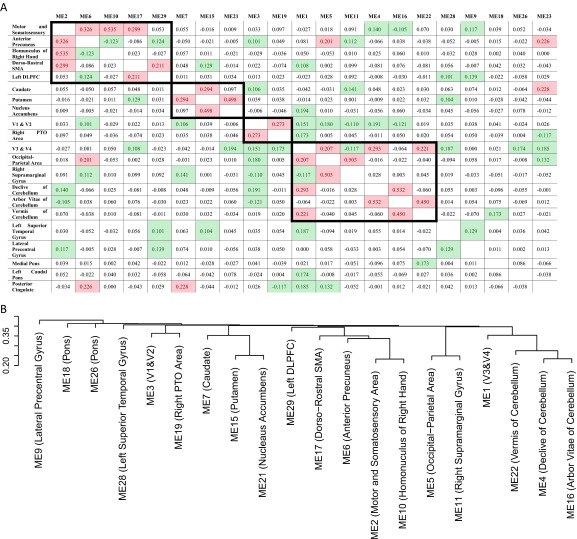
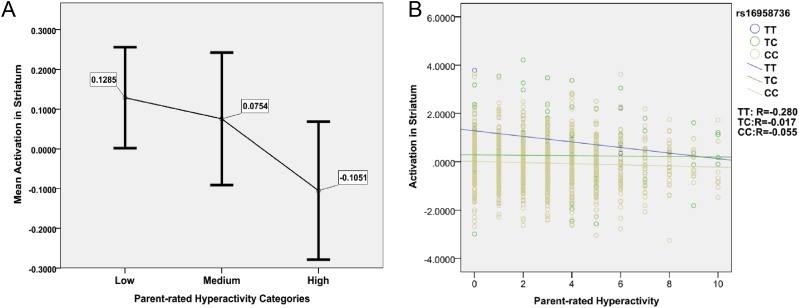
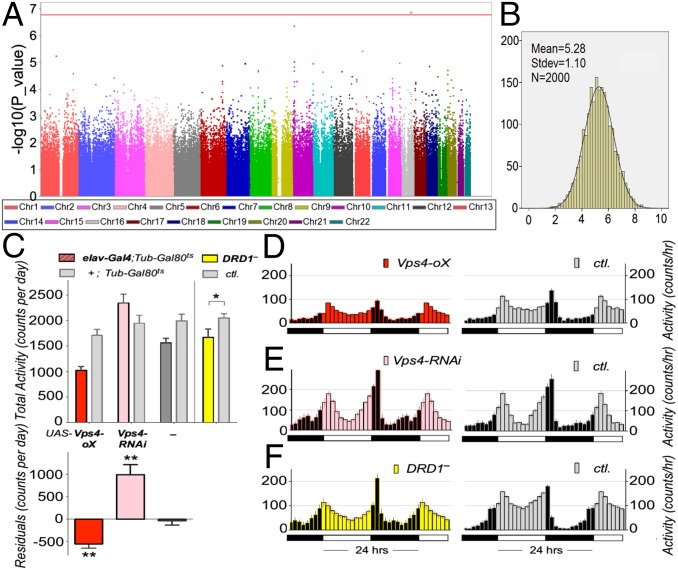
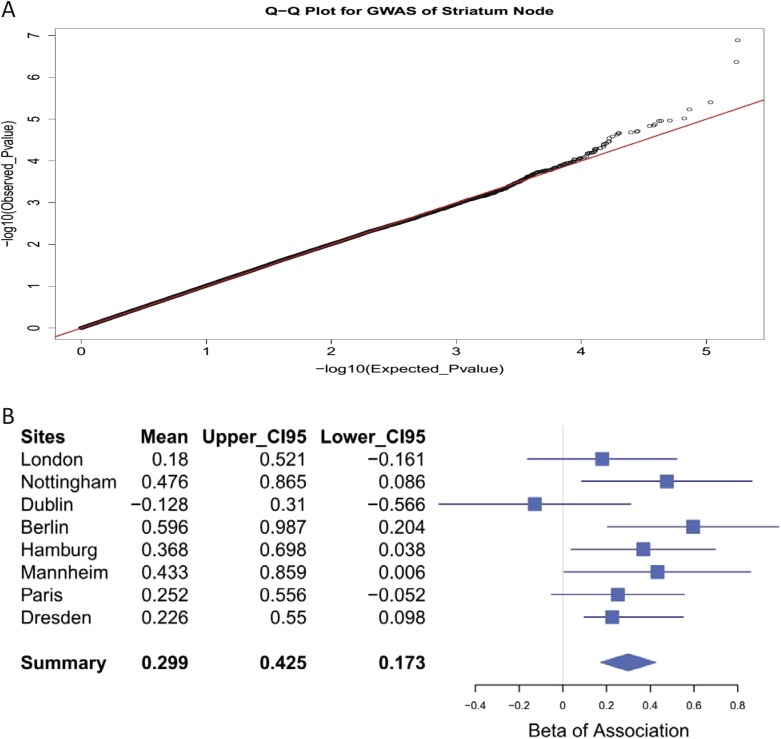
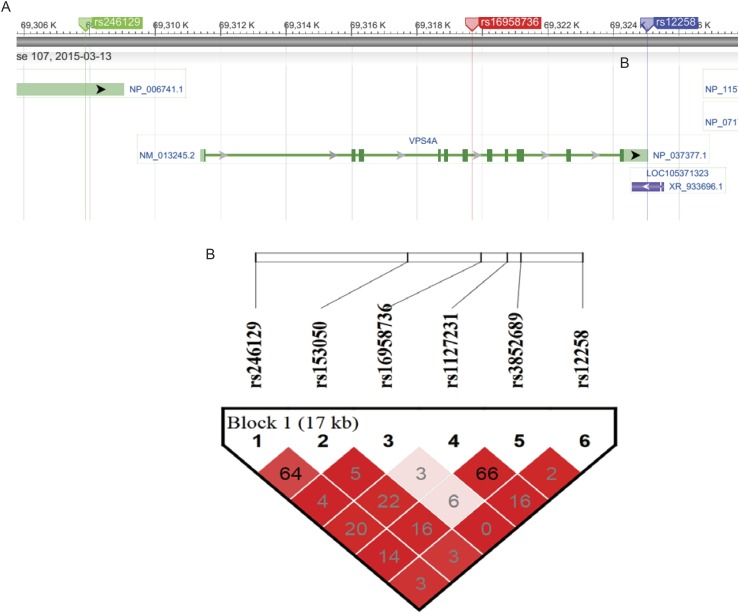
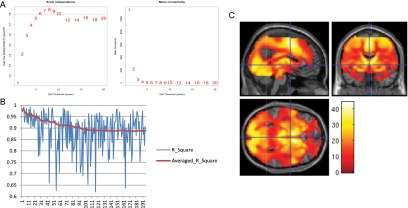
Dysfunctional reward processing is implicated in various mental disorders, including attention deficit hyperactivity disorder (ADHD) and addictions. Such impairments might involve different components of the reward process, including brain activity during reward anticipation. We examined brain nodes engaged by reward anticipation in 1,544 adolescents and identified a network containing a core striatal node and cortical nodes facilitating outcome prediction and response preparation. Distinct nodes and functional connections were preferentially associated with either adolescent hyperactivity or alcohol consumption, thus conveying specificity of reward processing to clinically relevant behavior. We observed associations between the striatal node, hyperactivity, and the vacuolar protein sorting-associated protein 4A (VPS4A) gene in humans, and the causal role of Vps4 for hyperactivity was validated in Drosophila Our data provide a neurobehavioral model explaining the heterogeneity of reward-related behaviors and generate a hypothesis accounting for their enduring nature.

Keywords: GWAS; VPS4A; dopamine receptor; fMRI; neural network.


Conflict of interest statement

Conflict of interest statement: T.B. has served as an adviser or consultant to Eli Lilly, Hexal Pharma, Medice, Novartis, Otsuka, Oxford Outcomes, PCM Scientific, Shire, and Vifor Pharma; he has received conference attendance support, conference support, or speaking fees from Eli Lilly, Medice, Novartis, and Shire, and he is involved in clinical trials conducted by Eli Lilly, Shire, and Vifor Pharma. G.J.B. has received honoraria for teaching from GE Healthcare and has served as a consultant for IXICO. A.L.W.B. has received funding from Science Foundation Ireland. T.R. has served as a consultant for Cambridge Cognition, Eli Lilly, Lundbeck, Otsuka, Shire, and Teva; he has received research support from Eli Lilly, GlaxoSmithKline, and Lundbeck; editorial honoraria from Elsevier and Springer-Verlag; educational speaking honoraria from Merck, Sharp, and Dohme; and royalties from Cambridge Cognition. The other authors report no financial relationships with commercial interests.

Figures

Fig. 1.
Fig. 1.
Illustration of fMRI clusters/nodes. (Row 1) Node 1: module 7, caudate (red); module 15, putamen (blue); and module 21, nucleus accumbens (yellow), with multisplicing axial view at Montreal Neurological Institute (MNI) coordinate z equal to −6, 2, 10, and 18. (Row 2) Node 2: module 3, visual area V1 and V2 (red) and module 19, the right parietal/temporal/occipital area (blue), with multisplicing axial view at MNI coordinate z equal to −2, 6, 14, and 22. (Row 3) Node 3: module 2, primary somatosensory and motor areas (red); module 6, anterior precuneus (blue); module 10, left precentral and postcentral gyrus (yellow); module 17, dorsorostral supplementary motor area (light blue); and module 29, left dorsolateral prefrontal cortex (purple), with multisplicing axial view at MNI coordinate z equal to 34, 44, 54, and 64. (Row 4) Node 4: module 1, visual area V3 and V4 (red); module 4, cerebellum anterior lobe and declive of posterior lobe (blue); module 5, superior parietal lobe (yellow); module 11, right supramarginal gyrus (light blue); module 16, arbor vitae (purple); and module 22, cerebellum vermis (green), with multisplicing sagittal view at MNI coordinate y equal to −82, −70, −58, and −46.
Fig. S1.
Fig. S1.
Top 30 modules from the WVCNA. (A) Occipital cortex regions. Red (module 1): Brodmann areas 18 and 19. Blue (module 3): Brodmann areas 17–19. (B) Sensory and motor cortex regions. Red (module 2): Brodmann areas 3–7. Blue (module 6): Brodmann area 7. Yellow (module 10): Brodmann areas 3 and 4. (C) Subcortical regions. Red (module 7): caudate. Blue (module 15): putamen. Yellow (module 21): nucleus accumbens. (D) Parietal cortex regions. Red (module 5): Brodmann area 7. (Right) Blue (module 11): Brodmann area 40. Yellow (module 19): Brodmann areas 37 and 39. (E) Cerebellum regions. Red (module 4): anterior lobe and declive of posterior lobe. Blue (module 16): arbor vitae. Yellow (module 22): tuber and declive vermis. (F) Frontal cortex regions. Red (module 17): Brodmann area 6. (Left) Blue (module 29): Brodmann area 9. (G) Ungrouped modules I. Red (module 9): Brodmann areas 4 and 6. Blue (module 23): Brodmann areas 23 and 31. (Left) Yellow (module 28): Brodmann areas 22 and 38. (H) Ungrouped modules II. Red (module 18): medial pons. Blue (module 26): left caudal pons. (I) Noise modules. Red (module 12), blue (module 13), and yellow (module 24). (J) Negative BOLD response modules I. Red (the whole-brain activation map): positive BOLD response. Blue (module 8), yellow (module 14), pink (module 20), light blue (module 25), and green (module 30). (K) Negative BOLD response modules II. Red (the whole-brian activation map): positive BOLD Response. Blue (module 27).
Fig. S2.
Fig. S2.
Hierarchical clustering analysis of functional connection matrix. (A) The functional connection matrix was calculated as pairwise partial correlations between all 21 valid modules, with all of the rest of the modules as control variables. For each module, the module names are listed in row 1, and the involved brain areas are listed in column 1. Cells with partial correlations that survived the Bonferroni correction for multiple testing are highlighted in green, and values over 0.20 are highlighted in red. Functional clusters/nodes established from hierarchical clustering as shown in B were grouped and highlighted with bold borders. (B) Tree of hierarchical clustering (in four clusters/nodes): node 1 (modules 7, 15, and 21), node 2 (modules 3 and 19), node 3 (modules 2, 6, 10, 17, and 29), and node 4 (modules 1, 4, 5, 11, 16, and 22). Module 23 (posterior cingulate cortex) was excluded from the tree because of its high correlation with multiple nodes. DLPFC, dorsal/lateral prefrontal cortex; ME, module eigenvoxel; PTO, parietal/temporal/occipital; SMA, supplementary motor area.
Fig. S3.
Fig. S3.
Evaluating the U-shaped model and genetic moderator model between ADHD symptoms and striatal activation. (A) The vertical axis indicates the mean activations in striatum, where the data have been standardized with mean equal to zero and SD equal to 1. The horizontal axis indicates three categories of parent-rated hyperactivity (the severity scores from 0 to 10, where 0 indicates no symptoms), where individuals scored 0 are marked as low to represent the control group, individuals scored 4 are marked as median, and individuals scored 7–10 are marked as high to represent the clinical relevant group. For each group, an error bar is drawn to illustrate the mean, which is shown as the number next to the error bar, and the 95% confidence interval is indicated by the horizontal bar at each end. The figure illustrates that the mean activation in striatum monotonically decreases with higher parent-rated hyperactivity score and therefore, does not support the inverted U-shaped model suggested by Plichta and Scheres (20). Meanwhile, the high group shows significantly lower striatum activation than the low group (P = 0.0197; df = 358). (B) The association between activations in striatum and patent-rated hyperactivity was evaluated in three subsamples in terms of genotypes of rs16958736 of the VPS4A gene, where CC represents homozygous cytosine, TC represent heterozygous thymine cytosine, and TT represents homozygous thymine. The vertical axis represents the activation in striatum, where the data have been standardized in the full sample with mean equal to zero and SD equal to 1. The horizontal axis represents the parent-rated hyperactivity ranging from 0 to 10 (i.e., from low to high).
Fig. 2.
Fig. 2.
Results for the VPS4A gene. (A) Manhattan plot of GWAS of the striatal node. The red line indicates the 5% genome-wide significance level based on the number of independent tests (22). SNP rs16958736 (Chr16: 69353587 in hg19) in the sixth intron of VPS4A was significant. (B) Histogram of bootstrapping results of the association between node 1 (the striatum) and SNP rs16958736; t statistics follow normal distribution, suggesting no hidden substructure and highly stable results. The mean t statistic of 5.28 (from 2,000 bootstrapping iterations) is equivalent to P = 1.53 × 10⁻⁷ (two-tailed test; df = 1,393) (SI Materials and Methods). (C) Locomotion phenotypes in Drosophila mutant strains. (Upper) Total daily locomotion activity of Drosophila expressing UAS transgenes for Vps4 in the nervous system specifically with the elav-Gal4 driver. In both males and females, expression of elav-Gal4 (dark gray bar; group marked by —) reduced activity by 20%. (Lower) We, thus, corrected for this in the experimental elav-Gal4;Tub-Gal80ts flies by dividing their total activity by 0.8, and then, we plotted the difference of the corrected experimental elav-Gal4;Tub-Gal80ts activity from their control +;Tub-Gal80ts activity. This figure shows that Vps4 overexpression (oX) significantly decreased (Cohen’s d = 1.02; t = 5.68; df = 31) and that knockdown (RNAi) significantly increased locomotion activity (Cohen’s d = 1.03; t = 4.51; df = 19). DRD1 mutant flies (yellow) showed hypolocomotion compared with their genetic background-matched control (Cohen’s d = 0.26; t = 2.08; df = 62). *P < 0.05; **P < 0.01. (D–F) Average activity plots of flies from C. Mutants (D) Vps4 overexpression, (E) Vps4 knockdown, and (F) DRD1 mutant are in Left, and their controls are in Right, respectively. Note that, for genetic reasons, we had to use females for Vps4 overexpression, which show a less diurnal activity pattern. ctl., Control.
Fig. S4.
Fig. S4.
Assessing the reliability of the GWAS finding. (A) The quantile–quantile (Q–Q) plot shows an almost perfect match between the observed and expected P values, which indicates that the applied significance level is reliable. (B) The forest plots of associations between node 1 and SNP rs16958736 in each research site: the regression coefficients (i.e., β or mean) and the corresponding upper and lower 95% confidence intervals (CI95s) of the association between the activation in node 1 and SNP rs16958736 for research sites are listed in Left. In the forest plot in Right, the means or β-values of each research site are shown as blue cubes, and the ranges between upper and lower CI95s are shown as the blue lines. The integrated mean or β as well as its upper and lower CI95s were calculated from the metaanalysis by using the inversion of squared SEs as weight, and the result is illustrated as the blue diamond, where the mean is indicated vertically and the range between upper and lower CI95s is indicated by horizontally. The corresponding P value of the summarized result was 3.26 × 10⁻⁶.
Fig. S5.
Fig. S5.
The structure and linkage disequilibrium (LD) plot of VPS4A genes. (A) The structure of the VPS4A gene was generated from the National Center for Biotechnology Information website (www.ncbi.nlm.nih.gov), where the first (rs246129) and last (rs12258) SNPs included in the following haplotype analyses are indicated in green and blue, respectively, and the main genetic finding rs16958736 is highlighted in red within the sixth intron of the VPS4A gene. (B) Haplotype blocks were generated through method solid spine of the LD. The whole VPS4A gene was involved in a single haplotype block. The white to red color scale measures the adjusted LD (D′) from low to high, whereas the number scale measures the squares of correlation coefficients (R2) between alleles from paired SNPs. The D′ is calculated as the LD divided by its theoretical maximum, and thus, D′ ranges between zero and one.
Fig. S7.
Fig. S7.
Histograms illustrating the distributions of the main variables. Main neuropsychological variables were the CANTAB affective go/no-go (AGN) task number of errors of omission to (A) positive and (B) negative stimuli and (C) spatial working memory (SWM) task number between trial errors. Main questionnaire variables were (D) k-est1 = estimated delay discounting rates for small long delay rewards, (E) k-est2 = estimated delay discounting rates for medium long delay rewards, and (F) k-est3 = estimated delay discounting rates for large long delay reward from the Monetary Choice Questionnaire, (G) the hyperactivity total scale scores from the SDQ, and (H) lifetime alcohol consumption from the European School Survey Project on Alcohol and Drugs (ESPAD). (I) In addition, we also included the measurement of impulsiveness from Cloninger’s Temperament and Character Inventory, Revised Version (TCI-R). For each variable, the mean, SD, and sample size were provided.
Fig. S6.
Fig. S6.
The preprocessing and stability assessment of the WVCNA. (A) The plots show the fitness of the scale-free model with different power parameters applied, and the power with the best fitness (power = 8) will be adopted to form the adjacency matrix. (B) The horizontal axis represents the sequence of modules, and the vertical axis represents the corresponding R2 values. In the blue line, each peak represents the original R2 of the corresponding module. In the red line, the averaged R2 is cumulatively calculated as the average of R2 values from module 1 to the current module. The overall average R2 is 0.88. Modules are ordered in decreasing size. (C) The positive t statistic of each voxel is presented with a color scale from red (low t statistic) to white (high t statistic).

References

    1. Knutson B, Wimmer GE. Splitting the difference: How does the brain code reward episodes? Ann N Y Acad Sci. 2007;1104:54–69. - PubMed
    1. Nymberg C, et al. IMAGEN Consortium Neural mechanisms of attention-deficit/hyperactivity disorder symptoms are stratified by MAOA genotype. Biol Psychiatry. 2013;74(8):607–614. - PubMed
    1. Peters J, et al. IMAGEN Consortium Lower ventral striatal activation during reward anticipation in adolescent smokers. Am J Psychiatry. 2011;168(5):540–549. - PubMed
    1. Stacey D, et al. IMAGEN Consortium RASGRF2 regulates alcohol-induced reinforcement by influencing mesolimbic dopamine neuron activity and dopamine release. Proc Natl Acad Sci USA. 2012;109(51):21128–21133. - PMC - PubMed
    1. Plichta MM, et al. Simultaneous EEG and fMRI reveals a causally connected subcortical-cortical network during reward anticipation. J Neurosci. 2013;33(36):14526–14533. - PMC - PubMed

Publication types

MeSH terms

Substances

LinkOut - more resources