

Cell-specific localization of alkaloids in Catharanthus roseus stem tissue measured with Imaging MS and Single-cell MS
- PMID: 27001858
- PMCID: PMC4833245
- DOI: 10.1073/pnas.1521959113
Cell-specific localization of alkaloids in Catharanthus roseus stem tissue measured with Imaging MS and Single-cell MS
Abstract
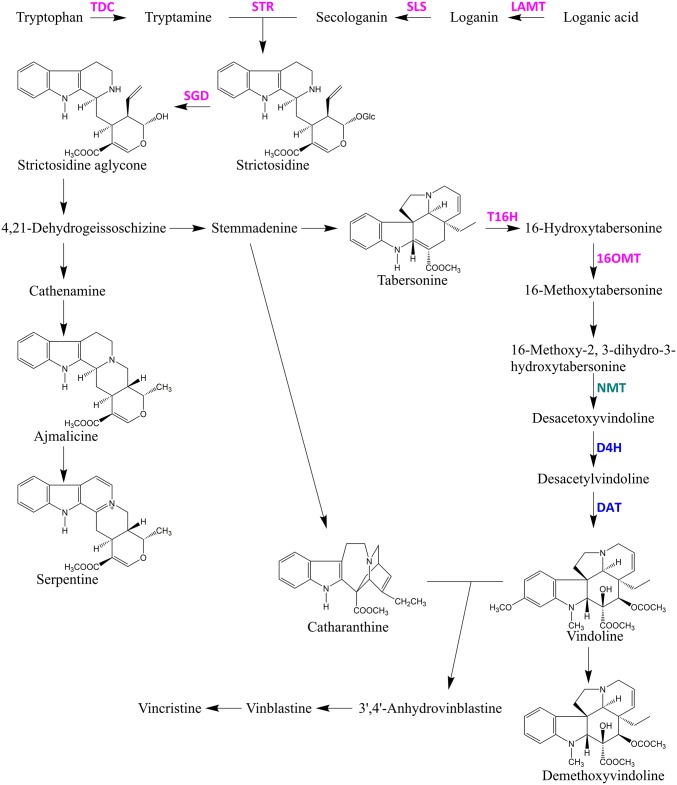
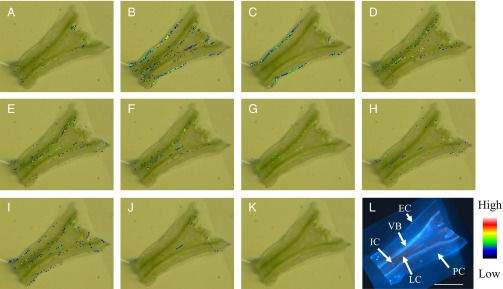
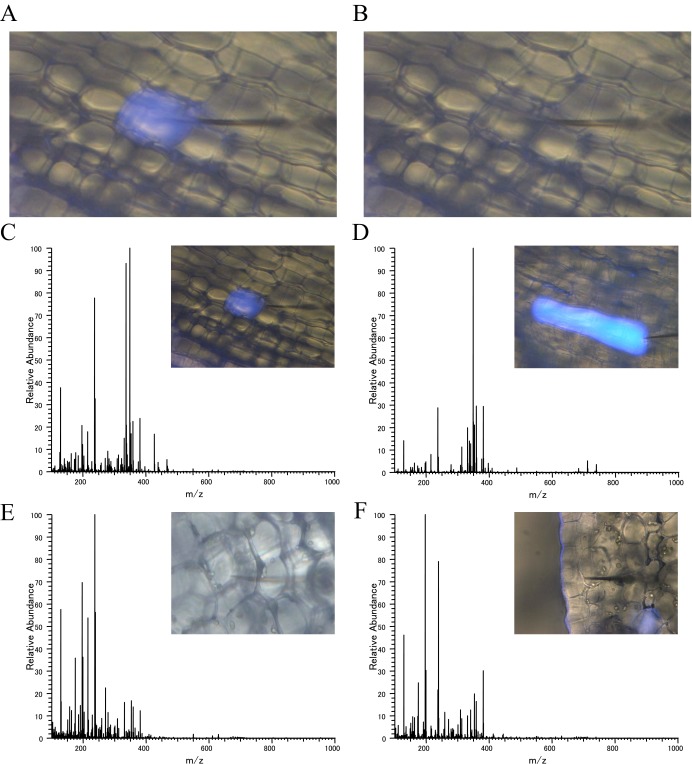
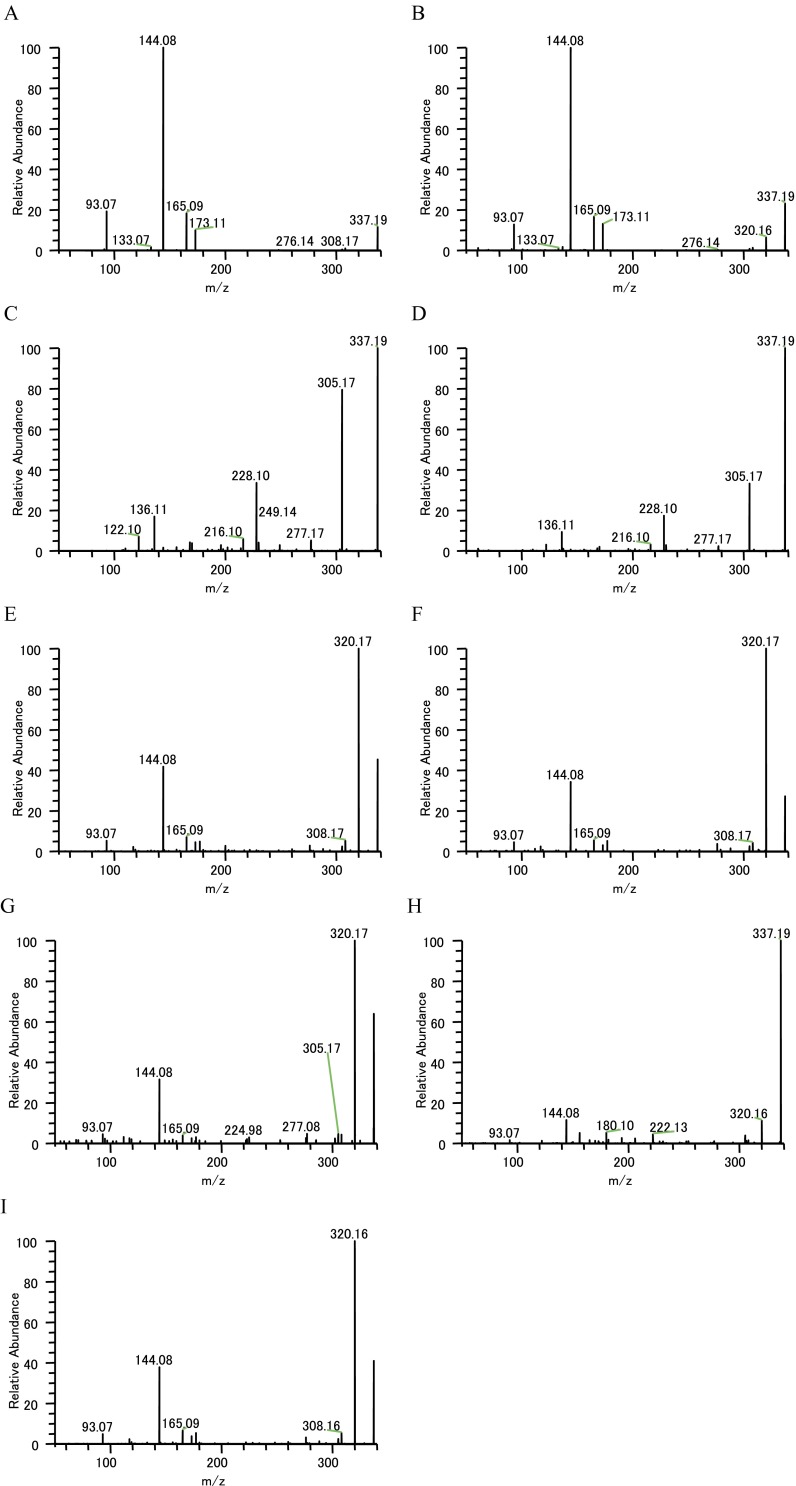
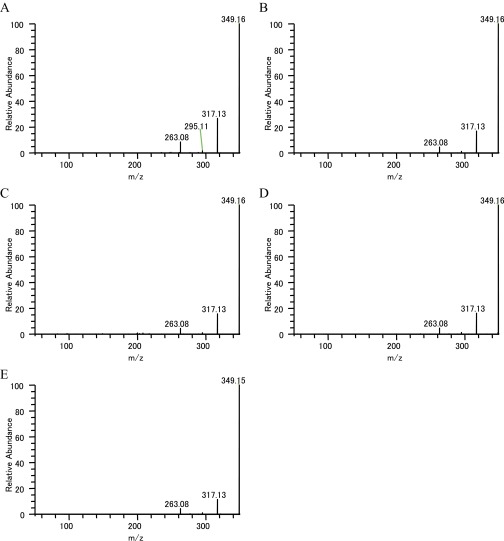
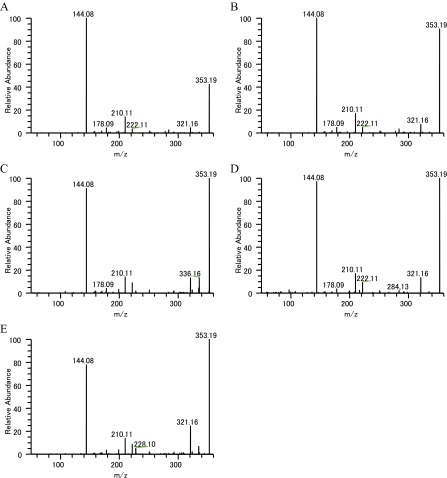
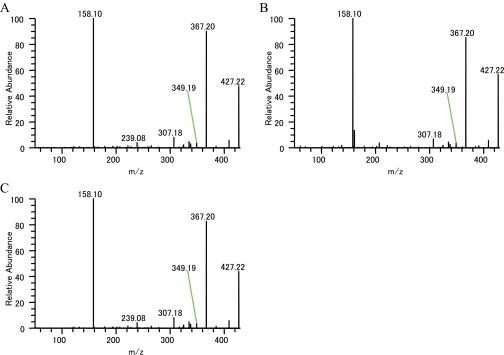
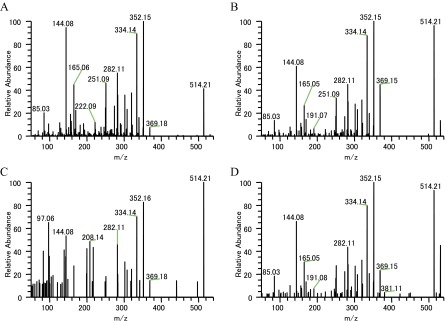
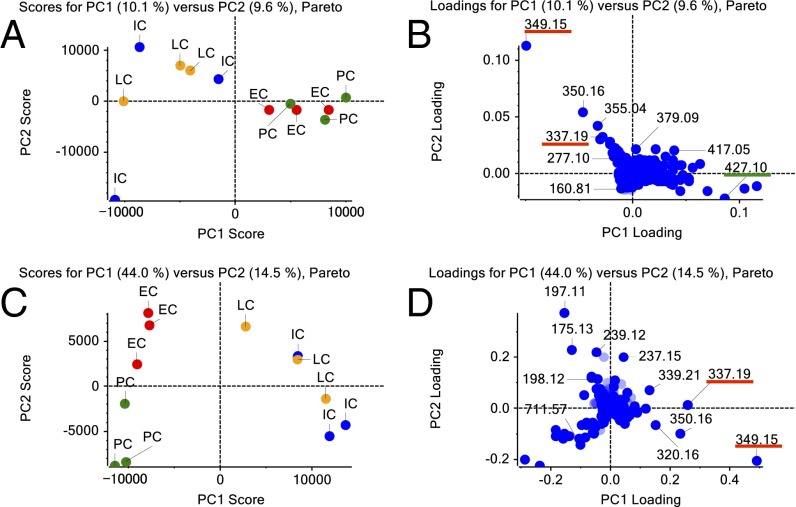
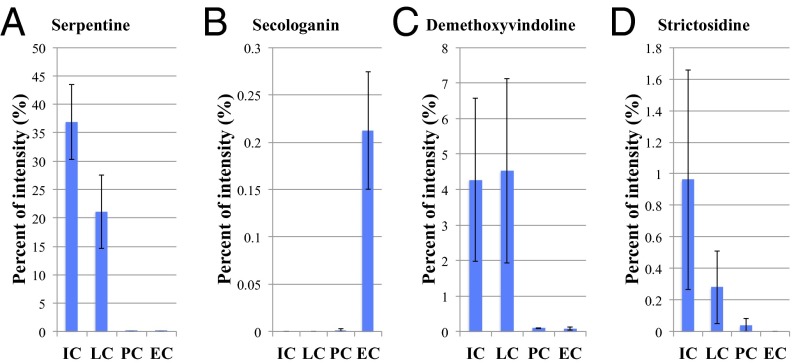
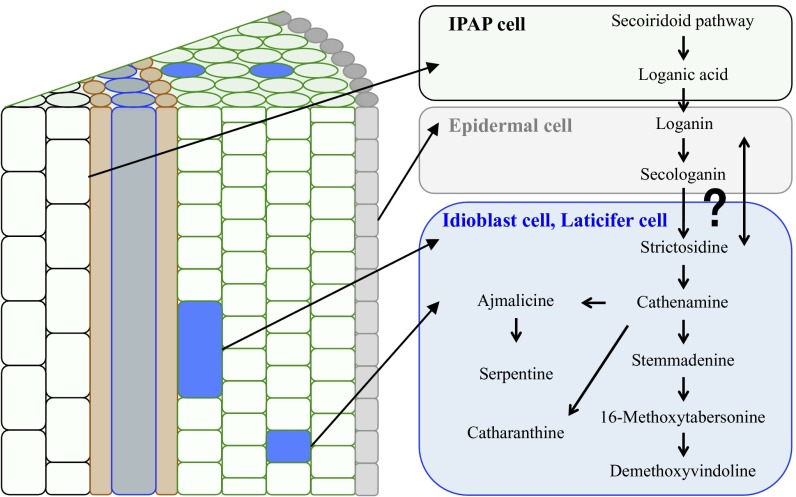
Catharanthus roseus (L.) G. Don is a medicinal plant well known for producing antitumor drugs such as vinblastine and vincristine, which are classified as terpenoid indole alkaloids (TIAs). The TIA metabolic pathway in C. roseus has been extensively studied. However, the localization of TIA intermediates at the cellular level has not been demonstrated directly. In the present study, the metabolic pathway of TIA in C. roseus was studied with two forefront metabolomic techniques, that is, Imaging mass spectrometry (MS) and live Single-cell MS, to elucidate cell-specific TIA localization in the stem tissue. Imaging MS indicated that most TIAs localize in the idioblast and laticifer cells, which emit blue fluorescence under UV excitation. Single-cell MS was applied to four different kinds of cells [idioblast (specialized parenchyma cell), laticifer, parenchyma, and epidermal cells] in the stem longitudinal section. Principal component analysis of Imaging MS and Single-cell MS spectra of these cells showed that similar alkaloids accumulate in both idioblast cell and laticifer cell. From MS/MS analysis of Single-cell MS spectra, catharanthine, ajmalicine, and strictosidine were found in both cell types in C. roseus stem tissue, where serpentine was also accumulated. Based on these data, we discuss the significance of TIA synthesis and accumulation in the idioblast and laticifer cells of C. roseus stem tissue.
Keywords: Catharanthus roseus; Imaging MS; Single-cell MS; idioblast cell; terpenoid indole alkaloid.
Conflict of interest statement
The authors declare no conflict of interest.
Figures
Similar articles
-
The complexity of intercellular localisation of alkaloids revealed by single-cell metabolomics.New Phytol. 2019 Oct;224(2):848-859. doi: 10.1111/nph.16138. Epub 2019 Sep 20. New Phytol. 2019. PMID: 31436868
-
Screening 64 cultivars Catharanthus roseus for the production of vindoline, catharanthine, and serpentine.Biotechnol Prog. 2011 Jul;27(4):937-43. doi: 10.1002/btpr.557. Epub 2011 Jun 14. Biotechnol Prog. 2011. PMID: 21674816
-
Screening and kinetic studies of catharanthine and ajmalicine accumulation and their correlation with growth biomass in Catharanthus roseus hairy roots.Pharm Biol. 2016 Oct;54(10):2033-43. doi: 10.3109/13880209.2016.1140213. Epub 2016 Mar 17. Pharm Biol. 2016. PMID: 26983347
-
Biosynthetic pathway of terpenoid indole alkaloids in Catharanthus roseus.Front Med. 2014 Sep;8(3):285-93. doi: 10.1007/s11684-014-0350-2. Epub 2014 Aug 26. Front Med. 2014. PMID: 25159992 Review.
-
Production and metabolic engineering of terpenoid indole alkaloids in cell cultures of the medicinal plant Catharanthus roseus (L.) G. Don (Madagascar periwinkle).Biotechnol Appl Biochem. 2009 Apr;52(Pt 4):313-23. doi: 10.1042/BA20080239. Biotechnol Appl Biochem. 2009. PMID: 19281450 Review.
Cited by
-
Multimatrix Variation Matrix-Assisted Laser Desorption/Ionization Mass Spectrometry as a Tool for Determining the Bonding of Nitrogen Atoms in Alkaloids.J Am Soc Mass Spectrom. 2022 Dec 7;33(12):2243-2249. doi: 10.1021/jasms.2c00221. Epub 2022 Nov 15. J Am Soc Mass Spectrom. 2022. PMID: 36379021 Free PMC article.
-
Advanced applications of mass spectrometry imaging technology in quality control and safety assessments of traditional Chinese medicines.J Ethnopharmacol. 2022 Feb 10;284:114760. doi: 10.1016/j.jep.2021.114760. Epub 2021 Oct 19. J Ethnopharmacol. 2022. PMID: 34678417 Free PMC article. Review.
-
Medicago truncatula ABCG10 is a transporter of 4-coumarate and liquiritigenin in the medicarpin biosynthetic pathway.J Exp Bot. 2017 Jun 1;68(12):3231-3241. doi: 10.1093/jxb/erx059. J Exp Bot. 2017. PMID: 28369642 Free PMC article.
-
Quantitative Single-Cell Mass Spectrometry Provides a Highly Resolved Analysis of Natural Product Biosynthesis Partitioning in Plants.J Am Chem Soc. 2024 Aug 28;146(34):23891-23900. doi: 10.1021/jacs.4c06336. Epub 2024 Aug 14. J Am Chem Soc. 2024. PMID: 39138868 Free PMC article.
-
In Situ Visual Distribution of Gelsemine, Koumine, and Gelsenicine by MSI in Gelsemiumelegans at Different Growth Stages.Molecules. 2022 Mar 10;27(6):1810. doi: 10.3390/molecules27061810. Molecules. 2022. PMID: 35335173 Free PMC article.
References
-
- De Luca V. Monoterpenoid indole alkaloid biosynthesis. In: Ashihara H, Grozier A, Komamine A, editors. Plant Metabolism and Biotechnology. Wiley; New York: 2011. pp. 263–291.
-
- Kutchan TM. A role for intra- and intercellular translocation in natural product biosynthesis. Curr Opin Plant Biol. 2005;8(3):292–300. - PubMed
-
- Hagel JM, Yeung EC, Facchini PJ. Got milk? The secret life of laticifers. Trends Plant Sci. 2008;13(12):631–639. - PubMed
-
- Pan Q, et al. Monoterpenoid indole alkaloids biosynthesis and its regulation in Catharanthus roseus: A literature review from genes to metabolites. Phytochem Rev. 2015 in press.
-
- van Der Heijden R, Jacobs DI, Snoeijer W, Hallard D, Verpoorte R. The Catharanthus alkaloids: Pharmacognosy and biotechnology. Curr Med Chem. 2004;11(5):607–628. - PubMed
Publication types
MeSH terms
Substances
LinkOut - more resources
Full Text Sources
Other Literature Sources
