. 2016 Apr 5;113(14):3873-8.
doi: 10.1073/pnas.1523357113. Epub 2016 Mar 21.

Spatiotemporal dynamics of auditory attention synchronize with speech

Affiliations

Spatiotemporal dynamics of auditory attention synchronize with speech

Malte Wöstmann et al. Proc Natl Acad Sci U S A. .

Abstract

Attention plays a fundamental role in selectively processing stimuli in our environment despite distraction. Spatial attention induces increasing and decreasing power of neural alpha oscillations (8-12 Hz) in brain regions ipsilateral and contralateral to the locus of attention, respectively. This study tested whether the hemispheric lateralization of alpha power codes not just the spatial location but also the temporal structure of the stimulus. Participants attended to spoken digits presented to one ear and ignored tightly synchronized distracting digits presented to the other ear. In the magnetoencephalogram, spatial attention induced lateralization of alpha power in parietal, but notably also in auditory cortical regions. This alpha power lateralization was not maintained steadily but fluctuated in synchrony with the speech rate and lagged the time course of low-frequency (1-5 Hz) sensory synchronization. Higher amplitude of alpha power modulation at the speech rate was predictive of a listener's enhanced performance of stream-specific speech comprehension. Our findings demonstrate that alpha power lateralization is modulated in tune with the sensory input and acts as a spatiotemporal filter controlling the read-out of sensory content.

Keywords: alpha lateralization; attention; neural oscillations; speech; synchronization.


Conflict of interest statement

The authors declare no conflict of interest.

Figures

Fig. 1.
Fig. 1.
(A) Trial design. An auditory spatial cue (1,000-Hz pure tone; 500 ms; left or right ear) indicated the to-be-attended side. After stimulus anticipation (0.5–2.3 s), four spoken digits were presented to the left and four different digits to the right ear (2.3–7.9 s). Auditory materials were presented in random noise (+10 dB signal-to-noise ratio). Participants were asked to select the four digits that were presented on the to-be-attended side from a visually presented array of digits. Each selected digit could either be a hit (selected digit appeared on to-be-attended side; green), a spatial confusion (selected digit appeared on to-be-ignored side; orange) or a random error (selected digit was not presented; purple; colored edges were not shown in the actual experiment). (B) Dots show the individual participants’ proportions of response types (n = 19). Horizontal lines show the mean across participants. ***P < 0.001. (C) Bars show mean proportions of trials as a function of the number of errors on a trial (0–4). Trials without any errors were classified as correct, trials with one or more errors were classified as incorrect. Error bars show 95% confidence intervals.
Fig. S1.
Fig. S1.
Bars show average proportions of three response types (hit, spatial confusion, random error), separately for attention-left (blue) and attention-right trials (red). Error bars indicate ±1 SEM ***P < 0.001; *P < 0.05.
Fig. 2.
Fig. 2.
(A) ITPC and (C) power of induced oscillations in the dichotic listening task averaged across all trials (attention-left and attention-right), 102 combined gradiometer sensors, and 19 participants. Note strong ITPC in low frequencies (1–5 Hz) time-locked to the acoustic stimulation and high power of alpha oscillations (8–12 Hz) throughout the trial. (B) Beamformer source reconstructions revealed posterior temporal cortex regions as the major generators of phase coherence and (D) occipital regions as generators for alpha power.
Fig. 3.
Fig. 3.
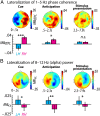
Topographic maps of the attentional modulation index in three time periods (cue, anticipation, speech stimulus presentation) for low-frequency ITPC (1–5 Hz AMIITPC; A, Top) and alpha power (8–12 Hz AMIα; B, Top). Bar graphs show mean across all sensors on the left hemisphere (LH) and right hemisphere (RH) for AMIITPC (A, Bottom) and AMIα (B, Bottom). Error bars indicate ±1 SEM. AMIITPC showed a significant hemispheric lateralization (RH > LH) only early during a trial, before presentation of the speech stimulus. The hemispheric difference in AMIα showed the opposite pattern (LH > RH) and was significant during the entire trial including speech stimulus presentation. *P < 0.05; **P < 0.01; ***P < 0.001; n.s., not significant.
Fig. S2.
Fig. S2.
AMI for frequencies 5–20 Hz averaged across all sensors (A) on the left hemisphere and (C) on the right hemisphere. (B) Mean AMI across time of the dichotic listening task (cue onset, 0 s; last digit offset, 7.9 s), for left sensors (red) and right sensors (blue). The white bar indicates frequencies for which the AMI differed significantly between left and right sensors (8–10.5 Hz; P < 0.05; paired t tests, FDR-corrected for multiple comparisons). The alpha frequency band (8–12 Hz) is highlighted in gray.
Fig. 4.
Fig. 4.
Overlays on brain surfaces show the alpha power (8–12 Hz) AMIα averaged across the time period of speech stimulus presentation (2.3–7.9 s). Warm colors indicate a relative increase in alpha power in attention-left compared with attention-right trials (and vice versa for cold colors). Overlays on the brain surfaces are masked at P > 0.05 (one-sample t tests of the attentional modulation index against zero; uncorrected). Note significant positive vs. negative AMIα values in left vs. right auditory cortex regions, respectively.
Fig. S3.
Fig. S3.
Overlays on brain surfaces show the alpha power (8–12 Hz) AMIα averaged across the time period of (A) cue presentation (0–0.5 s) and (B) stimulus anticipation (0.5–2.3 s). Warm colors indicate a relative increase in alpha power in attention-left compared with attention-right trials (and vice versa for cold colors). Overlays on the brain surfaces are masked at P > 0.05 (one-sample t tests of the AMIα against zero; uncorrected).
Fig. 5.
Fig. 5.
(A) 1- to 5-Hz phase coherence (ITPC; averaged across 102 combined gradiometer sensors; magenta) and average ALI (cyan) superimposed on a stimulus waveform. Spoken digits were presented at a frequency of 0.67 Hz (i.e., ∼1.49 s onset-to-onset delay of digits). (B) Phase angles of 0.67-Hz amplitude modulations of ITPC and ALI during speech stimulus presentation (2.3–7.9 s). Dots show 19 participants’ phase angles; lines show mean phase angles, which differed significantly for ALI vs. ITPC (P < 0.001). An average 137.65° or 570-ms phase lag of ALI relative to ITPC was observed.
Fig. S4.
Fig. S4.
To calculate the ALI, 20 left-hemispheric and 20 right-hemispheric sensors were selected for each individual (for details, see main text). The topographic map shows the number of subjects for whom individual sensors were selected (total number of subjects, n = 19). Note that centro-parietal sensors on both hemispheres were selected most frequently.
Fig. S5.
Fig. S5.
(A, Left) Topographic map of the average alpha power (8–12 Hz) AMIα across time of the dichotic listening task (0–7.9 s) for a single participant. (A, Right) Twenty sensors were selected on the left and right hemisphere that exhibited maximal and minimal AMIα values, respectively. Green and purple dots show selected sensors on the left and right hemisphere, respectively. Depending on the condition (attention left vs. attention right), these sensors were classified as ipsi (-lateral) and contra (-lateral) to calculate the ALI. (B) ALI for the subject shown in A superimposed on a stimulus waveform. The alpha lateralization index (cyan) exhibited characteristic modulations over the trial time course. During the speech stimulus presentation (2.3–7.9 s), the alpha lateralization index was modulated at the digit presentation rate (0.67 Hz), highlighted for illustration purposes by a 0.67-Hz cosine fit (dashed red line).
Fig. S6.
Fig. S6.
Time courses of alpha power (8–12 Hz) at ipsilateral (blue) and contralateral (red) sensors superimposed on a stimulus waveform. Note that participant-individual sensors (shown in Fig. S4 and Fig. 5A) were used for the calculation of ipsi- and contralateral alpha power time courses.
Fig. S7.
Fig. S7.
Temporal modulation of the ALI is driven to equal extents by alpha power changes at sensors ipsilateral and contralateral to the attended side. (A) ALI (cyan, Top) and alpha power at ipsilateral (blue) and contralateral sensors (red, Bottom) for one representative subject. (B) Scatterplots show the direct relationship of ipsi- (Top) and contralateral (Bottom) alpha power to the ALI, respectively (for 50-ms time steps from cue onset, 0 s, until trial end, 8 s), from the same subject as A. Least-squares regression lines (black) demonstrate a positive relationship between the ALI and ipsilateral alpha power (Top) and a negative relationship between the ALI and contralateral alpha power (Bottom). (C) To explore potential time-lagged correlations between ALI and ipsi-/contralateral alpha power, solid lines and shaded areas show the cross-correlation (mean ±1 SEM) between ALI and the ipsi- (blue) and contralateral (red) alpha power, respectively, averaged across all n = 19 subjects. Correlation coefficients of rcrosscorr = 0 would indicate no linear relationship between ipsi/contralateral alpha power and the ALI. Positive time lags indicate a temporal delay of the ALI with respect to ipsi/contralateral alpha power. Critically, for time lags close to 0 s (i.e., negligible temporal delay of the ALI relative to alpha power), ipsilateral alpha power correlates positively with the ALI (one sample t test of Fisher z-transformed rcrosscorr values at time lag 0 s; t18 = 2.9; P = 0.01; r = 0.44; strongest positive correlation, rcrosscorr = 0.22), whereas contralateral alpha power correlates with equal magnitude negatively with the ALI (t18 = 2.8; P = 0.01; r = 0.42; strongest negative correlation, rcrosscorr = –0.17). These results demonstrate that the positive peaks of the ALI (such as shown in Fig. 5) are driven by decreasing contralateral but also increasing ipsilateral alpha power.
Fig. 6.
Fig. 6.
(A) Amplitude spectra of the ALI during speech stimulus presentation (2.3–7.9 s) for correct (blue) and incorrect trials (red). Shaded areas show ±1 SEM. At the digit presentation rate of 0.67 Hz, the spectral amplitude was significantly enhanced for correct compared with incorrect trials (Inset; P = 0.017). (B) For incorrect trials, the amplitude of 0.67-Hz modulation of the ALI during speech stimulus presentation (2.3–7.9 s) was predictive of participants’ average number of errors (n = 19; P = 0.01).
Fig. S8.
Fig. S8.
Alpha lateralization index for correct (blue) and incorrect trials (red) superimposed on a stimulus waveform. Shaded areas indicate ±1 SEM.
Fig. S9.
Fig. S9.
Fourier spectra of 1- to 5-Hz ITPC during selective listening (2.3–7.9 s) for correct (blue) and incorrect trials (red) in analogy to the respective results for the alpha lateralization index (Fig. 6). Because trial number affects ITPC, Fourier spectra were estimated from the average of spectra calculated for 1,000 random draws with an equal number of correct and incorrect trials for each participant. Shaded areas indicate ±1 SEM. Spectral amplitude of 1–5 Hz ITPC at the 0.67-Hz digit presentation rate did not differ between correct and incorrect trials (Inset; paired-samples t test, t18 = 1.12; P = 0.276; r = 0.07), and no significant 0.67-Hz phase delay between 1- to 5-Hz ITPC for correct and incorrect trials was observed (Parametric Hotelling paired-sample test; F34 = 1.12; P = 0.348; r = 0.23).

References

    1. Ward LM. Synchronous neural oscillations and cognitive processes. Trends Cogn Sci. 2003;7(12):553–559. - PubMed
    1. Lakatos P, et al. The spectrotemporal filter mechanism of auditory selective attention. Neuron. 2013;77(4):750–761. - PMC - PubMed
    1. Fries P, Reynolds JH, Rorie AE, Desimone R. Modulation of oscillatory neuronal synchronization by selective visual attention. Science. 2001;291(5508):1560–1563. - PubMed
    1. Foxe JJ, Simpson GV, Ahlfors SP. Parieto-occipital approximately 10 Hz activity reflects anticipatory state of visual attention mechanisms. Neuroreport. 1998;9(17):3929–3933. - PubMed
    1. Strauss A, Wöstmann M, Obleser J. Cortical alpha oscillations as a tool for auditory selective inhibition. Front Hum Neurosci. 2014;8:350. - PMC - PubMed

Publication types

LinkOut - more resources