. 2016 Mar 22:7:10993.
doi: 10.1038/ncomms10993.

MicroRNA-378 limits activation of hepatic stellate cells and liver fibrosis by suppressing Gli3 expression

Affiliations

MicroRNA-378 limits activation of hepatic stellate cells and liver fibrosis by suppressing Gli3 expression

Jeongeun Hyun et al. Nat Commun. .

Abstract

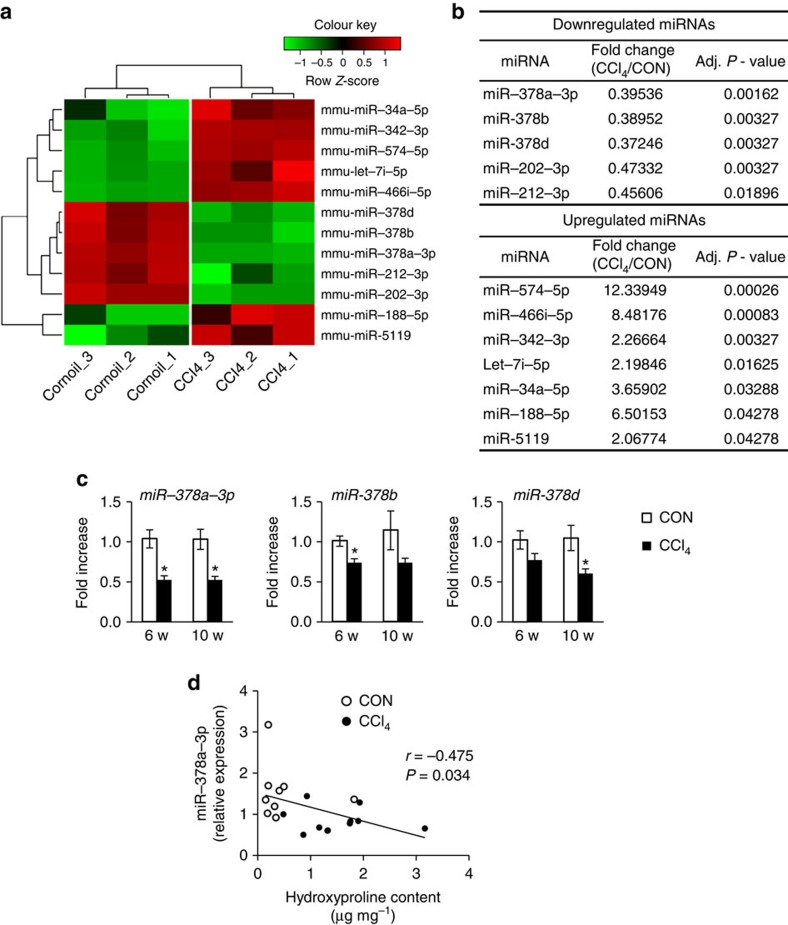
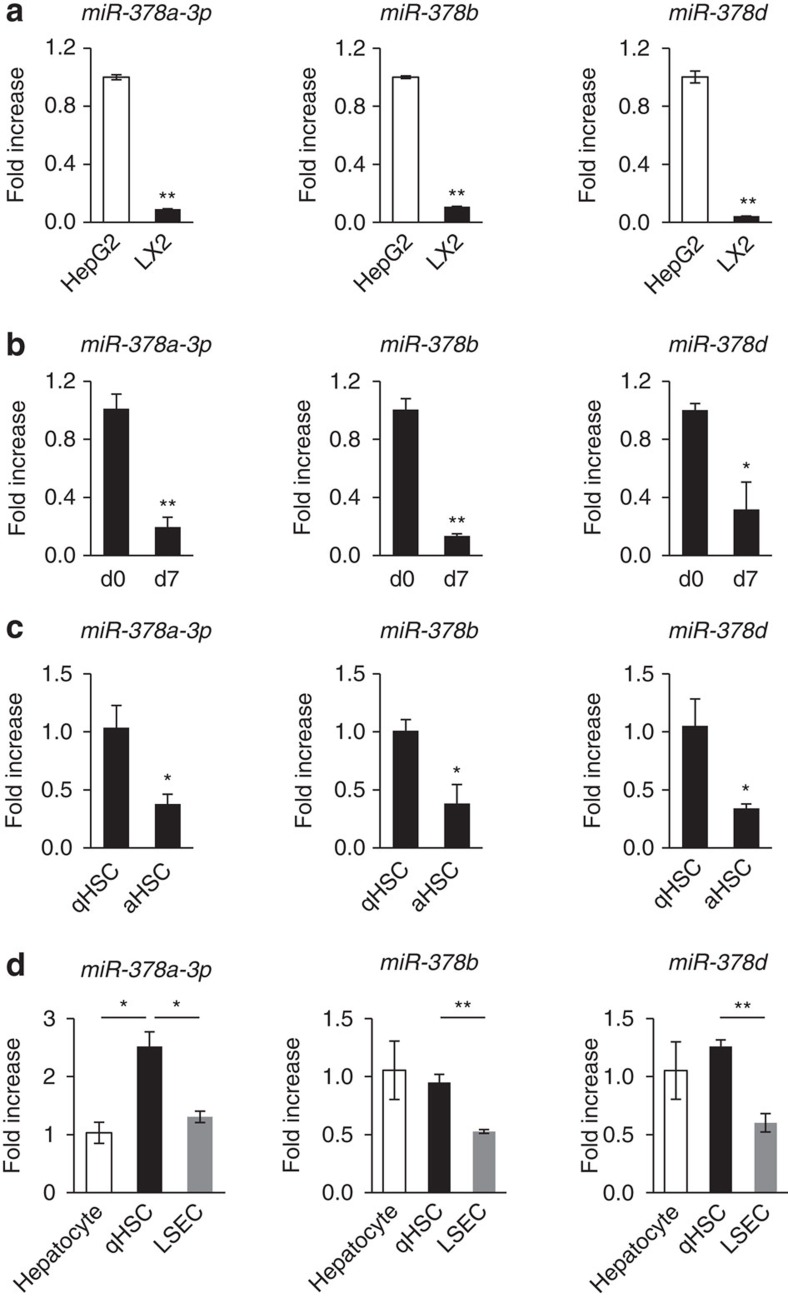
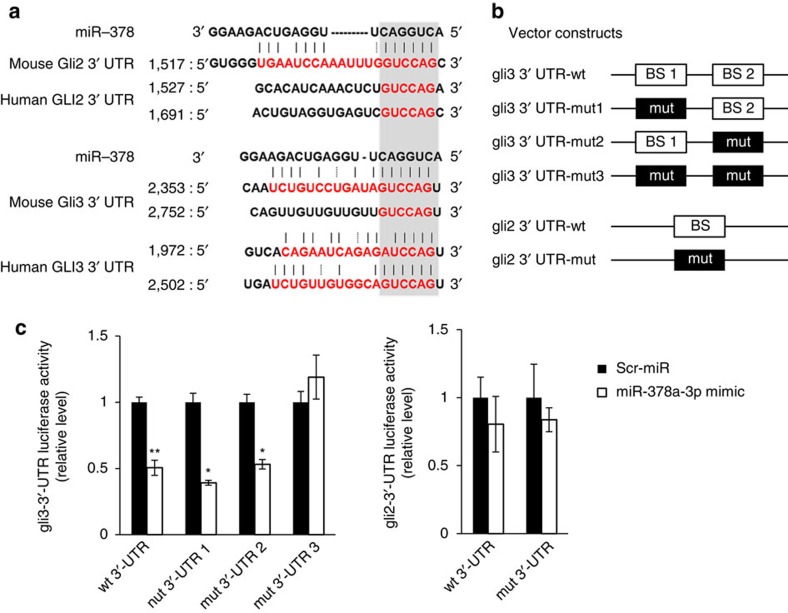
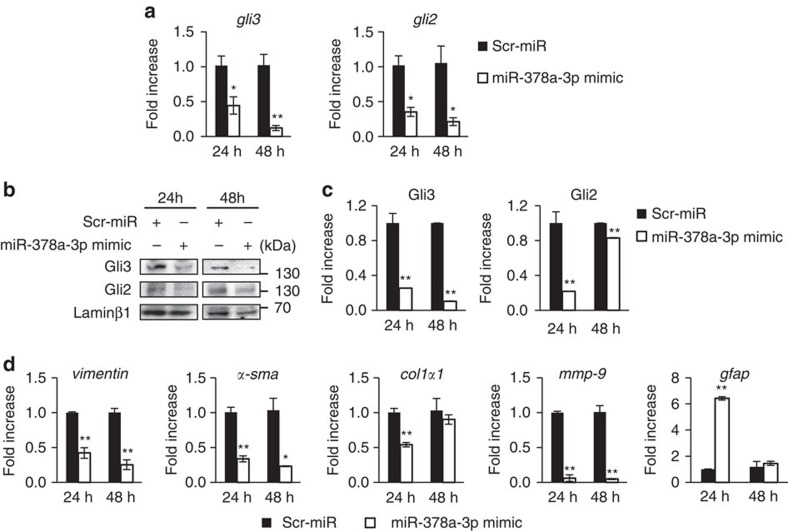
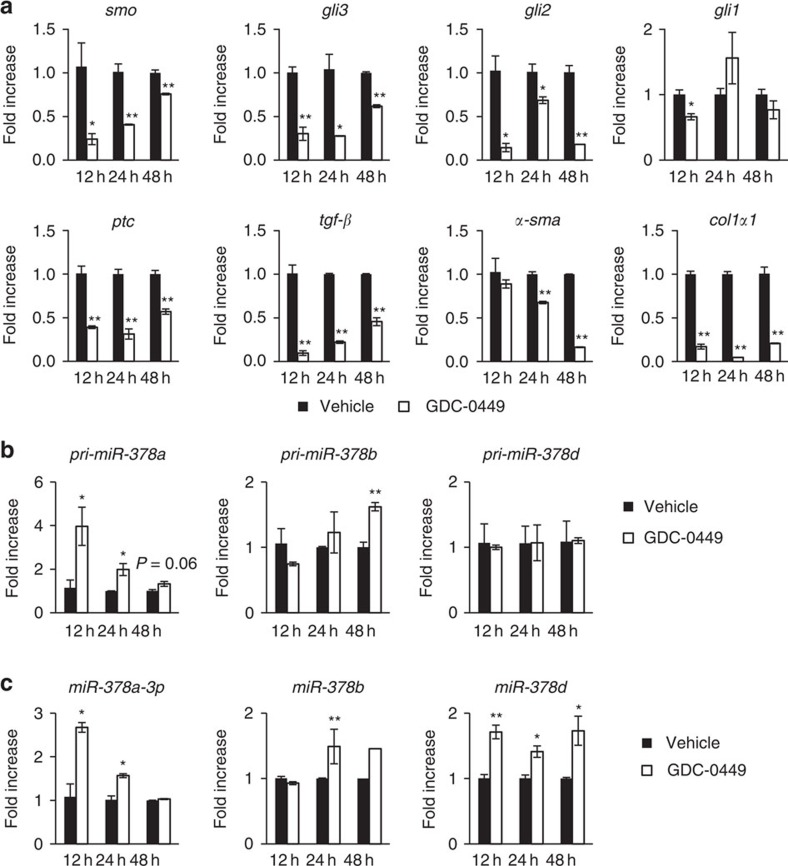
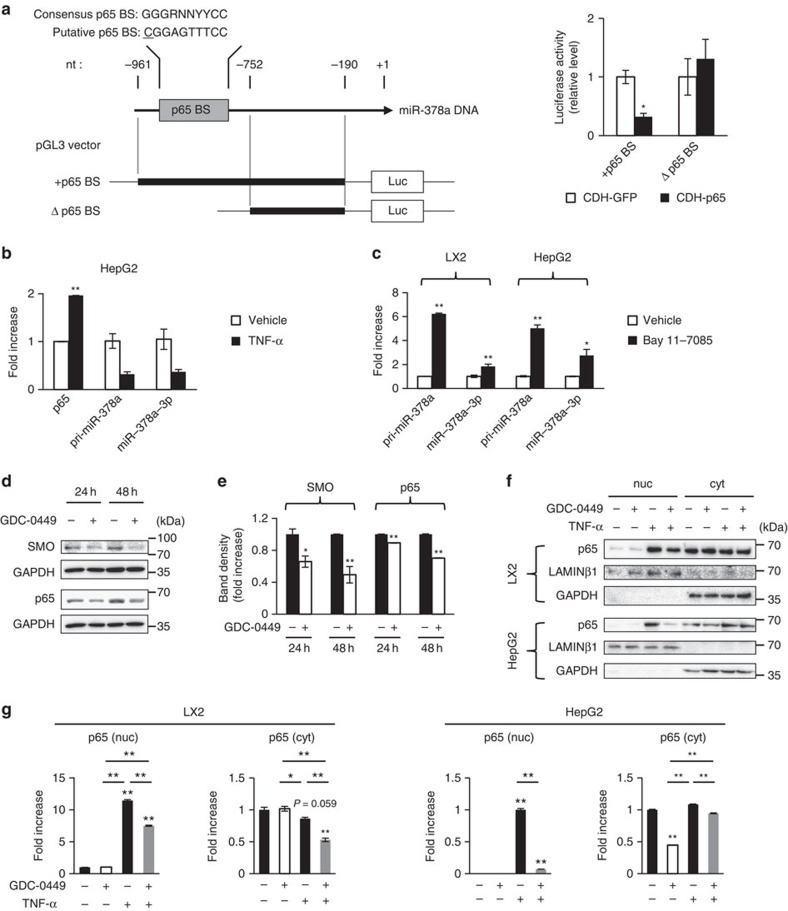
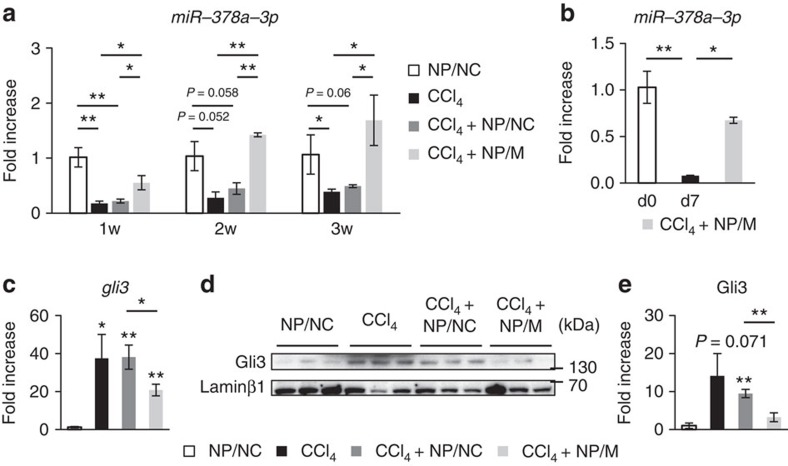
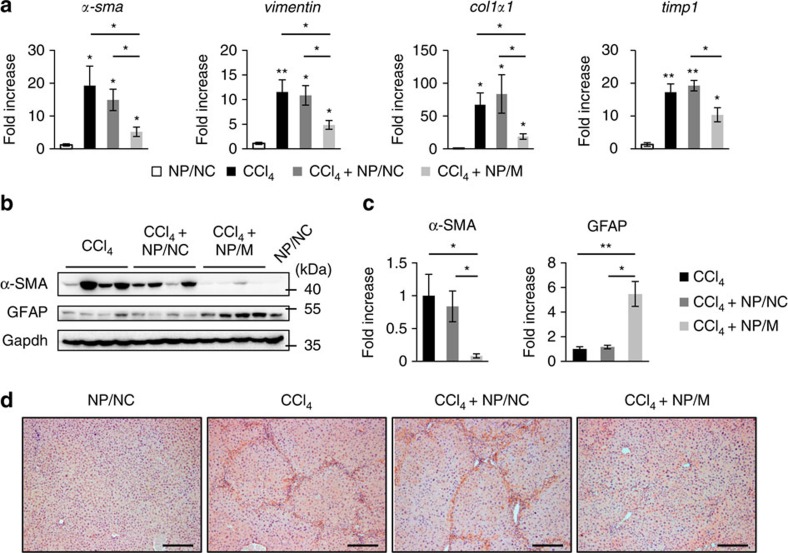
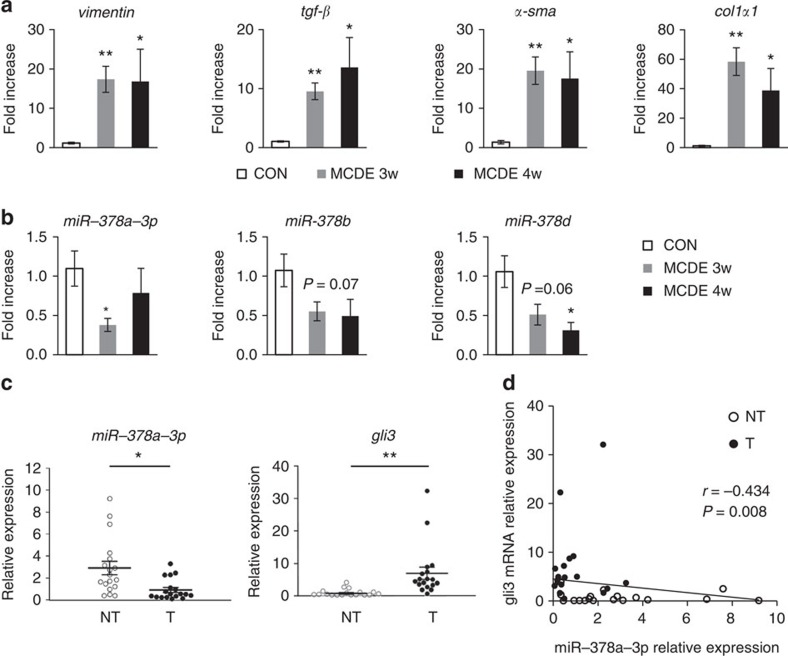
Hedgehog (Hh) signalling regulates hepatic fibrogenesis. MicroRNAs (miRNAs) mediate various cellular processes; however, their role in liver fibrosis is unclear. Here we investigate regulation of miRNAs in chronically damaged fibrotic liver. MiRNA profiling shows that expression of miR-378 family members (miR-378a-3p, miR-378b and miR-378d) declines in carbon tetrachloride (CCl4)-treated compared with corn-oil-treated mice. Overexpression of miR-378a-3p, directly targeting Gli3 in activated hepatic stellate cells (HSCs), reduces expression of Gli3 and profibrotic genes but induces gfap, the inactivation marker of HSCs, in CCl4-treated liver. Smo blocks transcriptional expression of miR-378a-3p by activating the p65 subunit of nuclear factor-κB (NF-κB). The hepatic level of miR-378a-3p is inversely correlated with the expression of Gli3 in tumour and non-tumour tissues in human hepatocellular carcinoma. Our results demonstrate that miR-378a-3p suppresses activation of HSCs by targeting Gli3 and its expression is regulated by Smo-dependent NF-κB signalling, suggesting miR-378a-3p has therapeutic potential for liver fibrosis.


Figures

Figure 1
Figure 1. MiR-378 family was downregulated in injured livers of CCl4-treated mice.
(a) Microarray analysis for miRNA expression was performed with total RNA extracted from livers of mice treated with corn-oil (control; CON) or CCl4 (n=3 per group) for 10 weeks. Heat map shows the two-way hierarchical clustering of differentially expressed miRNAs. Each row and column represents an miRNA and a condition, respectively. The row Z-score scaling for the expression level of each miRNA was calculated by subtracting the mean expression of the miRNA from its expression value and then dividing by the s.d. across all the samples. The closer the colour is to bright green, the lower the expression; the closer to bright red, the higher the expression. (b) A list of significantly dysregulated miRNAs in CCl4-treated compared with corn-oil-treated livers (CON) is shown, with the fold change and P-values. (c) qRT–PCR was performed to assess expression of the miR-378 family, including miR-378a-3p, miR-378b and miR-378d, in livers from the CON- and CCl4-treated mice at 6 and 10 weeks (n=4 per group). Mean±s.e.m. results are graphed (unpaired two-sample Student's t-test, *P<0.05 versus CON). (d) Spearman's rank correlation between miR-378a-3p expression and hydroxyproline contents in liver of all mice (n=20, Spearman's rank correlation analysis; r, correlation coefficient).
Figure 2
Figure 2. Decreased expression of the miR-378 family in aHSCs.
(a) Expression of miR-378 family members, including miR-378a-3p, miR-378b and miR-378d, in HepG2 (human liver epithelial cell line) and LX2 (human aHSC line) cells was examined by qRT–PCR. (b) qRT–PCR of the miR-378 family in primary qHSCs isolated from normal C57BL/6 mice at quiescent stage (d0; immediately after isolation) and in primary aHSCs (d7; cultured for 7 days). (c) qRT–PCR of the miR-378 family in primary HSCs isolated from corn-oil- (qHSCs) or CCl4-(aHSCs)-treated mice. (d) Expression of the miR-378 family in primary hepatocytes, primary qHSC and LSECs isolated from normal C57BL/6 mice, as assessed by qRT–PCR. All results of relative expression values are shown as mean±s.e.m. of triplicate experiments (unpaired two-sample Student's t-test, *P<0.05 and **P<0.005).
Figure 3
Figure 3. MiR-378 binds directly to Gli3.
(a) Using an miRNA database (www.miRNA.org), putative binding sites (red font) of miR-378a-3p were predicted in the 3′-UTR of gli2 and gli3 mRNA in mouse and human. The dashed line represents complementary base pairs between miR-378a-3p and gli2 or gli3 mRNA, whereas the grey shading indicates the seed sequence of miR-378a-3p. (b) psiCHECK-2 vectors containing either the wild-type (wt) or mutant (mut) binding site of miR-378a-3p in gli2 and gli3 mRNAs were constructed to conduct luciferase reporter assays. The mutated nucleotides are shown in Supplementary Fig. 6. (c) Dual luciferase reporter assay was performed to verify binding between miR-378a-3p and gli2 or gli3 mRNA. N2a, a mouse neuroblastoma cell line, was co-transfected with a psiCHECK-2 vector containing either the wt or mut target sites plus either the miR-378a-3p mimic or the scrambled (Scr)-miR (control) oligonucleotide. Results of relative luciferase activity are shown as mean±s.e.m. obtained from triplicate experiments (unpaired two-sample Student's t-test, *P<0.05, **P<0.005 versus Scr-miR).
Figure 4
Figure 4. MiR-378a-3p induces inactivation of primary HSCs by reducing Gli3 and Gli2 expression.
(a) Primary aHSCs were transfected with either an miR-378a-3p mimic (white bar) or scrambled (Scr)-miR (control) (black bar) oligonucleotide for 24 and 48 h, and expression of gli3 and gli2 was assessed by qRT–PCR. (b) Western blot analysis and (c) cumulative densitometric analyses for nuclear Gli3 (145 kDa) and Gli2 (133 kDa), with Laminβ1 (68 kDa) as an internal control for nuclear fraction. Data shown represent one of three experiments with similar results. (d) qRT–PCR analysis for genes related to activation of HSC, including vimentin, α-sma, col1α1 and mmp9, and the inactivation marker of HSC, gfap, in primary HSCs transfected with miR-378a-3p mimic (white bar) or scrambled (Scr)-miR (control) (black bar) oligonucleotide for 24 and 48 h. All results of relative expression values are shown as mean±s.e.m. obtained from triplicate experiments (unpaired two-sample Student's t-test, *P<0.05 and **P<0.005 versus Scr-miR).
Figure 5
Figure 5. Smo influences expression of miR-378.
(a) qRT–PCR of the expression of Hh signals, including smo, gli2, gli3, gli1 and ptc, and profibrotic genes, including tgf-β, α-sma and col1α, in LX2 cells treated with (white bar) or without (black bar) 1 μM of GDC-0449, a Smoothened (Smo) antagonist, for 12, 24 and 48 h. (b) qRT–PCR analysis of miR-378a precursor (pri-miR-378a), miR-378b precursor (pri-miR-378b) and miR-378d precursor (pri-miR-378d) in LX2 cells treated with (white bar) or without (black bar) GDC-0449 for 12, 24 and 48 h. (c) qRT–PCR analysis of mature family members, including miR-378a-3p, miR-378b and miR-378d, in LX2 cells treated with (white bar) or without (black bar) GDC-0449 for 12, 24 and 48 h. All results of relative expression values are shown as mean±s.e.m. obtained from triplicate experiments (unpaired two-sample Student's t-test, *P<0.05 and **P<0.005 versus vehicle).
Figure 6
Figure 6. Expression of miR-378a is regulated by Smo-dependent activation of p65.
(a) p65 binding site (p65BS, grey box) on miR-378a DNA (arrow line) and inserted regions (bold line) into pGL3-basic vector are depicted. The consensus and putative binding sequences predicted by TRANSFAC are shown; underlining indicates a mismatched nucleotide (nt). pGL3-basic vectors with (+p65BS) or without (Δp65BS) a p65-binding site on the promoter region of pri-miR-378a were constructed. HepG2 cells were co-transfected with +p65BS and either CDH-p65 (black) or CDH-GFP (control) (white), and a separate group of HepG2 cells were co-transfected with Δp65BS and either CDH-p65 (black) or CDH-GFP (white). Results of relative luciferase activity are shown as mean±s.e.m. obtained from triplicate experiments (unpaired two-sample Student's t-test, *P<0.05 versus CDH-GFP). Luc, luciferase. (b) Expression level of p65 mRNA, pri-miR-378a and miR-378a-3p in HepG2 treated with 100 ng ml−1 of TNF-α (black) or vehicle (white) was analysed by qRT–PCR. Relative expression is shown as mean±s.e.m. obtained from triplicate experiments, compared with HepG2 treated with vehicle (unpaired two-sample Student's t-test, *P<0.05 and **P<0.005 versus vehicle). (c) qRT–PCR analysis for pri-miR-378a and miR-378a-3p in LX2 or HepG2 cells treated with 2 μM of Bay 11-7085 (black) or vehicle (white). Results are shown as mean±s.e.m. obtained from triplicate experiments (unpaired two-sample Student's t-test, **P<0.005 versus vehicle). (d) Western blot analysis for SMO (86 kDa), p65 (65 kDa) and GAPDH (36 kDa) in LX2 cells treated with GDC-0449 (1 μM) or vehicle for 24 and 48 h. A representative image from triplicate experiments is shown. (e) Cumulative densitometric analyses of SMO and p65 western blotting results are displayed as the mean±s.e.m. (unpaired two-sample Student's t-test, *P<0.05 and **P<0.005 versus vehicle). (f) Western blot assay for p65, Laminβ1 (68 kDa) and GAPDH in vehicle- or TNF- and/or GDC-0449-treated LX2 and HepG2 cells. Laminβ1 and GAPDH were used as internal controls for the nuclear (nuc) and cytosolic (cyt) fractions, respectively. Data shown represent one of three experiments with similar results. (g) Cumulative densitometric analyses of SMO and p65 western blotting results are displayed as the mean±s.e.m. (one-way analysis of variance (ANOVA) with Tukey corrections, *P<0.05 and **P<0.005 versus vehicle-treated control).
Figure 7
Figure 7. NPs having miR-378a-3p increase the level of miR-378a-3p but decrease Gli3 expression in CCl4-treated mice.
(a) qRT–PCR for miR-378a-3p in livers from NP/NC, CCl4, CCl4-treated with NP/NC (CCl4+NP/NC) or NP/M (CCl4+NP/M) mice (n=4 per group). Mean±s.e.m. results are graphed (Kruskal–Wallis test and unpaired two-sample Student's t-test, *P<0.05 and **P<0.005 versus NP/NC). (b) qRT–PCR of miR-378a-3p in primary qHSCs isolated from normal mice at quiescent stage (d0; immediately after isolation), primary aHSCs (d7; cultured for 7 days) and primary HSCs isolated from CCl4+NP/M mice at 3 weeks after NPs treatment. Results of relative expression values are shown as mean±s.e.m. of triplicate experiments (one-way analysis of variance (ANOVA) with Tukey corrections, *P<0.05 and **P<0.005 versus d0). (c) qRT–PCR analysis for gli3 in livers from all mice at 3 weeks after NPs treatment (n=4 per group). Mean±s.e.m. results are graphed (Kruskal–Wallis test and unpaired two-sample Student's t-test, *P<0.05 and **P<0.005 versus NP/NC). (d) Western blot analysis for Gli3 (145 kDa) and Laminβ1 (68 kDa, internal control for nuclear fraction) in livers of three representative mice from each group. Data shown represent one of three experiments with similar results. (e) Cumulative densitometric analyses of Gli3 western blotting results are displayed as the mean±s.e.m. (Kruskal–Wallis test and unpaired two-sample Student's t-test, **P<0.05).
Figure 8
Figure 8. MiR-378a-3p promotes inactivation of HSC in CCl4-treated mice.
(a) qRT–PCR analysis for α-sma, vimentin, col1α1 and timp1 in NP/NC, CCl4, CCl4+NPs/NC and CCl4+NPs/M group (n=4 per group). All results of relative expression values are shown as mean±s.e.m. (Kruskal–Wallis test and unpaired two-sample Student's t-test, *P<0.05 and **P<0.005 versus NP/NC). (b) Western blot analysis for α-SMA (42 kDa), GFAP (50 kDa) and GAPDH (36 kDa) in livers of representative mice from each group. Data shown represent one of three experiments with similar results. (c) Cumulative densitometric analyses of α-SMA and GFAP western blotting results are displayed as the mean±s.e.m. (Kruskal–Wallis test and unpaired two-sample Student's t-test, *P<0.05 and **P<0.005). (d) Immunohistochemistry for α-SMA in liver sections from representative NP/NC, CCl4, CCl4+NPs/NC and CCl4+NPs/M group (scale bar, 100 μm).
Figure 9
Figure 9. Expression of miR-378 declines in injured liver of MCDE-fed mice and of patients with HCC.
(a) qRT–PCR of pro-fibrotic markers, vimentin, tgf-β, α-sma and col1α1, in mice fed with normal chow (CON) or a methionine/choline-deficient diet supplemented with 0.1% ethionine (MCDE) for 3 and 4 weeks (n=4 per group). Mean±s.e.m. results are graphed (unpaired two-sample Student's t-test, * P<0.05 and ** P<0.005 versus CON). (b) Expression of miR-378 family members, including miR-378a-3p, miR-378b and miR-378d, in MCDE-treated mice was examined (n=4 per group). Mean±s.e.m. results are graphed (unpaired two-sample Student's t-test, *P<0.05 versus CON). (c) qRT–PCR of miR-378a-3p and gli3 in paired non-tumour (NT) and tumour (T) regions of liver tissue from patients with human hepatocellular carcinoma (HCC) (n=18 patients). Individual values represented by the relative expression are shown by dots and their mean±s.e.m. results presented for each group (paired two-sample Student's t-test, *P<0.05 and **P<0.005 versus NT). (d) Spearman's rank correlation between miR-378a-3p expression and gli3 expression in NT and T of HCC (Spearman's rank correlation analysis; r, correlation coefficient).

References

    1. Kim Y. et al.. Temporal trends in population-based death rates associated with chronic liver disease and liver cancer in the United States over the last 30 years. Cancer 120, 3058–3065 (2014). - PMC - PubMed
    1. Bataller R. & Brenner D. A. Liver fibrosis. J. Clin. Invest. 115, 209–218 (2005). - PMC - PubMed
    1. Kim V. N. MicroRNA biogenesis: coordinated cropping and dicing. Nat. Rev. Mol. Cell Biol. 6, 376–385 (2005). - PubMed
    1. Bartel D. P. MicroRNAs: target recognition and regulatory functions. Cell 136, 215–233 (2009). - PMC - PubMed
    1. Bartel D. P. MicroRNAs: genomics, biogenesis, mechanism, and function. Cell 116, 281–297 (2004). - PubMed

Publication types

MeSH terms