

Standardized Clinical Pathways for Hospitalized Children and Outcomes
- PMID: 27002007
- PMCID: PMC5531174
- DOI: 10.1542/peds.2015-1202
Standardized Clinical Pathways for Hospitalized Children and Outcomes
Abstract
Background and objective: Clinical pathways standardize care for common health conditions. We sought to assess whether institution-wide implementation of multiple standardized pathways was associated with changes in utilization and physical functioning after discharge among pediatric inpatients.
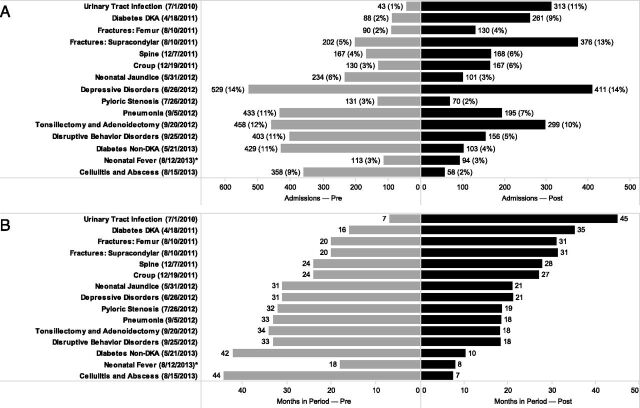
Methods: Interrupted time series analysis of admissions to a tertiary care children's hospital from December 1, 2009 through March 30, 2014. On the basis of diagnosis codes, included admissions were eligible for 1 of 15 clinical pathways implemented during the study period; admissions from both before and after implementation were included. Postdischarge physical functioning improvement was assessed with the Pediatric Quality of Life Inventory 4.0 Generic Core or Infant Scales. Average hospitalization costs, length of stay, readmissions, and physical functioning improvement scores were calculated by month relative to pathway implementation. Segmented linear regression was used to evaluate differences in intercept and trend over time before and after pathway implementation.
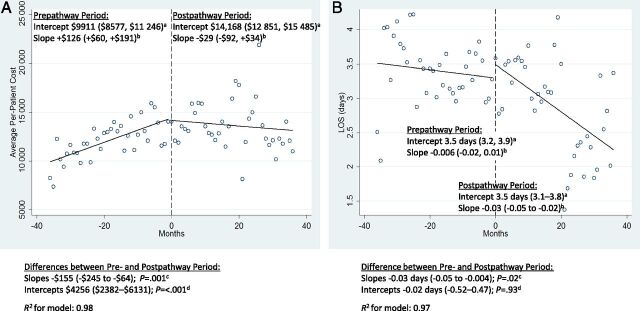
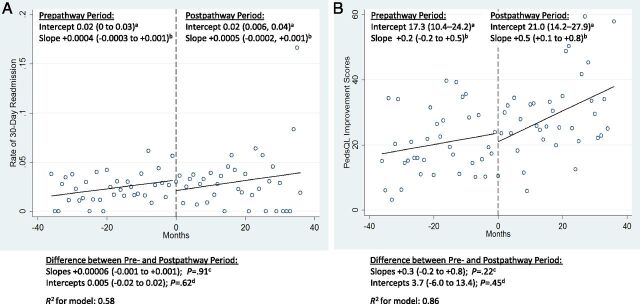
Results: There were 3808 and 2902 admissions in the pre- and postpathway groups, respectively. Compared with prepathway care, postpathway care was associated with a significant halt in rising costs (prepathway vs postpathway slope difference -$155 per month [95% confidence interval -$246 to -$64]; P = .001) and significantly decreased length of stay (prepathway vs post-pathway slope difference -0.03 days per month [95% confidence interval -0.05 to -0.02]; P = .02), without negatively affecting patient physical functioning improvement or readmissions.
Conclusions: Implementation of multiple evidence-based, standardized clinical pathways was associated with decreased resource utilization without negatively affecting patient physical functioning improvement. This approach could be widely implemented to improve the value of care provided.
Copyright © 2016 by the American Academy of Pediatrics.
Conflict of interest statement
Figures
Comment in
-
The Impact of Continuous Quality Improvement on a System's Healthcare Costs.Pediatrics. 2016 Apr;137(4):e20154164. doi: 10.1542/peds.2015-4164. Epub 2016 Mar 21. Pediatrics. 2016. PMID: 27002008 No abstract available.
Similar articles
-
Bedside chest radiography as part of a postcardiac surgery critical care pathway: a means of decreasing utilization without adverse clinical impact.Crit Care Med. 2000 Feb;28(2):383-8. doi: 10.1097/00003246-200002000-00016. Crit Care Med. 2000. PMID: 10708171
-
Effects of a PICU Status Asthmaticus De-Escalation Pathway on Length of Stay and Albuterol Use.Pediatr Crit Care Med. 2018 Jul;19(7):658-664. doi: 10.1097/PCC.0000000000001551. Pediatr Crit Care Med. 2018. PMID: 29664873
-
Are critical pathways effective for reducing postoperative length of stay?Med Care. 2003 May;41(5):637-48. doi: 10.1097/01.MLR.0000062552.92534.BE. Med Care. 2003. PMID: 12719688
-
Effects of a pneumonia clinical pathway on time to antibiotic treatment, length of stay, and mortality.Acad Emerg Med. 1999 Dec;6(12):1243-8. doi: 10.1111/j.1553-2712.1999.tb00140.x. Acad Emerg Med. 1999. PMID: 10609926
-
A clinical pathway to minimize computed tomography for suspected nephrolithiasis in children.J Pediatr Urol. 2019 Oct;15(5):518.e1-518.e7. doi: 10.1016/j.jpurol.2019.06.014. Epub 2019 Jun 26. J Pediatr Urol. 2019. PMID: 31326330
Cited by
-
Simultaneously implementing pathways for improving asthma, pneumonia, and bronchiolitis care for hospitalized children: Protocol for a hybrid effectiveness-implementation, cluster-randomized trial.J Hosp Med. 2024 Dec;19(12):1203-1210. doi: 10.1002/jhm.13482. Epub 2024 Aug 14. J Hosp Med. 2024. PMID: 39139049 Free PMC article.
-
Clinical indicators for common paediatric conditions: Processes, provenance and products of the CareTrack Kids study.PLoS One. 2019 Jan 9;14(1):e0209637. doi: 10.1371/journal.pone.0209637. eCollection 2019. PLoS One. 2019. PMID: 30625190 Free PMC article.
-
The Effect of Implementation of Guideline Order Bundles Into a General Admission Order Set on Clinical Practice Guideline Adoption: Quasi-Experimental Study.JMIR Med Inform. 2023 Mar 21;11:e42736. doi: 10.2196/42736. JMIR Med Inform. 2023. PMID: 36943348 Free PMC article.
-
Improving Care for Children with Bloody Diarrhea at Risk for Hemolytic Uremic Syndrome.Pediatr Qual Saf. 2022 Jan 21;7(1):e517. doi: 10.1097/pq9.0000000000000517. eCollection 2022 Jan-Feb. Pediatr Qual Saf. 2022. PMID: 35071957 Free PMC article.
-
Costs of Care for Hospitalized Children Associated With Preferred Language and Insurance Type.Hosp Pediatr. 2017 Feb;7(2):70-78. doi: 10.1542/hpeds.2016-0051. Epub 2017 Jan 10. Hosp Pediatr. 2017. PMID: 28073815 Free PMC article.
References
-
- Kimberly J, de Pourourville G, d’Aunno T. The Globalization of Managerial Innovation in Health Care. Cambridge, UK: Cambridge University Press; 2009
-
- Saint S, Hofer TP, Rose JS, Kaufman SR, McMahon LF Jr. Use of critical pathways to improve efficiency: a cautionary tale. Am J Manag Care. 2003;9(11):758–765 - PubMed
-
- Rotter T, Kinsman L, James E, et al. . Clinical pathways: effects on professional practice, patient outcomes, length of stay and hospital costs. Cochrane Database Syst Rev. 2010;(3):CD006632. - PubMed
Publication types
MeSH terms
Grants and funding
LinkOut - more resources
Full Text Sources
Other Literature Sources
Medical
