. 2016 Apr;28(4):875-91.
doi: 10.1105/tpc.15.01053. Epub 2016 Mar 21.

Three-Dimensional Visualization of the Tubular-Lamellar Transformation of the Internal Plastid Membrane Network during Runner Bean Chloroplast Biogenesis

Affiliations

Three-Dimensional Visualization of the Tubular-Lamellar Transformation of the Internal Plastid Membrane Network during Runner Bean Chloroplast Biogenesis

Łucja Kowalewska et al. Plant Cell. 2016 Apr.

Abstract

Chloroplast biogenesis is a complex process that is integrated with plant development, leading to fully differentiated and functionally mature plastids. In this work, we used electron tomography and confocal microscopy to reconstruct the process of structural membrane transformation during the etioplast-to-chloroplast transition in runner bean (Phaseolus coccineus). During chloroplast development, the regular tubular network of paracrystalline prolamellar bodies (PLBs) and the flattened porous membranes of prothylakoids develop into the chloroplast thylakoids. Three-dimensional reconstruction is required to provide us with a more complete understanding of this transformation. We provide spatial models of the bean chloroplast biogenesis that allow such reconstruction of the internal membranes of the developing chloroplast and visualize the transformation from the tubular arrangement to the linear system of parallel lamellae. We prove that the tubular structure of the PLB transforms directly to flat slats, without dispersion to vesicles. We demonstrate that the grana/stroma thylakoid connections have a helical character starting from the early stages of appressed membrane formation. Moreover, we point out the importance of particular chlorophyll-protein complex components in the membrane stacking during the biogenesis. The main stages of chloroplast internal membrane biogenesis are presented in a movie that shows the time development of the chloroplast biogenesis as a dynamic model of this process.


Figures

Figure 1.
Figure 1.
Model of the Paracrystalline Tubular Structure of a PLB after 8 d of Etiolation (Stage 1.0). (A) Middle layer of the tomography stack. (B) Volume of the 3D reconstructed PLB. (C) and (D) Isosurface visualization with magnification, showing a regular paracrystalline network. The image in (D) shows a magnification of the light-colored surface area in (C). (E) Isosurface view of a single PLB unit (orange). (F) and (G) Magnification of a PLB unit viewed from two different angles (orange). (H) Theoretical model of a single layer of the PLB network (3ds max). Bars = 250 nm
Figure 2.
Figure 2.
Model of the PLB Irregular Structure after 1 h of Illumination (Stage 1.1). (A) Middle layer of the tomography stack. (B) Volume of the 3D reconstructed irregular PLB. (C) and (D) Isosurface visualization with magnification. Note the lamellar character of porous (arrowheads) prothylakoids at the PLB edges. The image in (D) shows a magnification of the part of the light-colored surface area in (C). (E) to (H) Magnification of the irregular PLB network viewed from four different angles showing a portion of a degraded PLB unit (lime green) forming sheet-like structures (SLS). Bars = 500 nm
Figure 3.
Figure 3.
Model of Degraded PLB Structure with Numerous PTs in Plastid Stroma after 2 h of Illumination (Stage 1.2). (A) Middle layer of the tomography stack. (B) Magnification of the modeled region (blue) (C) and (D) Surface model (blue) embedded in the middle TEM layer viewed from two different angles. (E) to (G) Surface visualization from three different angles showing the radial arrangement of porous (arrowheads) prothylakoid structures. Bars = 200 nm
Figure 4.
Figure 4.
Model of PTs Loosely Arranged in Plastid Stroma after 4 h of Illumination (Stage 1.4). (A) Middle layer of the tomography stack. (B) Magnification of the modeled region (purple). (C) and (D) Surface model (purple) embedded in the middle TEM layer viewed from two different angles. (E) to (G) Surface visualization from three different angles showing parallel porous (arrowheads) prothylakoid structures, with a locally visible dichotomous split of a prothylakoid (asterisk). Bars = 200 nm
Figure 5.
Figure 5.
Model of the First Stacked Membranes after 8 h of Illumination (Stage 1.8). (A) Middle layer of the tomography stack. (B) Magnification of the modeled region (yellow). (C) and (D) Surface model embedded in the selected TEM layer viewed from two different angles. (E) to (H) Surface visualization from four different angles showing three layers of a nonporous thylakoid stack (light yellow) and associated porous (arrowhead) prothylakoid membrane (yellow) connected with the stacked region at an angle in the range of 18° to 33° with a locally visible splitting of a prothylakoid (asterisk). All bars = 250 nm
Figure 6.
Figure 6.
Model of Small Grana at the Beginning of the Second Day of the Experiment (Stage 2.0). (A) Middle layer of the tomography stack. (B) Magnification of the modeled region (green). (C) and (D) Surface model embedded in the selected TEM layer viewed from two different angles. (E) to (I) Surface visualization from five different angles showing five grana thylakoid layers (light green) arranged in parallel. These grana are directly connected with three nonporous stroma thylakoids (green). The stroma thylakoids are connected with a stacked region at an angle of ∼20°. Bars = 200 nm
Figure 7.
Figure 7.
Model of More Developed Grana Visible during the Third Day of Day/Night Growth (Stage 3.3). (A) Middle layer of the tomography stack. (B) Magnification of the modeled region (green). (C) and (D) Surface model embedded in the selected TEM layer viewed from two different angles. (E) to (I) Surface visualization from five different angles showing a very regular parallel arrangement of grana thylakoid layers (light navy) associated with six stroma thylakoids (navy). (F) Splitting of the bottom stroma thylakoid (star). (G) Stroma thylakoids are connected with two neighboring grana thylakoids at an angle of ∼18°. (H) and (I) A particular stroma thylakoid is split in two and connected with the adjacent grana thylakoid (H) and with the next grana thylakoid in another slice (I), as shown inside the small white rectangles. Bars = 200 nm
Figure 8.
Figure 8.
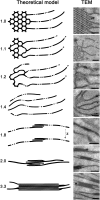
Theoretical 2D Models of Subsequent Stages of Inner Chloroplast Membrane Transformations. Membrane transformations during the etioplast-chloroplast transition induced by illumination, with the corresponding developmental stages illustrated (left panels) and visualized by TEM (right panels). The theoretical models show membrane connections at a selected depth on the z axis of the chloroplast volume. Bars = 200 nm.
Figure 9.
Figure 9.
Analysis of CP Complexes during the Biogenesis of Chloroplasts. (A) Low-temperature (77K) fluorescence emission spectra (excitation at 440 nm) of isolated intact bean etioplasts and developing chloroplasts from subsequent developmental stages as shown in the key at upper right. (B) and (C) Low-temperature (77K) fluorescence excitation spectra obtained from emission at 653 nm (stage 1.0), 680 nm (stage 1.1), or 683 nm (stages 1.2 to 3.3) (line styles are the same as in [A]). (D) Mild denaturing green gel electrophoresis of CP complexes. (E) Immunodetection analysis of PSII core (D1, D2, CP43, and CP47) and extrinsic antenna (Lhcb1 and Lhcb2) proteins. All measurements were repeated at least three times; all spectra presented were normalized to equal area under the curve.

Comment in

Similar articles

Cited by

References

    1. Abdelkader A.F., Aronsson H., Solymosi K., Böddi B., Sundqvist C. (2007). High salt stress induces swollen prothylakoids in dark-grown wheat and alters both prolamellar body transformation and reformation after irradiation. J. Exp. Bot. 58: 2553–2564. - PubMed
    1. Abramoff M.D., Magalhaes P.J., Ram S.J. (2004). Image processing with ImageJ. Biophotonics International. 11: 36–42.
    1. Adam Z., Charuvi D., Tsabari O., Knopf R.R., Reich Z. (2011). Biogenesis of thylakoid networks in angiosperms: knowns and unknowns. Plant Mol. Biol. 76: 221–234. - PubMed
    1. Almsherqi Z.A., Kohlwein S.D., Deng Y. (2006). Cubic membranes: a legend beyond the Flatland* of cell membrane organization. J. Cell Biol. 173: 839–844. - PMC - PubMed
    1. Almsherqi Z.A., Landh T., Kohlwein S.D., Deng Y. (2009). Chapter 6: cubic membranes the missing dimension of cell membrane organization. Int. Rev. Cell Mol. Biol. 274: 275–342. - PMC - PubMed

Publication types

MeSH terms