

Leptin Resistance Contributes to Obesity in Mice with Null Mutation of Carcinoembryonic Antigen-related Cell Adhesion Molecule 1
- PMID: 27002145
- PMCID: PMC4900262
- DOI: 10.1074/jbc.M116.716431
Leptin Resistance Contributes to Obesity in Mice with Null Mutation of Carcinoembryonic Antigen-related Cell Adhesion Molecule 1
Abstract
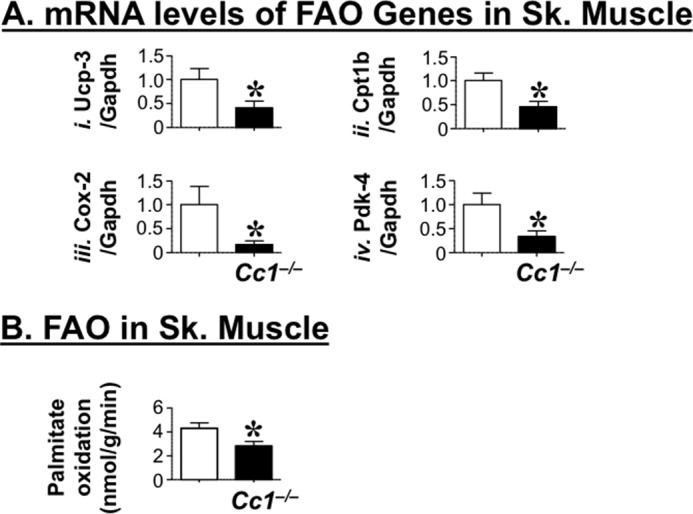
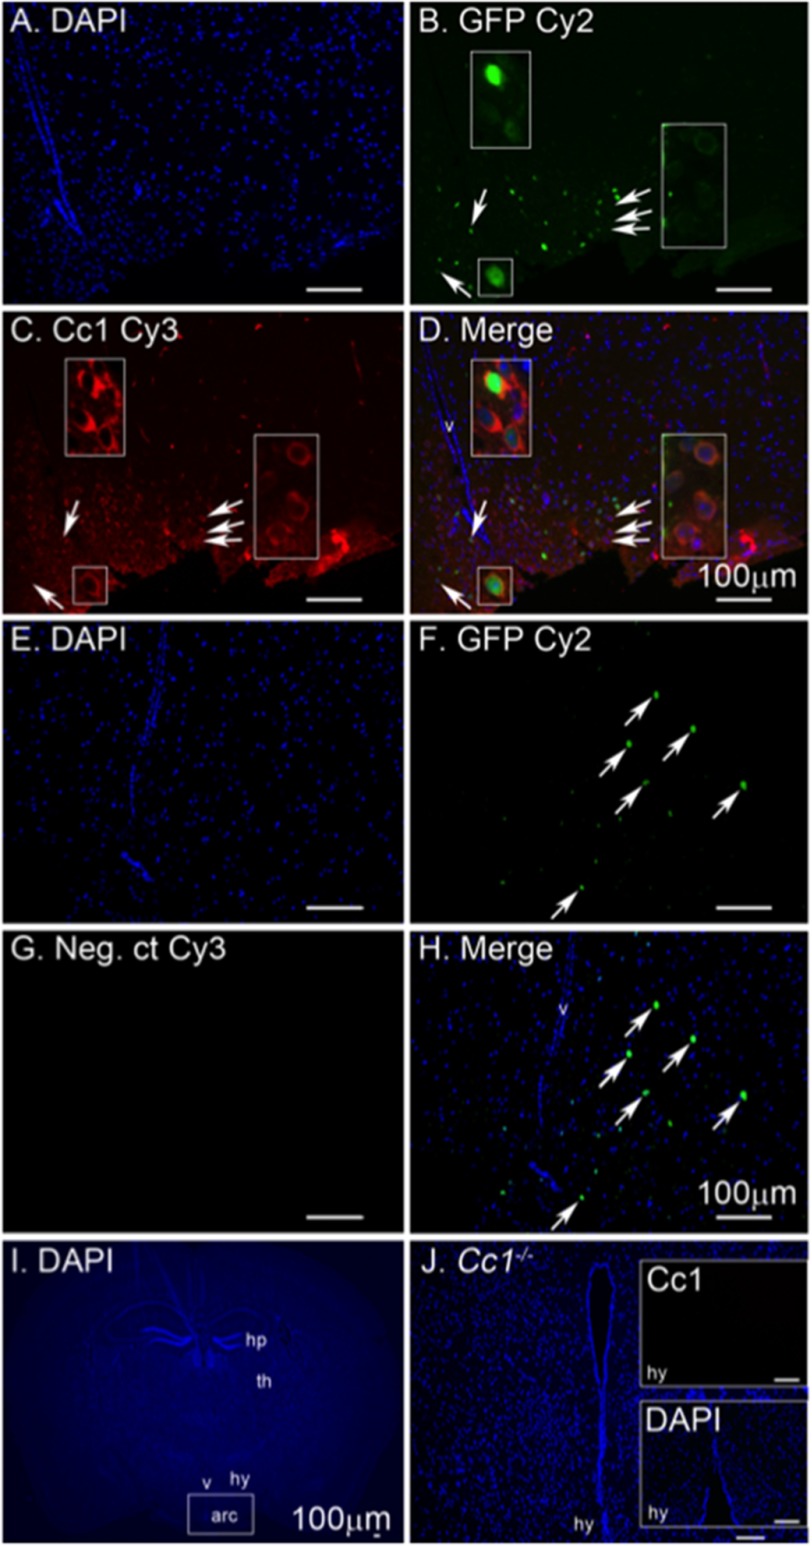
Carcinoembryonic antigen-related cell adhesion molecule 1 (CEACAM1) promotes hepatic insulin clearance. Consistently, mice with null mutation of Ceacam1 (Cc1(-/-)) exhibit impaired insulin clearance with increased lipid production in liver and redistribution to white adipose tissue, leading to visceral obesity at 2 months of age. When the mutation is propagated on the C57/BL6J genetic background, total fat mass rises significantly with age, and glucose intolerance and systemic insulin resistance develop at 6 months of age. This study was carried out to determine the mechanisms underlying the marked increase in total fat mass in 6-month-old mutants. Indirect calorimetry analysis showed that Cc1(-/-) mice develop hyperphagia and a significant reduction in physical activity, in particular in the early hours of the dark cycle, during which energy expenditure is only slightly lower than in wild-type mice. They also exhibit increased triglyceride accumulation in skeletal muscle, due in part to incomplete fatty acid β-oxidation. Mechanistically, hypothalamic leptin signaling is reduced, as demonstrated by blunted STAT3 phosphorylation in coronal sections in response to an intracerebral ventricular injection of leptin. Hypothalamic fatty-acid synthase activity is also elevated in the mutants. Together, the data show that the increase in total fat mass in Cc1(-/-) mice is mainly attributed to hyperphagia and reduced spontaneous physical activity. Although the contribution of the loss of CEACAM1 from anorexigenic proopiomelanocortin neurons in the arcuate nucleus is unclear, leptin resistance and elevated hypothalamic fatty-acid synthase activity could underlie altered energy balance in these mice.
Keywords: CEACAM1; Energy homeostasis; fatty acid oxidation; fatty-acid synthase (FAS); hyperleptinemia; hyperphagia; insulin resistance; leptin; leptin resistance NIH [, and (to S.M. Najjar), (to J.W. Hill) and; nuclear magnetic resonance (NMR).
© 2016 by The American Society for Biochemistry and Molecular Biology, Inc.
Figures


Similar articles
-
Hyperinsulinemia drives hepatic insulin resistance in male mice with liver-specific Ceacam1 deletion independently of lipolysis.Metabolism. 2019 Apr;93:33-43. doi: 10.1016/j.metabol.2019.01.008. Epub 2019 Jan 19. Metabolism. 2019. PMID: 30664851 Free PMC article.
-
Carcinoembryonic antigen-related cell adhesion molecule 2 controls energy balance and peripheral insulin action in mice.Gastroenterology. 2010 Aug;139(2):644-52, 652.e1. doi: 10.1053/j.gastro.2010.03.056. Epub 2010 Apr 8. Gastroenterology. 2010. PMID: 20381490 Free PMC article.
-
Liver-specific reconstitution of CEACAM1 reverses the metabolic abnormalities caused by its global deletion in male mice.Diabetologia. 2017 Dec;60(12):2463-2474. doi: 10.1007/s00125-017-4432-y. Epub 2017 Sep 14. Diabetologia. 2017. PMID: 28913658 Free PMC article.
-
Loss of Hepatic CEACAM1: A Unifying Mechanism Linking Insulin Resistance to Obesity and Non-Alcoholic Fatty Liver Disease.Front Endocrinol (Lausanne). 2017 Jan 26;8:8. doi: 10.3389/fendo.2017.00008. eCollection 2017. Front Endocrinol (Lausanne). 2017. PMID: 28184213 Free PMC article. Review.
-
The response of skeletal muscle to leptin.Front Biosci. 2001 Jan 1;6:D90-7. doi: 10.2741/ceddia. Front Biosci. 2001. PMID: 11145919 Review.
Cited by
-
Comparative analysis of leptin and carcinoembryonic antigen-related cell adhesion molecule 1 plasma expression in pancreatic cancer and chronic pancreatitis patients.Heliyon. 2024 Sep 4;10(17):e37410. doi: 10.1016/j.heliyon.2024.e37410. eCollection 2024 Sep 15. Heliyon. 2024. PMID: 39296050 Free PMC article.
-
Molecular Pathogenesis of NASH.Int J Mol Sci. 2016 Sep 20;17(9):1575. doi: 10.3390/ijms17091575. Int J Mol Sci. 2016. PMID: 27657051 Free PMC article. Review.
-
Carcinoembryonic Cell Adhesion-Related Molecule 2 Regulates Insulin Secretion and Energy Balance.Int J Mol Sci. 2019 Jul 1;20(13):3231. doi: 10.3390/ijms20133231. Int J Mol Sci. 2019. PMID: 31266142 Free PMC article. Review.
-
Insulin sensing by astrocytes is critical for normal thermogenesis and body temperature regulation.J Endocrinol. 2020 Oct;247(1):39-52. doi: 10.1530/JOE-20-0052. J Endocrinol. 2020. PMID: 32698146 Free PMC article.
-
CEACAM1 as a multi-purpose target for cancer immunotherapy.Oncoimmunology. 2017 May 16;6(7):e1328336. doi: 10.1080/2162402X.2017.1328336. eCollection 2017. Oncoimmunology. 2017. PMID: 28811966 Free PMC article. Review.
References
-
- Halaas J. L., Gajiwala K. S., Maffei M., Cohen S. L., Chait B. T., Rabinowitz D., Lallone R. L., Burley S. K., and Friedman J. M. (1995) Weight-reducing effects of the plasma protein encoded by the obese gene. Science 269, 543–546 - PubMed
-
- Bates S. H., Stearns W. H., Dundon T. A., Schubert M., Tso A. W., Wang Y., Banks A. S., Lavery H. J., Haq A. K., Maratos-Flier E., Neel B. G., Schwartz M. W., and Myers M. G. Jr. (2003) STAT3 signalling is required for leptin regulation of energy balance but not reproduction. Nature 421, 856–859 - PubMed
Publication types
MeSH terms
Substances
Grants and funding
LinkOut - more resources
Full Text Sources
Other Literature Sources
Medical
Molecular Biology Databases
Research Materials
Miscellaneous
