. 2016 May 20;291(21):11198-215.
doi: 10.1074/jbc.M115.707653. Epub 2016 Mar 21.

Scabin, a Novel DNA-acting ADP-ribosyltransferase from Streptomyces scabies

Affiliations

Scabin, a Novel DNA-acting ADP-ribosyltransferase from Streptomyces scabies

Bronwyn Lyons et al. J Biol Chem. .

Abstract

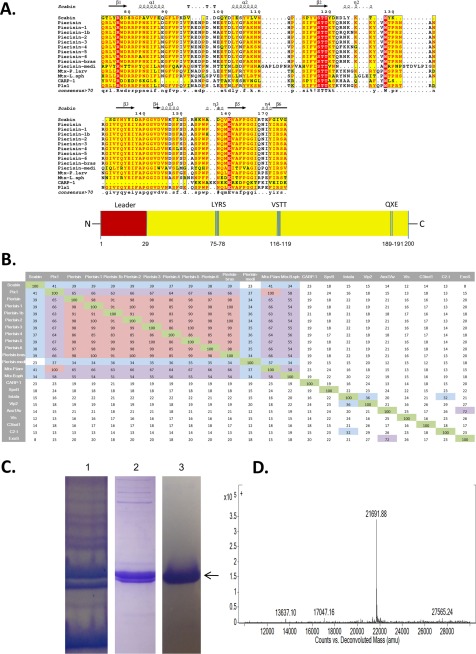
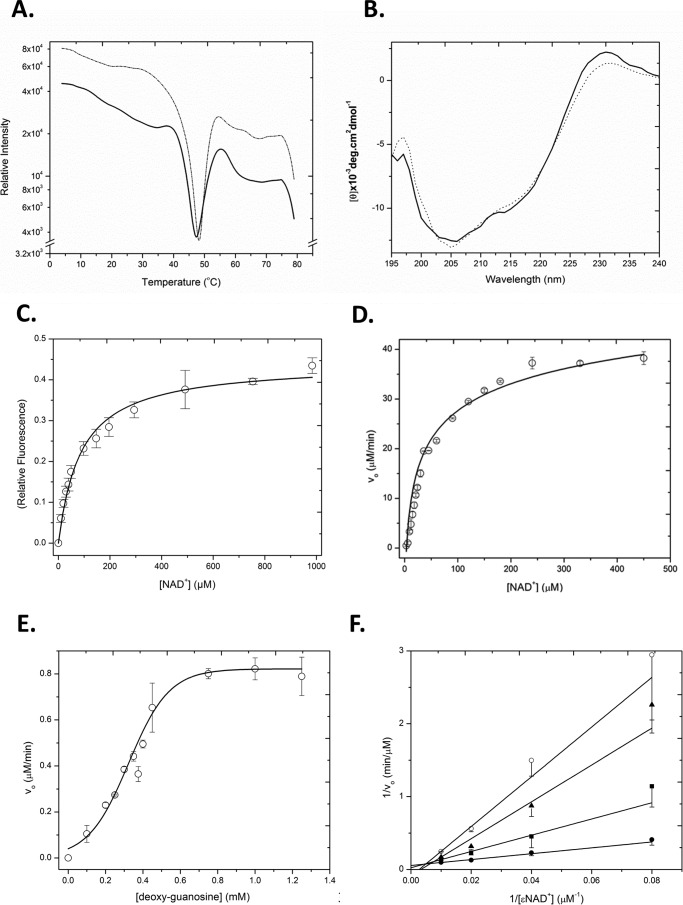
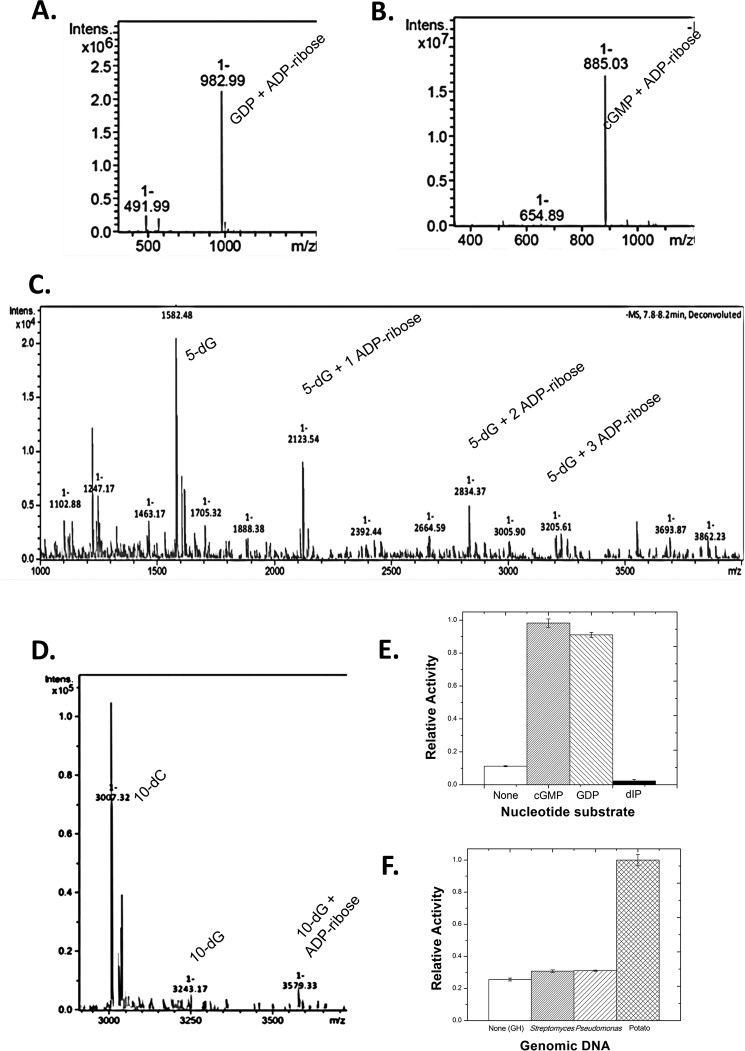
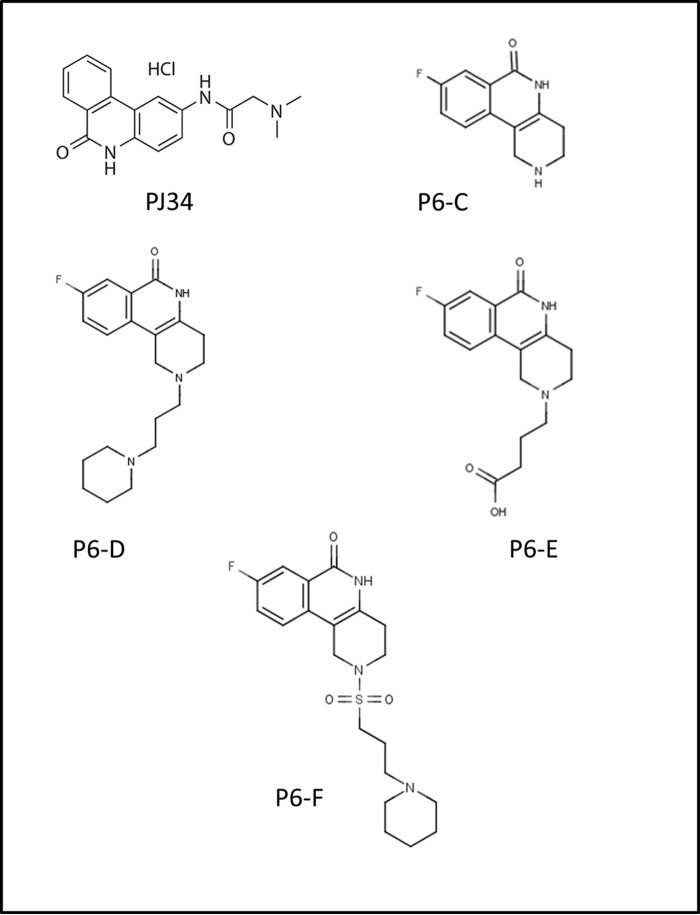
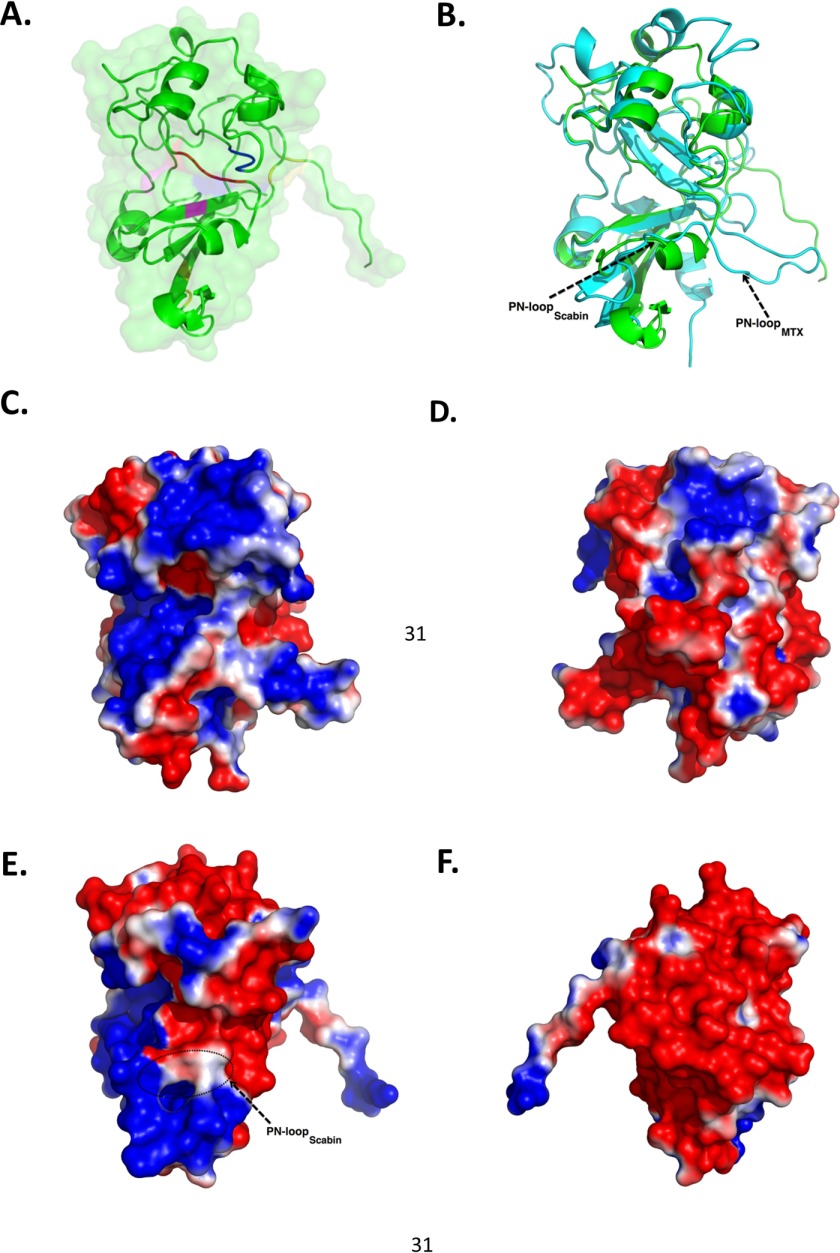
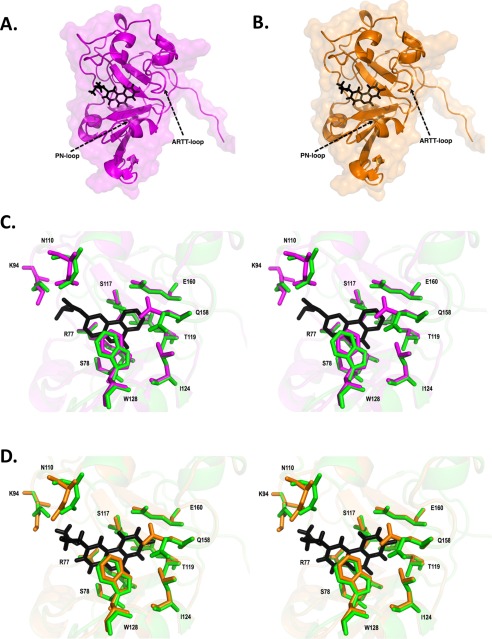
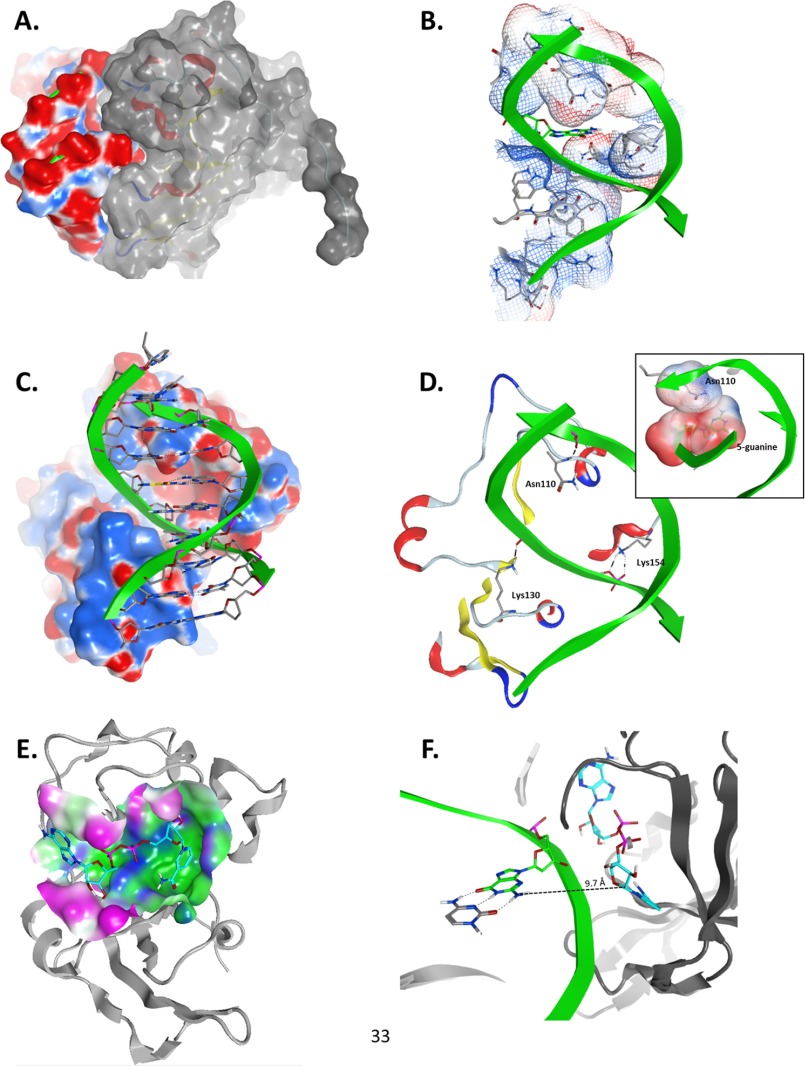
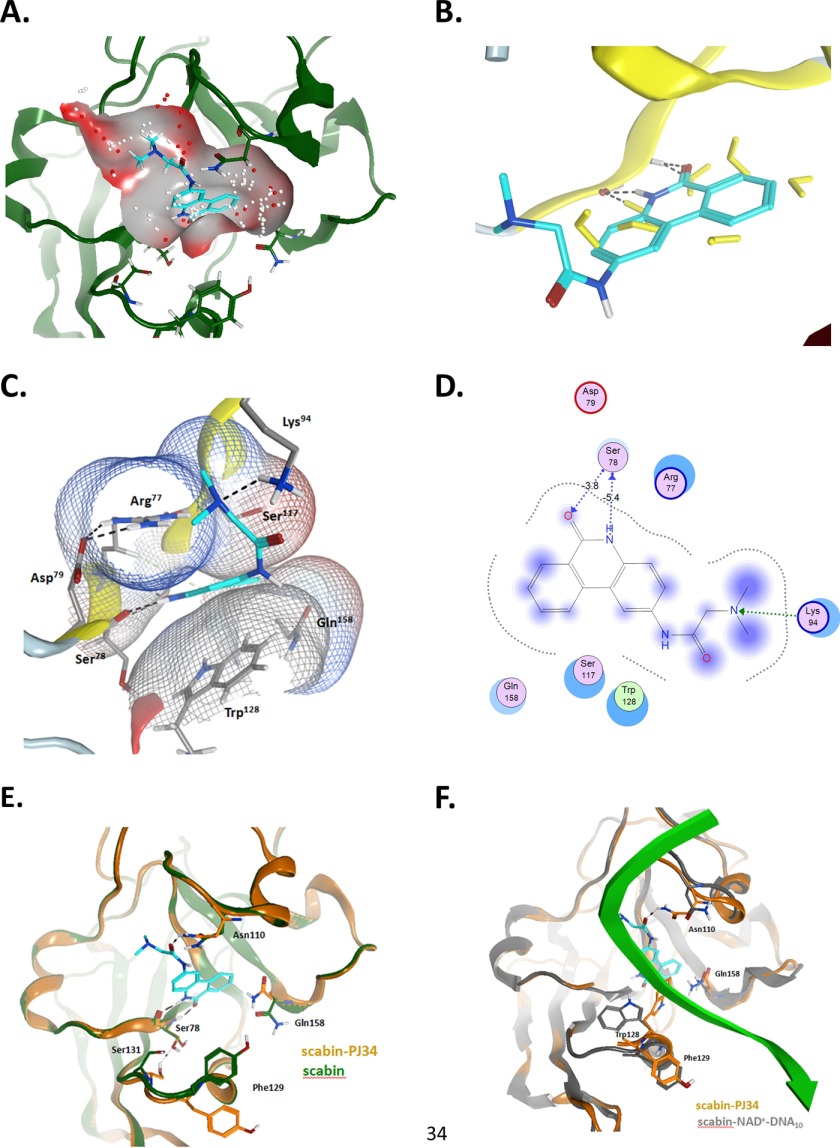
A bioinformatics strategy was used to identify Scabin, a novel DNA-targeting enzyme from the plant pathogen 87.22 strain of Streptomyces scabies Scabin shares nearly 40% sequence identity with the Pierisin family of mono-ADP-ribosyltransferase toxins. Scabin was purified to homogeneity as a 22-kDa single-domain enzyme and was shown to possess high NAD(+)-glycohydrolase (Km (NAD) = 68 ± 3 μm; kcat = 94 ± 2 min(-1)) activity with an RSQXE motif; it was also shown to target deoxyguanosine and showed sigmoidal enzyme kinetics (K0.5(deoxyguanosine) = 302 ± 12 μm; kcat = 14 min(-1)). Mass spectrometry analysis revealed that Scabin labels the exocyclic amino group on guanine bases in either single-stranded or double-stranded DNA. Several small molecule inhibitors were identified, and the most potent compounds were found to inhibit the enzyme activity with Ki values ranging from 3 to 24 μm PJ34, a well known inhibitor of poly-ADP-ribosyltransferases, was shown to be the most potent inhibitor of Scabin. Scabin was crystallized, representing the first structure of a DNA-targeting mono-ADP-ribosyltransferase enzyme; the structures of the apo-form (1.45 Å) and with two inhibitors (P6-E, 1.4 Å; PJ34, 1.6 Å) were solved. These x-ray structures are also the first high resolution structures of the Pierisin subgroup of the mono-ADP-ribosyltransferase toxin family. A model of Scabin with its DNA substrate is also proposed.

Keywords: DNA binding protein; bacterial toxin; bioinformatics; crystallography; enzyme kinetics; fluorescence; molecular modeling.


Figures

FIGURE 1.
FIGURE 1.
Multiple-sequence alignment of Scabin with various Pierisin-like mART toxins. A, sequence alignment of Scabin with some Pierisin-like toxins produced using the T-Coffee Web server to align the sequences and ESPript to generate the alignment figure (45). Key catalytic regions are highlighted. Identical residues are highlighted in red, and similar residues are printed in red type. B, identity matrix showing the amino acid identity between the 100 core catalytic residues of the known ExoS-like, C2-like toxins and Vis. Salmon, highly diverse sequences; light green, a large amount of conservation; yellow, an intermediate level of conservation between sequences. The identity matrix was generated using ClustalX2 (33) and colored using Microsoft Excel. C, purification and identification of Scabin from E. coli lysate. SDS-polyacrylamide gels showing the protein banding pattern for crude lysate (lane 1), immobilized metal affinity chromatography purification (lane 2), and FPLC ion exchange chromatography (lane 3). The arrow indicates the position of the Scabin protein. D, Q-TOF mass analysis of purified Scabin protein showing a single peak at 21,691.9 Da, corresponding to the expected mass of recombinant Scabin.
FIGURE 2.
FIGURE 2.
A, folded stability (Tm) of WT Scabin (thick line) and Scabin Q158A/E160A variant (thin dotted line) as measured by the SYPRO Orange thermal shift assay (derivative of the raw data traces). The traces are representative scans of three replicates for each sample, and the apex of the minima shows the position of the Tm, where the protein is half-unfolded. B, CD spectra of Scabin WT (thick line) and Q158A/E160A variant (thin dotted line) in 20 mm Tris, 50 mm NaF, pH 8.2, buffer. The concentrations of the proteins were both at 0.16 mg/ml, and each spectrum is the average of nine independent spectra. C, NAD+ binding by Scabin. The binding isotherm for NAD+ with 1.25 μm Scabin was determined by quenching of the intrinsic protein fluorescence. The raw fluorescence quenching data were converted to relative values and are plotted against the NAD+ concentration. The excitation was 295 nm, and the emission was 340 nm with excitation and emission band passes at 5 nm in 25 mm Tris-HCl, 50 mm NaCl, pH 8.2, buffer. D, GH activity of Scabin WT showing the hydrolysis rate of the NAD+ substrate by the protein (Scabin, 490 nm; ϵ-NAD+, 0–450 μm. Error bars, S.D. E, ADP-ribosyltransferase activity of WT Scabin. ϵ-NAD+ was held at a concentration of 250 μm and was mixed with 10 nm Scabin and buffer containing 1% dimethyl sulfoxide and various concentrations of dG (0–1250 μm). Error bars, S.D. F, inhibition plot of Scabin GH activity. Shown are Lineweaver-Burk plots for Scabin in the presence of various concentrations of inhibitor PJ34. The GH activity of Scabin was measured with 0 (filled circles), 6 μm (filled squares), 12 μm (filled triangles), and 24 μm (open circles). Vo indicates initial velocity in μm/min. Error bars, S.D.
FIGURE 3.
FIGURE 3.
Mass spectrometry of Scabin with oligonucleotide substrates. A, product ion spectra (singly charged, positive mode) after liquid chromatographic separation of the reaction products from the incubation of Scabin with 0.5 mm GDP. B, product ion spectra (singly charged, positive mode) after liquid chromatographic separation of the reaction products from the incubation of Scabin with 0.5 mm cGMP. C, product ion spectra (singly charged, positive mode) after liquid chromatographic separation of the reaction products from the incubation of Scabin with annealed poly(5)-deoxyguanidine/deoxycytidine oligonucleotide. Peaks corresponding to unlabeled (1582.5 Da), singly labeled (2123.5 Da), doubly labeled (2834.4 Da), and triply labeled (3205.6 Da) oligonucleotide were clearly resolved. D, product ion spectra (singly charged, positive mode) after liquid chromatographic separation of the reaction products from the reaction of Scabin with annealed poly(10)-deoxyguanidine/deoxycytidine oligonucleotide. Peaks corresponding to unlabeled (3038.6 Da) and singly labeled (3579.3 Da) oligonucleotide are shown. E, histogram showing the relative activity of Scabin against the following substrates: none (baseline GH activity only), cGMP, GDP, and 2′-deoxyinosine-5′-monophosphate at 1 mm concentrations in GH buffer. F, histogram showing the relative transferase activity of Scabin against genomic DNA from the following organisms: none (GH background activity), S. scabies, P. aeruginosa, and Solanum tuberosum (potato).
FIGURE 4.
FIGURE 4.
P-series inhibitors effective against Scabin GH activity. PJ34, 2-[[3-(dimethylamino)-2-oxopropyl]amino]-5,6-dihydrophenanthridin-6-one; P6-C, 8-fluoro-1H,2H,3H,4H,5H,6H-benzo[c]1,6-naphthyridin-6-one; P6-D, 8-fluoro-2-[3-(piperidin-1-yl)propyl]-1H,2H,3H,4H,5H,6H-benzo[c]1,6-naphthyridin-6-one; P6-E, 4-[8-fluoro-6-oxo-1H,2H,3H,4H,5H,6H-benzo[c]1,6-naphthyridin-2-yl]butanoic acid; P6-F, 8-fluoro-2-[3-(piperidin-1-yl)propanesulfonyl]-1H,2H,3H,4H,5H,6H-benzo[c]1,6-naphthyridin-6-one.
FIGURE 5.
FIGURE 5.
Scabin-apo crystal structures. A, close-up of the Scabin-apo crystal structure shown as a ribbon diagram. Catalytic residues Gln158 and Glu160 are colored blue. Other important residues in the reaction mechanism, Arg77 (pink) and STS motif (red), are also highlighted. Disulfide bridges are colored yellow. B, structural comparison of Scabin-apo (green) and the catalytic domain of the MTX toxin structure (cyan) based on an iterative, three-dimensional alignment of protein backbone Cα atoms using PyMOL. C, surface potential of the catalytic subunit of MTX (front view). Molecular surfaces are colored by the relative electrostatic potential (red, negative or acidic; blue, basic or positive). Surface potentials were calculated using PyMOL APBS software. D, surface potential of the catalytic subunit of MTX toxin (back view). E, surface potential of Scabin-apo (side view). F, surface potential of Scabin-apo (opposite side view).
FIGURE 6.
FIGURE 6.
Scabin inhibitor crystal structures. A, Scabin·PJ34 complex structure shown as a ribbon diagram. PJ34 is colored black and represented in stick format. B, Scabin·P6-E complex structure shown as a ribbon diagram. P6-E is colored black and represented in stick format. C, stereo view of active site of Scabin·PJ34 complex structure (magenta) and Scabin-apo structure (green). PJ34 is colored black and represented in stick format. Structural differences among important catalytic residues (Arg77 Ser78, Lys94, Asn110, Ser117, Thr119, Leu124, Tyr128, Gln158, and Glu160) are highlighted. D, stereo view of active site of Scabin·P6-E complex structure (magenta) and Scabin-apo structure (green). P6-E is colored black and represented in stick format. Structural differences among important catalytic residues (Arg77 Ser78, Lys94, Asn110, Ser117, Thr119, Leu124, Tyr128, Gln158, and Glu160) are highlighted.
FIGURE 7.
FIGURE 7.
Model of the Scabinm·NAD+·dsDNA10 complex. Panels show details of the interaction between Scabin, NAD+, and the dsDNA10 molecules from the ternary complex generated by using the Scabin-apo structure as the template. A, Scabin-DNA shape complementarity; side view of the molecular surfaces of the modeled complex of Scabin (colored with gray surface) and the 10-mer dsDNA (colored according to the electrostatic potential; red, negative; blue, positive). B, DNA-binding cleft. Front view of the van der Waals interaction surface of the active conformation of Scabin, colored by the electrostatic potential. The 5-position guanine base is depicted in green carbon atoms, whereas the protein residues making DNA contact are shown in gray carbon atoms. C, Scabin-DNA electrostatic complementarity. Shown is a front view of the complex, depicting the DNA ribose and base atoms. The molecular surface of the Scabin is colored by the electrostatic potential. D, specific Scabin-DNA interactions. Details of the H-bond interactions between three active site loop residues (Asn110, Lys130, and Lys154) in the Scabin active conformation and the phosphate backbone of the dsDNA molecule are shown. Inset, contact between the van der Waals interaction surfaces of Asn110 and the 5-position guanine. E, NAD+-binding pocket. The molecular surface of Scabin around the binding pocket of NAD+ is colored according to its polar (blue), hydrophobic (green), or exposed (fuchsia) character. The bound NAD+ substrate is shown in cyan carbon atoms, and the backbone trace of Scabin is shown in light gray ribbons. F, distance and configuration of the reactive centers. A side view of the ternary complex showing the 5-position guanine (in green carbon atoms) of the dsDNA10 and the active conformation of NAD+ (in cyan carbon atoms) are shown in the ternary complex. The drawn segmented line connects the exo-cyclic amino nitrogen atom of the 5-position guanine with the C1′ atom of the NAD+ N-ribose with a separation distance of ∼9.7 Å. Figures were rendered by MOE.
FIGURE 8.
FIGURE 8.
The Scabin·PJ34 complex. Shown are details of the interaction between Scabin and the PJ34 inhibitor in the context of the apo-form and the modeled complexed with NAD+ and dDNA10. A, binding pocket on the Scabin-apo. The binding pocket was calculated based upon the x-ray coordinates of the Scabin-apo. The small dots correspond to the center of hydrophilic (red) and hydrophobic (white) α spheres into the N-site of the binding pocket. The PJ34 molecule was superposed for reference. B, binding of PJ34. Shown is the binding pose of PJ34 on the Scabin·PJ34 complex. The crystallographic waters are depicted in yellow from the Scabin-apo structure for reference. C, Scabin-PJ34 ligand interactions; van der Waals interaction surfaces (vdw-interaction surfaces) around pocket residues, colored by the electrostatic potential. D, two-dimensional ligand interactions. Shown is a two-dimensional depiction of the bound PJ34 and interacting residues. The arrows represent the H-bonds, with backbone atoms (blue) and side-chain atoms (green). The degree of exposure is shown by the purple sphere. E, pocket variation upon binding. Shown are pocket residues with major side-chain variation upon PJ34 binding. Depicted are ribbons and carbon atoms for Scabin (in green) and for Scabin·PJ34 complex (in orange). F, comparison between Scabin-bound forms. Shown is superposition of the Scabin·PJ34 complex (in orange ribbons and carbon atoms) and the modeled Scabinm·NAD+·dDNA10 complex (in gray ribbons and carbon atoms), with NAD+ not shown. The backbone of the inward facing DNA strand is shown in green. In all panels, PJ34 is shown as cyan carbon atoms. Figures were rendered by MOE.

References

    1. Yates S. P., Jørgensen R., Andersen G. R., and Merrill A. R. (2006) Stealth and mimicry by deadly bacterial toxins. Trends Biochem. Sci. 31, 123–133 - PubMed
    1. Holbourn K. P., Shone C. C., and Acharya K. R. (2006) A family of killer toxins: exploring the mechanism of ADP-ribosylating toxins. FEBS J. 273, 4579–4593 - PubMed
    1. Simon N. C., Aktories K., and Barbieri J. T. (2014) Novel bacterial ADP-ribosylating toxins: structure and function. Nat. Rev. Microbiol. 12, 599–611 - PMC - PubMed
    1. Watanabe M., Kono T., Matsushima-Hibiya Y., Kanazawa T., Nishisaka N., Kishimoto T., Koyama K., Sugimura T., and Wakabayashi K. (1999) Molecular cloning of an apoptosis-inducing protein, pierisin, from cabbage butterfly: possible involvement of ADP-ribosylation in its activity. Proc. Natl. Acad. Sci. U.S.A. 96, 10608–10613 - PMC - PubMed
    1. Krska D., Ravulapalli R., Fieldhouse R. J., Lugo M. R., and Merrill A. R. (2015) C3larvin toxin, an ADP-ribosyltransferase from Paenibacillus larvae. J. Biol. Chem. 290, 1639–1653 - PMC - PubMed

Publication types

MeSH terms