. 2016 Mar 22;11(3):e0151889.
doi: 10.1371/journal.pone.0151889. eCollection 2016.

Quantitative Three-Dimensional Imaging of Lipid, Protein, and Water Contents via X-Ray Phase-Contrast Tomography

Affiliations

Quantitative Three-Dimensional Imaging of Lipid, Protein, and Water Contents via X-Ray Phase-Contrast Tomography

Marian Willner et al. PLoS One. .

Abstract

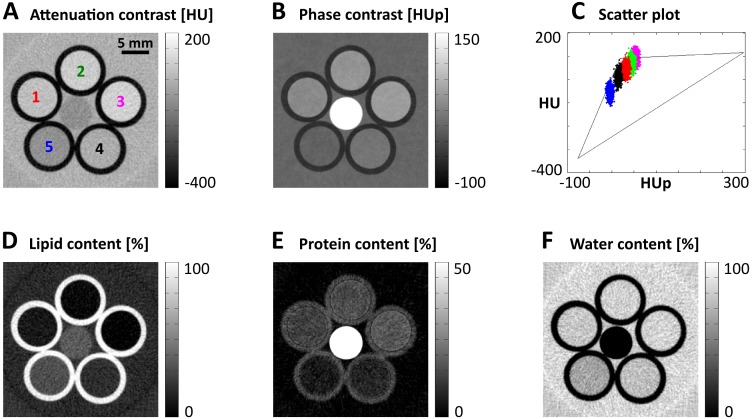
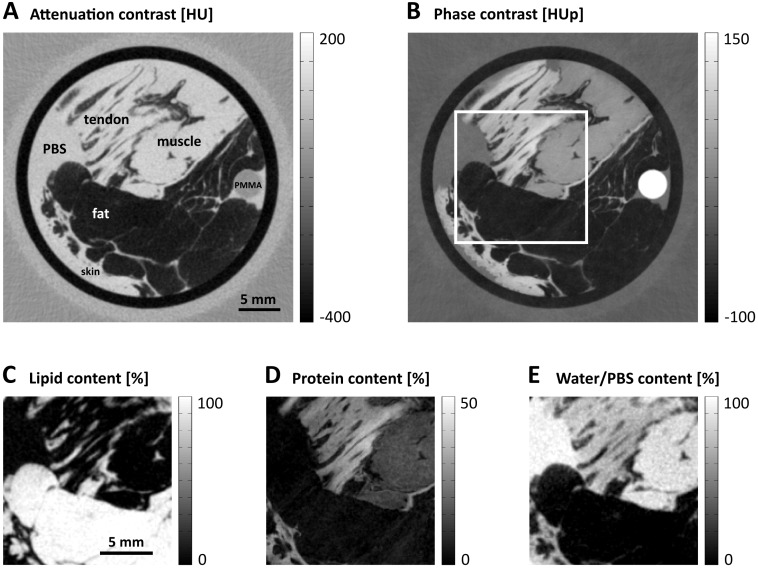
X-ray phase-contrast computed tomography is an emerging imaging technology with powerful capabilities for three-dimensional (3D) visualization of weakly absorbing objects such as biological soft tissues. This technique is an extension of existing X-ray applications because conventional attenuation-contrast images are simultaneously acquired. The complementary information provided by both the contrast modalities suggests that enhanced material characterization is possible when performing combined data analysis. In this study, we describe how protein, lipid, and water concentrations in each 3D voxel can be quantified by vector decomposition. Experimental results of dairy products, porcine fat and rind, and different human soft tissue types are presented. The results demonstrate the potential of phase-contrast imaging as a new analysis tool. The 3D representations of protein, lipid, and water contents open up new opportunities in the fields of biology, medicine, and food science.


Conflict of interest statement

Competing Interests: The authors have declared that no competing interests exist.

Figures

Fig 1
Fig 1. Concept illustration for three-dimensional (3D) characterization of lipid, protein, and water concentrations.
(A) Schematic drawing of the three-grating Talbot-Lau interferometer used for the measurements in this study. (B and C) Exemplary tomographic imaging results of a porcine fat and rind sample in attenuation and phase contrast, respectively. The obtained 3D datasets represent the distribution of the linear attenuation coefficient μ and the refractive index decrement δ within the object and can be converted to quantitative Hounsfield units (HU and HUp). (D) Theoretically calculated HU and HUp values for fictive mixtures of varying protein and lipid concentrations. The results span a triangle, and every (experimentally evaluated) HU-HUp-pair can be assigned to exactly one specific protein and lipid content.
Fig 2
Fig 2. Results from a test phantom consisting of the various dairy products listed in Table 1.
(A and B) Exemplary tomographic attenuation-contrast and phase-contrast images, respectively, displaying the five vials filled with dairy products (1–3: cream cheese, 4 and 5: sour cream) circularly arranged around a polymethylmethacrylate rod. (C) The quantitative HU and HUp values of each dairy product arranged around a certain point in the corresponding HU-HUp-scatterplot according to its protein and lipid content. (D–F) Images reflecting the lipid, protein, and water contents of the dairy products generated by the vector decomposition of the attenuation-contrast and phase-contrast data.
Fig 3
Fig 3. Vector decomposition of biological soft tissues using the example of porcine fat and rind.
(A and B) Tomographic attenuation-contrast and phase-contrast imaging results, respectively, of a section covering rind, fat, and muscle. (C) Values of the regions-of-interest marked in the different tissue types are clearly separated in the HU-HUp-scatterplot. (D–F) Decomposed lipid, protein, and water images reveal the high lipid content of the fat, the increased protein (collagen) content in the rind, and the high water concentration of the muscle.
Fig 4
Fig 4. Lipid, protein, and water analysis of different human soft tissue types.
(A and B) Axial tomographic slices in attenuation and phase contrast, respectively, through the measured plastic cylinder containing tendon, muscle, fat, and skin tissues. (C–E) Decomposed images of the region marked by the white box in (B).

References

    1. O’Sullivan A, O’Connor B, Kelly A, McGrath M (1999) The use of chemical and infrared methods for analysis of milk and dairy products. Int J Dairy Technol 52(4):139–148. 10.1111/j.1471-0307.1999.tb02856.x - DOI
    1. Colmenero F, Barreto G, Mota N, Carballo J (1995) Influence of protein and ft content and cooking temperature on texture and sensory evaluation of bologna sausages. Lebensm Wiss Technol 28(5):481–487. 10.1006/fstl.1995.0081 - DOI
    1. Wu M, Xiong Y, Chen J, Tang X, Zhou G (2009) Rheological and microstructural properties of porcine myofibrillar protein-lipid emulsion composite gels. J Food Sci 74(4):E207–E217. 10.1111/j.1750-3841.2009.01140.x - DOI - PubMed
    1. Youssef M, Barbut S (2010) Physiochemical effects of the lipid phase and protein level on meat emulsion stability, texture, and microstructure. J Food Sci 75(2):S108–S114. 10.1111/j.1750-3841.2009.01475.x - DOI - PubMed
    1. Janhoj T, Peterson C, Frost M, Ipsen R (2006) Sensory and rheological characterization of low-fat stirred yogurt. J Texture Stud 37:276–299. 10.1111/j.1745-4603.2006.00052.x - DOI

Publication types