. 2016 Jun;43(11):1486-98.
doi: 10.1111/ejn.13241. Epub 2016 Apr 18.

Loss of the calcium channel β4 subunit impairs parallel fibre volley and Purkinje cell firing in cerebellum of adult ataxic mice

Affiliations

Loss of the calcium channel β4 subunit impairs parallel fibre volley and Purkinje cell firing in cerebellum of adult ataxic mice

Bruno Benedetti et al. Eur J Neurosci. 2016 Jun.

Abstract

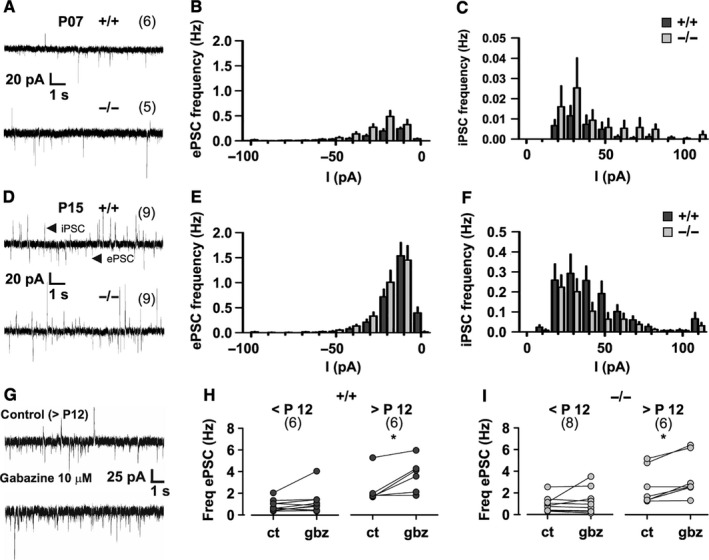
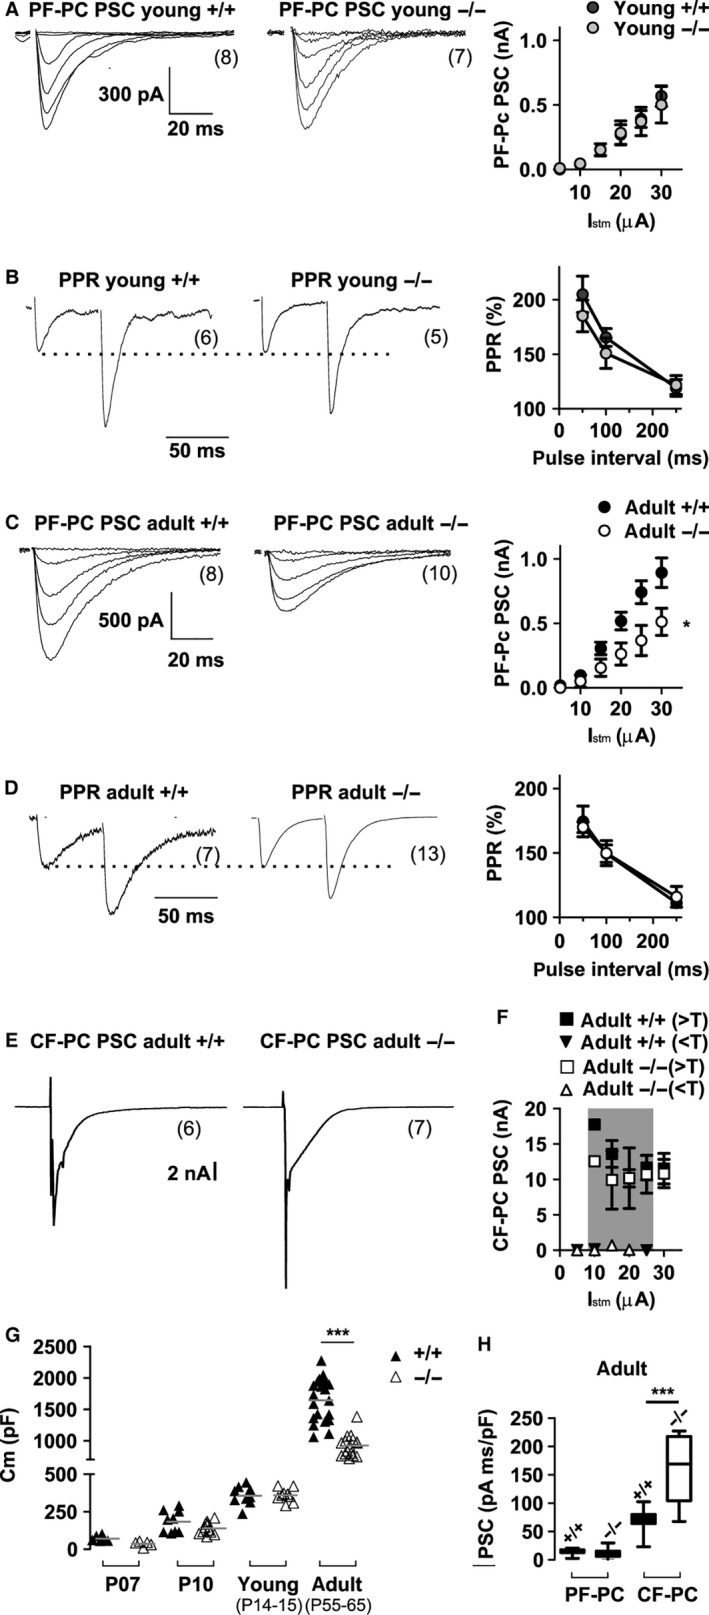
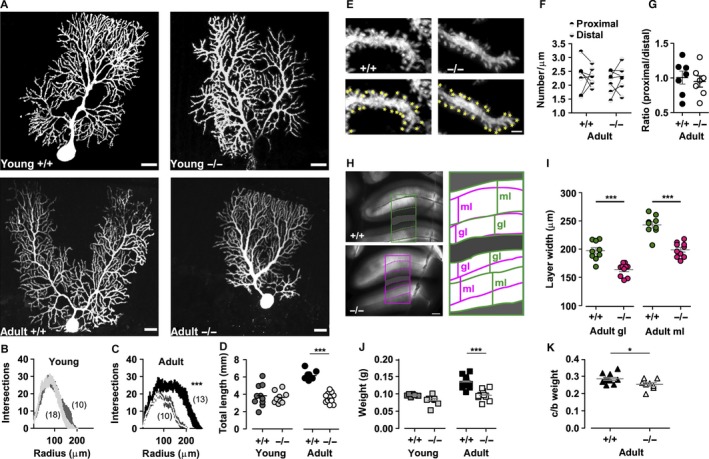
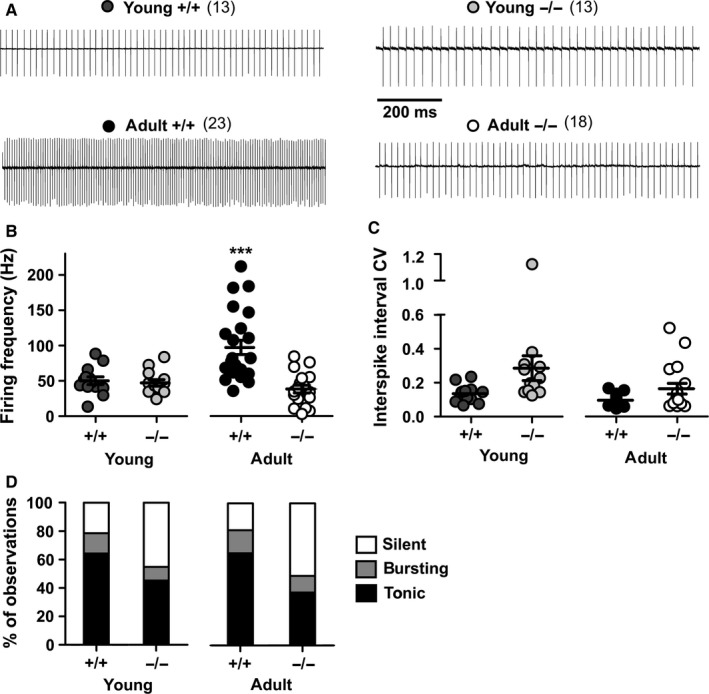
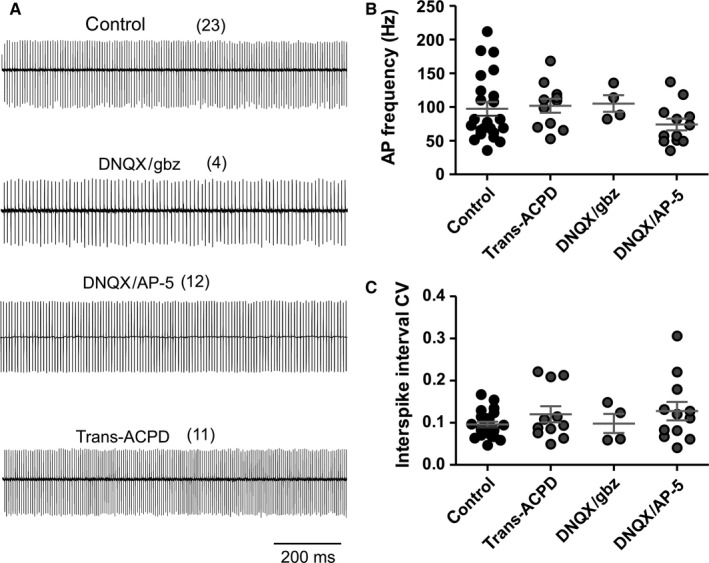
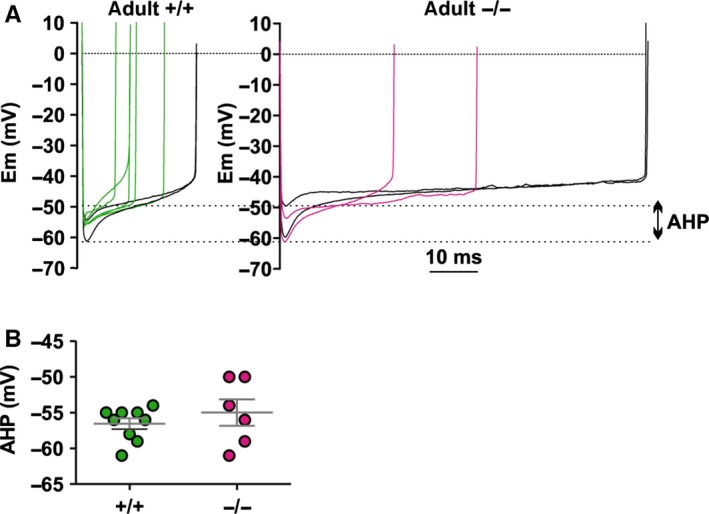
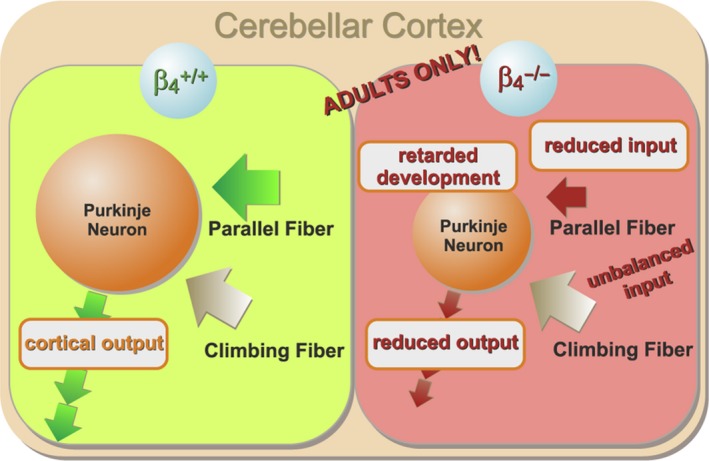
The auxiliary voltage-gated calcium channel subunit β4 supports targeting of calcium channels to the cell membrane, modulates ionic currents and promotes synaptic release in the central nervous system. β4 is abundant in cerebellum and its loss causes ataxia. However, the type of calcium channels and cerebellar functions affected by the loss of β4 are currently unknown. We therefore studied the structure and function of Purkinje cells in acute cerebellar slices of the β4 (-/-) ataxic (lethargic) mouse, finding that loss of β4 affected Purkinje cell input, morphology and pacemaker activity. In adult lethargic cerebellum evoked postsynaptic currents from parallel fibres were depressed, while paired-pulse facilitation and spontaneous synaptic currents were unaffected. Because climbing fibre input was spared, the parallel fibre/climbing fibre input ratio was reduced. The dendritic arbor of adult lethargic Purkinje cells displayed fewer and shorter dendrites, but a normal spine density. Accordingly, the width of the molecular and granular layers was reduced. These defects recapitulate the impaired cerebellar maturation observed upon Cav 2.1 ataxic mutations. However, unlike Cav 2.1 mutations, lethargic Purkinje cells also displayed a striking decrease in pacemaker firing frequency, without loss of firing regularity. All these deficiencies appear in late development, indicating the importance of β4 for the normal differentiation and function of mature Purkinje cells networks. The observed reduction of the parallel fibre input, the altered parallel fibre/climbing fibre ratio and the reduced Purkinje cell output can contribute to the severe motor impairment caused by the loss of the calcium channel β4 subunit in lethargic mice.

Keywords: ataxia; cerebellar cortex; development; electrophysiology; neuron.


Figures

Figure 1
Figure 1
Spontaneous excitatory and inhibitory postsynaptic currents (ePSCs and iPSCs) in young Purkinje neurons from wildtype (+/+) and lethargic (−/−) mice. (A, D) Representative recordings from P07 and P15 mice show ePSCs and iPSCs as inward and outward current spikes, respectively. (B, C, E, F) Graphs depicting ePSC and iPSC amplitude and frequency in P07 (B, C) and P15 mice (E, F). (G) iPSCs and ePSCs in control conditions, and in the presence of gabazine; note the absence of iPSCs after gabazine application. (H, I) Mean ePSC frequency in paired recordings before and after gabazine application in +/+ (H) and −/− (I) mice. Note the significant increase in ePSC frequency in both +/+ and −/− mice after P12. Bar graphs indicate mean ± SEM; anova tests were used for comparison of amplitude and frequency as detailed in Table 1. A paired t‐test was used in H and I; *P < 0.05. Numbers of independent samples are indicated in parentheses in the figure.
Figure 2
Figure 2
Evoked postsynaptic currents (PSCs) and paired pulse facilitation in cerebellar Purkinje neurons upon stimulation of parallel fibres and climbing fibres in wildtype (+/+) and lethargic (−/−) mice. (A–D) Representative PF volley recordings in juvenile (A, B) and adult (C, D) mice; *P < 0.05; two‐way anova. (A, C) PSC amplitude in responses to increasing stimulus intensity displays a significantly higher amplitude in adult +/+ compared to −/− mice (c). (B, D) PPF upon repetitive PF stimulation shows that the PPRs are not different in lethargic mice compared to age‐matched controls (mean ± SEM). (E) Representative PSCs upon CF stimulation. (F) CFPC PSC all‐or‐none responses display constant amplitude at increasing stimulus intensities above effective threshold (> T, squares) and below threshold (< T, triangles). (G) Differences in whole cell capacitance (Cm) in adult PCs reveals a significantly decreased PC size in −/− mice. (H) Integral of PFPC and CFPC PSCs normalized to whole cell capacitance demonstrates that relative to cell size current density of PFPC is identical in genotypes, but CFPC current density is significantly increased in −/− mice. Box‐plots show mean, inter‐quartile distribution and 10–90% of the data range. ‘Young’ mice were P14–P15, while ‘adult’ mice were P55–P65. Differences between PFPC PSCs were measured at any stimulation intensity with two‐way anova test; other differences between multiple populations (G, H) were measured with one‐way anova test followed by Bonferroni post‐test as detailed in Table 2. *P < 0.05; ***P < 0.0001. Numbers of independent samples are indicated in parentheses in the figure.
Figure 3
Figure 3
Morphological analysis of Purkinje neurons, granular and molecular layers. (A) Purkinje neurons of juvenile and adult wildtype (+/+) and lethargic (−/−) mice, perfused with biocytin during patch‐clamp recording and subsequently fluorescently labelled and analysed with confocal microscopy. Scale bars = 20 μm. (B, C) Graphs of the number of radial intersections of dendrites at increasing distance from the soma (Scholl analysis) in young (B) and adult (C) +/+ and −/− mice. Note the significantly diminished branching of adult −/− PCs. (D) Total dendritic length is significantly increased in dendrites in adult +/+ PCs. (E) High‐magnification images of PC dendrite segments in +/+ and −/− mice with dendritic spines highlighted by yellow marks (lower panels). Scale bar = 1.5 μm. (F) Average spine density in proximal and distal dendritic segments in adult +/+ and −/− neurons; paired measurements in each cell are connected by lines. (G) Ratio between proximal and distal spine density. (H) Brightfield images of acute cerebellar slices from adult +/+ and −/− mice. Scale bar = 250 μm. Masks outlining the granular and molecular layers are expanded and superimposed in the right panel. (I) Average width of adult +/+ and adult −/− granular and molecular layers. Note that both granular and molecular layers are significantly narrower in the cerebellar cortex of −/− mice. (J) Cerebellar weight of young +/+ (dark grey) and young −/− (light grey), adult +/+ (black) and adult −/− (white) mice. (K) Ratio between cerebellum and brain weight (c/b) in adult +/+ (black) and adult −/− (white) mice. Differences in dendritic branching (B, C) were analysed with two‐way anova and numbers of independent samples are indicated in parentheses. Differences between multiple populations were analysed with one‐way anova followed by Bonferroni post‐test (D, F, J, I). A Mann–Whitney test was used in the comparison between adult cerebellum/brain weight ratio and proximal/distal spine ratio (G, K). *P < 0.05, ***P < 0.0001.
Figure 4
Figure 4
Pacemaker firing of Purkinje neurons in young and adult wildtype (+/+) and lethargic (−/−) mice. (A) Representative cell‐attached recordings; vertical deflection of baseline represents individual action potentials. (B, C) Average pacemaker firing frequency (B) and coefficient of variation of the inter‐spike interval (C) in young and adult +/+ and −/− PCs. Each mark in the scatter plots represents individual average firing properties. Bars indicate mean ± SEM. Note that the frequency of adult wildtype mice is significantly higher than that of lethargic mice. (D) Bar graph indicating the probability and the proportion between independent observations of silent, bursting and tonic firing cells in young and adult +/+ and −/− mice. Differences between firing frequencies were analysed with one‐way anova followed by Bonferroni post‐test and differences between CV (not normally distributed) were analysed with Kruskal–Wallis test, followed by Dunn's post‐test. ***P < 0.0001. Numbers of independent samples are indicated in parentheses in the figure.
Figure 5
Figure 5
Pacemaker firing of wildtype adult Purkinje neurons in control conditions and after blockage of fast synaptic neurotransmission. (A) Representative cell‐attached recording from PCs in untreated control slices, and in the presence of: 10 μm 6,7 dinitroquinoxaline‐2,3‐dione and 10 μm SR 95531 (DNQX/gbz); 10 μm DNQX and 50 μm AP‐5 (DNQX/AP‐5); or 50 μm transACPD. (B, C) Average pacemaker firing frequency (B) and coefficient of variation of the inter‐spike interval (C) in untreated neurons and after pharmacological treatment. Differences between action potential firing in the presence of drugs and untreated controls were analysed with unpaired t‐test for normally distributed samples (frequencies) or Mann–Whitney test for non‐normally distributed samples (CV). Numbers of independent samples are indicated in parentheses in the figure.
Figure 6
Figure 6
Whole‐cell current clamp recordings of afterhyperpolarizations (AHPs) in adult PCs. (A) Representative action potential inter‐spikes from regularly firing cells in adult wildtype (+/+) and lethargic (−/−) mice; dotted lines indicate the range of AHP. Note that action potentials with the same inter‐spike duration produce extremely different amplitudes of AHP (highlighted in black). (B) Scatter plot of average AHP in +/+ and −/− pacemaker firing neurons. Each mark represents an individual average AHP. Differences between AHP were analysed with unpaired t‐test.
Figure 7
Figure 7
Changes in cerebellar cortical network caused by the lack of β4 in adult lethargic mice. In the absence of β4 the input from PFs is reduced, whereas the input from CFs is spared. Thus, the PC inputs are unbalanced. The size of PCs (dendritic branching) and the width of the granular cell layer are reduced. The firing frequency of PCs and thus cerebellar output is reduced. All these deficits affect only adult and not juvenile lethargic mice, consistent with a developmental retardation of cerebellar cortical networks in lethargic mice.

References

    1. Altman, J. (1972) Postnatal development of the cerebellar cortex in the rat. I. The external germinal layer and the transitional molecular layer. J. Comp. Neurol., 145, 353–397. - PubMed
    1. Barclay, J. , Balaguero, N. , Mione, M. , Ackerman, S.L. , Letts, V.A. , Brodbeck, J. , Canti, C. , Meir, A. et al (2001) Ducky mouse phenotype of epilepsy and ataxia is associated with mutations in the Cacna2d2 gene and decreased calcium channel current in cerebellar Purkinje cells. J. Neurosci., 21, 6095–6104. - PMC - PubMed
    1. Benedetti, B. , Matyash, V. & Kettenmann, H. (2011) Astrocytes control GABAergic inhibition of neurons in the mouse barrel cortex. J. Physiol., 589, 1159–1172. - PMC - PubMed
    1. Brodbeck, J. , Davies, A. , Courtney, J.M. , Meir, A. , Balaguero, N. , Canti, C. , Moss, F.J. , Page, K.M. et al (2002) The ducky mutation in Cacna2d2 results in altered Purkinje cell morphology and is associated with the expression of a truncated alpha 2 delta‐2 protein with abnormal function. J. Biol. Chem., 277, 7684–7693. - PubMed
    1. Buraei, Z. & Yang, J. (2010) The b subunit of voltage‐gated Ca2+ channels. Physiol. Rev., 90, 1461–1506. - PMC - PubMed

Publication types

LinkOut - more resources