. 2016 Jul;37(7):2385-97.
doi: 10.1002/hbm.23180. Epub 2016 Mar 23.

Subtle in-scanner motion biases automated measurement of brain anatomy from in vivo MRI

Affiliations

Subtle in-scanner motion biases automated measurement of brain anatomy from in vivo MRI

Aaron Alexander-Bloch et al. Hum Brain Mapp. 2016 Jul.

Abstract

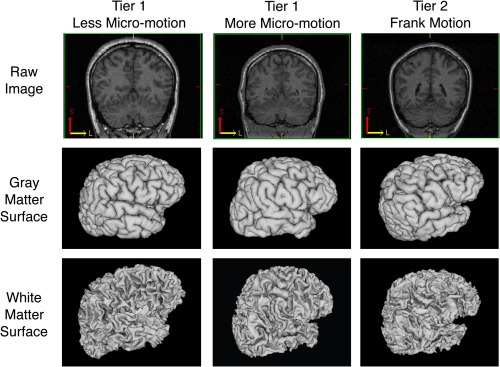
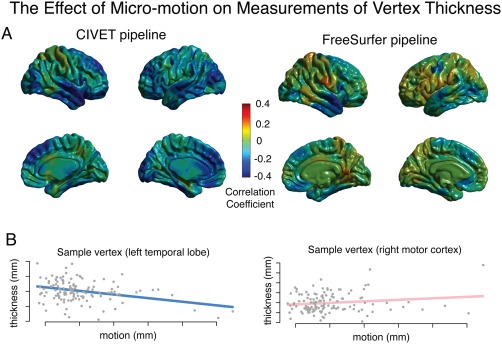
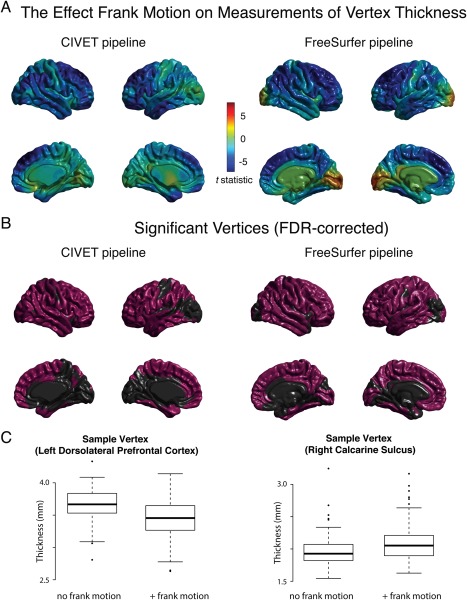
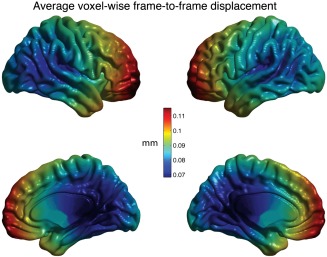
While the potential for small amounts of motion in functional magnetic resonance imaging (fMRI) scans to bias the results of functional neuroimaging studies is well appreciated, the impact of in-scanner motion on morphological analysis of structural MRI is relatively under-studied. Even among "good quality" structural scans, there may be systematic effects of motion on measures of brain morphometry. In the present study, the subjects' tendency to move during fMRI scans, acquired in the same scanning sessions as their structural scans, yielded a reliable, continuous estimate of in-scanner motion. Using this approach within a sample of 127 children, adolescents, and young adults, significant relationships were found between this measure and estimates of cortical gray matter volume and mean curvature, as well as trend-level relationships with cortical thickness. Specifically, cortical volume and thickness decreased with greater motion, and mean curvature increased. These effects of subtle motion were anatomically heterogeneous, were present across different automated imaging pipelines, showed convergent validity with effects of frank motion assessed in a separate sample of 274 scans, and could be demonstrated in both pediatric and adult populations. Thus, using different motion assays in two large non-overlapping sets of structural MRI scans, convergent evidence showed that in-scanner motion-even at levels which do not manifest in visible motion artifact-can lead to systematic and regionally specific biases in anatomical estimation. These findings have special relevance to structural neuroimaging in developmental and clinical datasets, and inform ongoing efforts to optimize neuroanatomical analysis of existing and future structural MRI datasets in non-sedated humans. Hum Brain Mapp 37:2385-2397, 2016. © 2016 Wiley Periodicals, Inc.

Keywords: bias; cortical curvature; cortical surface area; cortical thickness; functional neuroimaging; magnetic resonance imaging; motion.


Figures

Figure 1
Figure 1
Example of 1st tier scans and 2nd tier scans (less micro‐motion, more micro‐motion and frank motion) along with their cortical surface models as generated by CIVET. [Color figure can be viewed in the online issue, which is available at http://wileyonlinelibrary.com.]
Figure 2
Figure 2
This figure illustrates the consistency of motion across fMRI scans within the same scanning session, and the association of motion with age and gender. Motion was estimated as the average frame‐to‐frame displacement, calculated using a series of 6‐degrees‐of‐freedom linear transformations. Following (Power et al., 2012), we used the formula, FDi = |Δd ix| + |Δd iy| + |Δd iz| + |Δα i| + |Δβ i| + |Δγ i|, where Δd ix = d (i − 1)x − d ix. Rotational displacements were converted from degrees to millimeters by calculating displacement on the surface of a sphere of radius 50 mm. (A) The average frame‐to‐frame displacement for two fMRI scans within the same scanning session. (B, C) The frame‐to‐frame displacement of the two scans were averaged to show the relationship with age and gender. N = 436 fMRI scans, 218 scanning sessions, 200 individual subjects (107 female), 127 families; mean age = 15.9 years, sd = 6.2, range = 5–34.
Figure 3
Figure 3
The relationship between micro‐motion and cortical thickness. Subject motion was estimated using the average frame‐to‐frame displacement from an fMRI scan acquired in the same scanning session as the structural scan (Power et al., 2012). (A) Cortical thickness was estimated at vertices across the brain using the CIVET pipeline (left) and the FreeSurfer pipeline (right). The correlation coefficient between motion and thickness was calculated for the residuals of a linear model that included age and gender as covariates. No vertices remained statistically significant after FDR‐correction for multiple comparisons. N = 127 subjects (63 females); mean age = 16.8 (sd = 6.9, range = 6–34); one scan per family. (B) Sample vertices from within the left temporal lobe and the right motor cortex (CIVET pipeline) illustrate the relationship between micro‐motion and cortical thickness.
Figure 4
Figure 4
The relationship between frank motion and cortical thickness. ( A) 136 scans visually ranked as Tier 1 (frank motion absent) were gender‐ and age‐matched with 136 scans ranked as Tier 2 (frank motion present) (average age difference between matched scans = ∼1 week). Paired t‐tests were calculated between matched samples, comparing cortical thickness estimated at vertices across the brain the CIVET pipeline (left) and FreeSurfer pipeline (right). (B) Anatomical regions whose relationship with scan quality was statistically significant after FDR‐correction for multiple comparisons. (C) Sample vertices from within the left dorsolateral frontal cortex (CIVET pipeline) and right calcarine sulcus (FreeSurfer pipeline) illustrate the relationship between frank motion and cortical thickness.
Figure 5
Figure 5
Micro‐motion on a voxel‐by‐voxel basis. The affine transformation from volumetric motion correction were applied to each voxel separately to estimate the frame‐to‐frame displacement for each voxel. For each voxel this value was averaged across the scan, to yield subject‐level maps. These maps were transformed into MNI standard space and averaged across subjects. For illustrative purposes, voxel values were projected onto the CIVET triangular mesh using nearest‐neighbor interpolation.

References

    1. Atkinson D, Hill DL, Stoyle PN, Summers PE, Keevil SF (1997): Automatic correction of motion artifacts in magnetic resonance images using an entropy focus criterion. IEEE Trans Med Imaging 16:903–910. - PubMed
    1. Atkinson D, Hill DL, Stoyle PN, Summers PE, Clare S, Bowtell R, Keevil SF (1999): Automatic compensation of motion artifacts in MRI. Magn Reson Med 41:163–170. - PubMed
    1. Benjamini Y, Krieger AM, Yekutieli D (2006): Adaptive linear step‐up procedures that control the false discovery rate. Biometrika 93:491–507.
    1. Blumenthal JD, Zijdenbos A, Molloy E, Giedd JN (2002): Motion artifact in magnetic resonance imaging: Implications for automated analysis. NeuroImage 16:89–92. - PubMed
    1. Camara‐Rey O, Sneller BI, Ridgway GR, Garde E, Fox NC, Hill DLG (2006): Simulation of acquisition artefacts in MR scans: Effects on automatic measures of brain atrophy. Med Image Comput Comput Assist Interv 9:272–280. - PubMed