

Deciphering the transcriptional regulation and spatiotemporal distribution of immunity response in barley to Pyrenophora graminea fungal invasion
- PMID: 27004551
- PMCID: PMC4804540
- DOI: 10.1186/s12864-016-2573-x
Deciphering the transcriptional regulation and spatiotemporal distribution of immunity response in barley to Pyrenophora graminea fungal invasion
Abstract
Background: Barley leaf stripe disease, caused by the fungus Pyrenophora graminea (Pg), is a worldwide crop disease that results in significant loss of barley yield. The purpose of the present work was to use transcriptomic profiling to highlight barley genes and metabolic pathways affected or altered in response to Pg infection and consequently elucidate their involvement and contribution in resistance to leaf stripe.
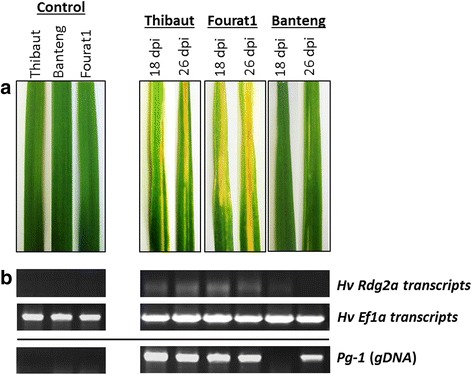
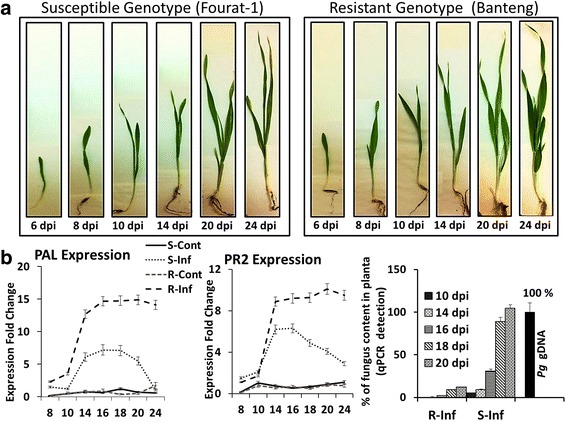
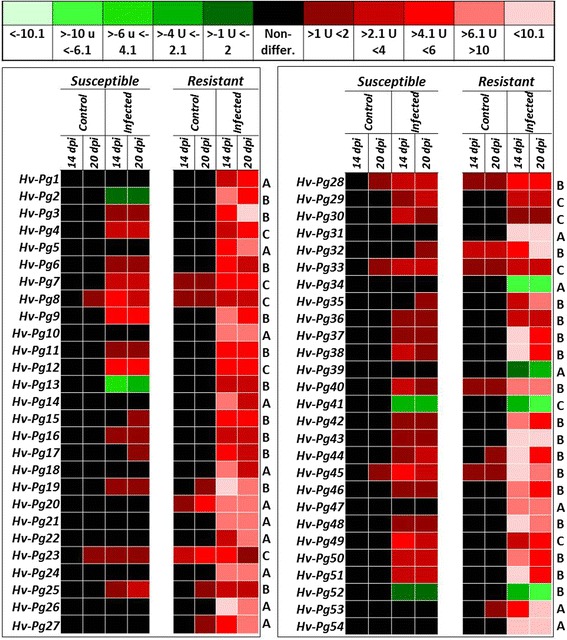
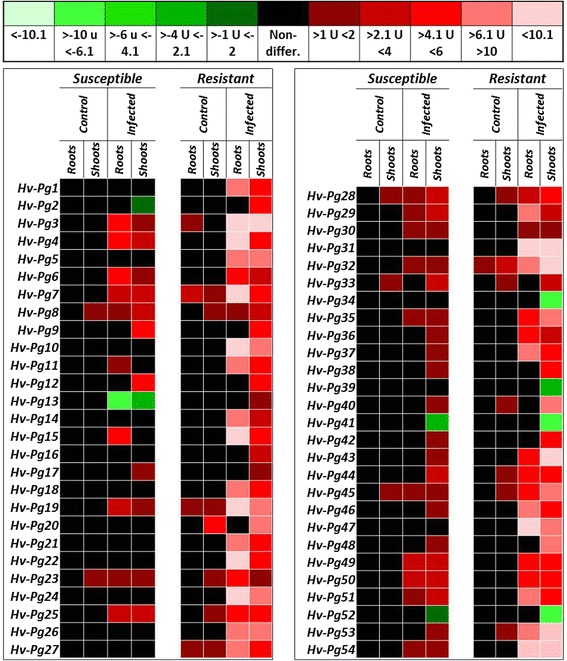
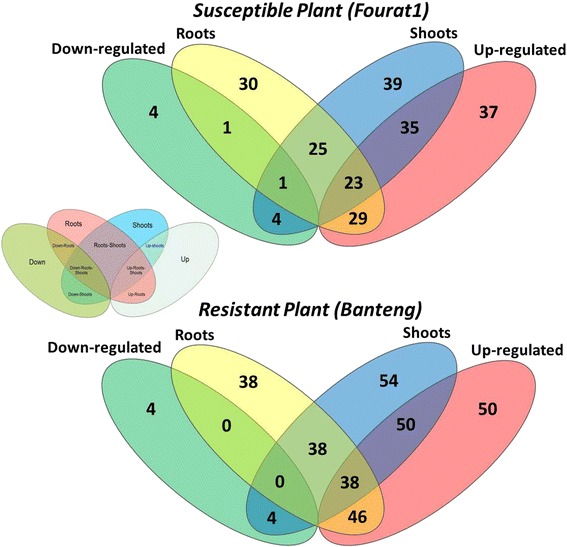
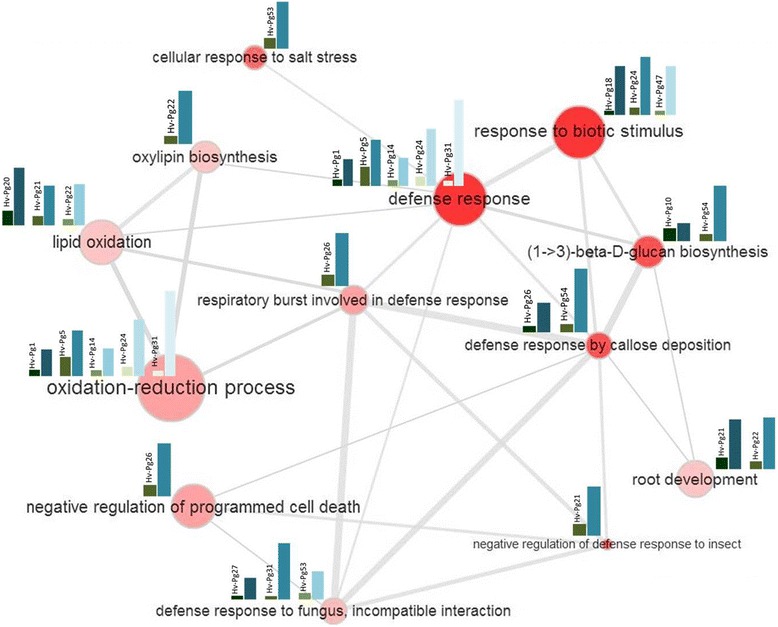
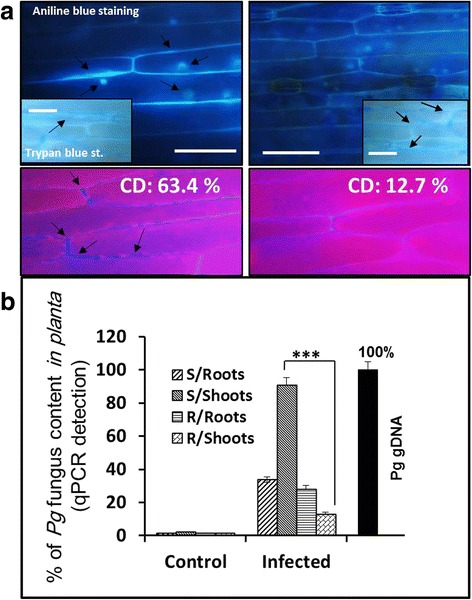
Results: Our study examined and compared the transcriptomes of two barley genotypes using an established differential display reverse-transcription polymerase chain reaction (DDRT-PCR) strategy at 14 and 20 days post-inoculation (dpi). A total of 54 significantly modulated expressed sequence tags (ESTs) were identified. The analysis of gene expression changes during the course of infection with Pg suggested the involvement of 15 upregulated genes during the immunity response. By using network-based analyses, we could establish a significant correlation between genes expressed in response to Pg invasion. Microscopic analysis and quantitative PCR (qPCR) profiling of callose synthase and cellulose synthases revealed a direct involvement of cell wall reinforcement and callose deposition in the Pg-resistant phenotype.
Conclusions: We have identified a number of candidate genes possibly involved in the host-pathogen interactions between barley and Pg fungus, 15 of which are specifically expressed in Pg-resistant plants. Collectively, our results suggest that the resistance to leaf stripe in barley proceeds through callose deposition and different oxidation processes.
Keywords: Callose deposition; Differential display; Expressed sequence tags; Hordeum vulgare; Leaf stripe; Pyrenophora graminea; Transcriptional gene networking.
Figures

Similar articles
-
Histological and molecular analysis of Rdg2a barley resistance to leaf stripe.Mol Plant Pathol. 2008 Jul;9(4):463-78. doi: 10.1111/j.1364-3703.2008.00479.x. Mol Plant Pathol. 2008. PMID: 18705861 Free PMC article.
-
Transcriptome, miRNA, and degradome sequencing reveal the leaf stripe (Pyrenophora graminea) resistance genes in Tibetan hulless barley.BMC Plant Biol. 2025 Jan 17;25(1):71. doi: 10.1186/s12870-025-06055-2. BMC Plant Biol. 2025. PMID: 39825242 Free PMC article.
-
The CC-NB-LRR-type Rdg2a resistance gene confers immunity to the seed-borne barley leaf stripe pathogen in the absence of hypersensitive cell death.PLoS One. 2010 Sep 10;5(9):e12599. doi: 10.1371/journal.pone.0012599. PLoS One. 2010. PMID: 20844752 Free PMC article.
-
Research advances in the Pyrenophora teres-barley interaction.Mol Plant Pathol. 2020 Feb;21(2):272-288. doi: 10.1111/mpp.12896. Epub 2019 Dec 13. Mol Plant Pathol. 2020. PMID: 31837102 Free PMC article. Review.
-
Ramularia collo-cygni--An Emerging Pathogen of Barley Crops.Phytopathology. 2015 Jul;105(7):895-904. doi: 10.1094/PHYTO-11-14-0337-FI. Epub 2015 Jun 29. Phytopathology. 2015. PMID: 25626073 Review.
Cited by
-
Light Drives and Temperature Modulates: Variation of Phenolic Compounds Profile in Relation to Photosynthesis in Spring Barley.Int J Mol Sci. 2023 Jan 26;24(3):2427. doi: 10.3390/ijms24032427. Int J Mol Sci. 2023. PMID: 36768753 Free PMC article.
-
Unveiling functional module associated with fungal disease stress in barley (Hordeum vulgare).Biochem Biophys Rep. 2025 Feb 20;41:101958. doi: 10.1016/j.bbrep.2025.101958. eCollection 2025 Mar. Biochem Biophys Rep. 2025. PMID: 40065769 Free PMC article.
-
Regulation of Phenolic Compound Production by Light Varying in Spectral Quality and Total Irradiance.Int J Mol Sci. 2022 Jun 10;23(12):6533. doi: 10.3390/ijms23126533. Int J Mol Sci. 2022. PMID: 35742975 Free PMC article.
References
-
- Newton AC, Flavell AJ, George TS, Leat P, Mullholland B, Ramsay L, Revoredo-Giha C, Russell J, Steffenson BJ, Swanston JS. Crops that feed the world 4. Barley: a resilient crop? Strengths and weaknesses in the context of food security. Food Security. 2011;3:141–78.
-
- Walters DR, Avrova A, Bingham IJ, Burnett FJ, Fountaine J, Havis ND, Hoad SP, Hughes G, Looseley M, Oxley SJP, et al. Control of foliar diseases in barley: towards an integrated approach. Eur J Plant Pathol. 2012;133:33–73.
-
- West JS, Townsend JA, Stevens M, Fitt BDL. Comparative biology of different plant pathogens to estimate effects of climate change on crop diseases in Europe. Eur J Plant Pathol. 2012;133:315–31. doi: 10.1007/s10658-011-9932-x. - DOI
-
- Mathre DE. Compendium of barley diseases. 2. St Paul: APS Press; 1997.
-
- Zad J, Aghakhani M, Etebarian R, Okhovat M. Barley leaf stripe disease. Meded Rijksuniv Gent Fak Landbouwkd Toegep Biol Wet. 2002;67(2):279–81. - PubMed
Publication types
MeSH terms
LinkOut - more resources
Full Text Sources
Other Literature Sources
