. 2016 Mar 22:9:167.
doi: 10.1186/s13071-016-1438-0.

Flow cytometry analysis of the microbiota associated with the midguts of vector mosquitoes

Affiliations

Flow cytometry analysis of the microbiota associated with the midguts of vector mosquitoes

Tibebu Habtewold et al. Parasit Vectors. .

Abstract

Background: The scientific interest to understand the function and structure of the microbiota associated with the midgut of mosquito disease vectors is increasing. The advancement of such a knowledge has encountered challenges and limitations associated with conventional culture-based and PCR techniques.

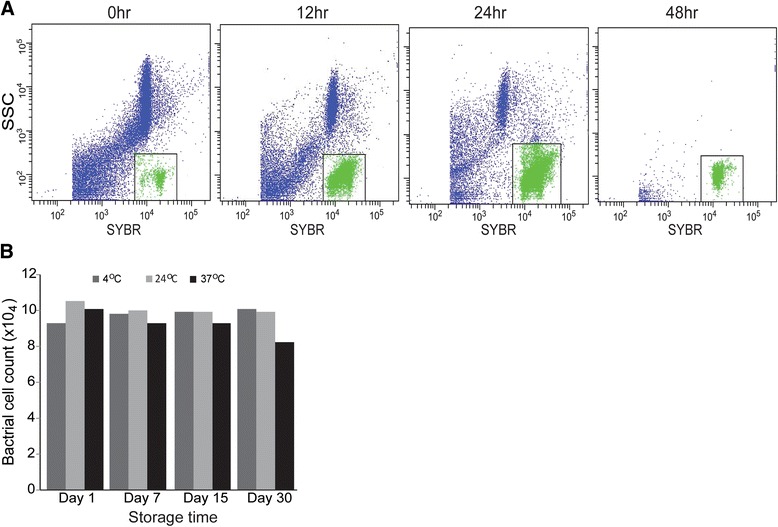
Methods: Flow cytometry (FCM) combined with various cell marking dyes have been successfully applied in the field of ecological microbiology to circumvent the above shortcomings. Here, we describe FCM technique coupled with live/dead differential staining dyes SYBR Green I (SGI) and Propidium Iodide (PI) to quantify and study other essential characteristics of the mosquito gut microbiota.

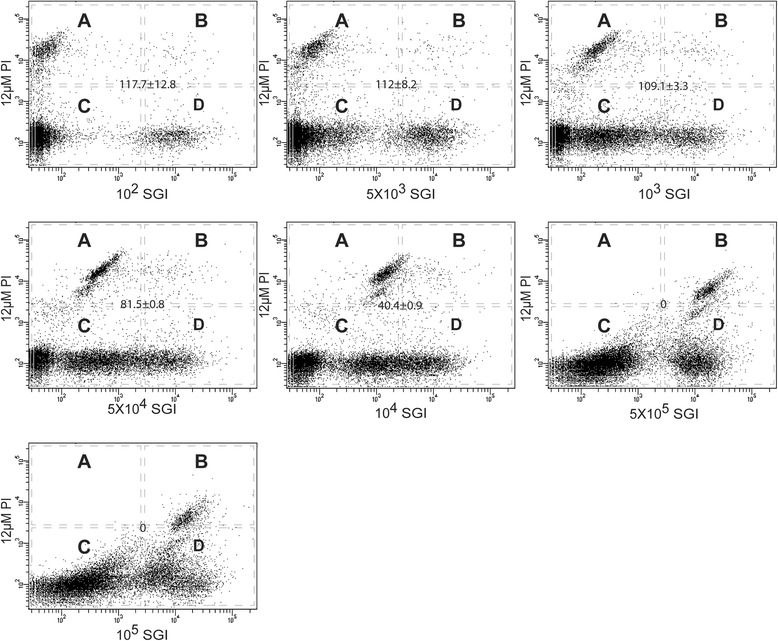
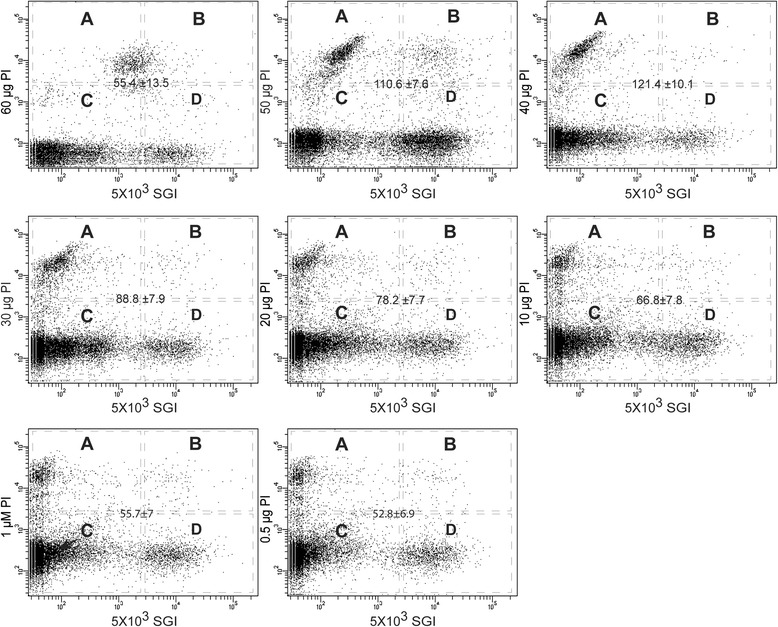
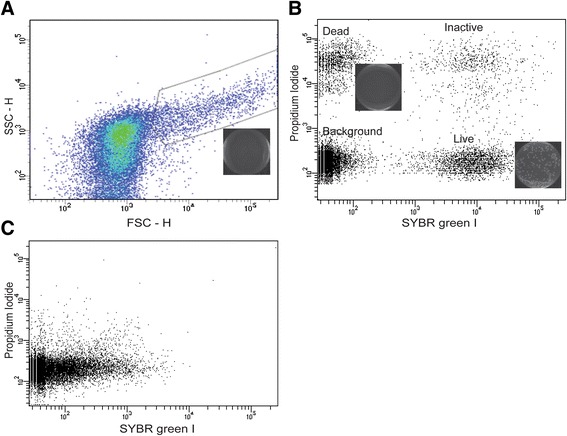
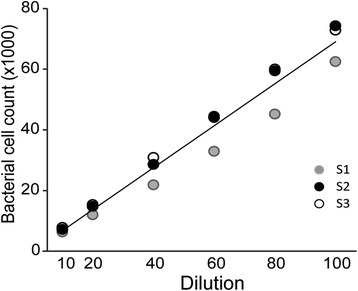
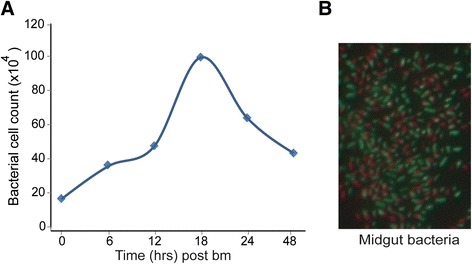
Results: A clear discrimination between cells and debris, as well as between live and dead cells was achieved when the midgut homogenate was subjected to staining with 5 × 10³ dilution of the SGI and 30 μM concentration of the PI. Reproducibly, FCM event collections produced discrete populations including non-fluorescent cells, SYBR positive cells, PI fluorescing cells and cells that fluoresce both in SYBR and PI, all these cell populations representing, respectively, background noise, live bacterial, dead cells and inactive cells with partial permeability to PI. The FCM produced a strong linear relationship between cell counts and their corresponding dilution factors (R (2) = 0.987), and the technique has a better precision compared to qRT-PCR. The FCM count of the microbiota reached a peak load at 18 h post-feeding and started declining at 24 h. The present FCM technique also successfully applied to quantify bacterial cells in fixed midgut samples that were homogenized in 4 % PFA.

Conclusion: The FCM technique described here offers enormous potential and possibilities of integration with advanced molecular biochemical techniques for the study of the microbiota community in disease vector mosquitoes.

Keywords: Anopheles Coluzzii; Dead; Fixed cells; Flow cytometry; Live; Microbiota; Midgut homogenate; Propidium Iodide; discrimination.


Figures

Fig. 1
Fig. 1
SYBR Green I (SGI) serial dilution to determine optimum dilution rate for discrimination between cells and debris and between live and dead microbiota in the mosquito midgut. Each scattergram represent flow cytometric dot plots of red (FL3) versus green (FL1) fluorescence of midgut homogenate suspension stained concurrently with different SGI dilution with respect to a fixed PI at fixed concentration (12 μM) as recommended by the manufacturer. Four regions in the scattergram (A, B, C, D) represent different population of FCM collection, i.e. (A) PI intensive cells representing dead cells, (B) both PI and SGI positive cells representing bacterial cells with partially compromised membrane, (C) background noise and autofluorescing debris and (D) SGI intensive cells representing live bacteria. The number at the center of the plot correspond to the ratio of mean fluorescent intensity (±95 % CI) between bright and dim bacterial cell populations on the SYBR channel
Fig. 2
Fig. 2
Propidium Iodide (PI) serial dilution to determine optimum dilution rate for discrimination between cells and debris and between live and dead microbiota in the mosquito midgut. Each scattergram represent flow cytometric dot plots of red (FL3) versus green (FL1) fluorescence of midgut homogenate suspension stained concurrently with different PI dilutions with respect to a fixed SGI concentration (5 × 103). Four regions in the scattergram (A, B, C, D) represent different population of FCM collection, i.e. (A) PI intensive cells representing dead cells, (B) both PI and SGI positive cells representing bacterial cells with partially compromised membrane, (C) background noise and autofluorescing debris and (D) SGI intensive cells representing live bacteria. The number at the center of the plot correspond to the ratio of mean fluorescent intensity (MFI) (± 95 % CI) between bright and dim cells populations on the PI channel
Fig. 3
Fig. 3
Flow cytometric analysis of midgut homogenate in the blood fed mosquito. a Total FCM collection depicted in SSC vs FSC plot, showing a large population of events with low FSC and SSC, and a smaller population accounting for 3–4 % with higher FSC and SSC. b SYBR vs PI dot plot of low FSC and SSC population, showing four distinct populations depending up on their fluorescein characteristics. c SYBR vs IP dot plot of low FSC and SSC population in aseptic mosquito treated with a cocktail of antibiotics, showing depletion of all the bacterial cells. Insets represents LB agar plate seeded with FCM sorts from the corresponding population
Fig. 4
Fig. 4
Validation of FCM to quantify bacterial in midguts of mosquito. Regression plot depicting serial dilution of gut homogenate vs bacterial count to show the linearity of flow cytometry measurement (R 2 = 0.987). The test was repeated thrice
Fig. 5
Fig. 5
Box plot depicts median number of bacterial with first and third quartiles. Samples correspond midgut homogenates from epithelial receptor gene silenced mosquito
Fig. 6
Fig. 6
FCM quantification of bacterial in midguts of blood fed mosquito. a The dynamics of midgut bacterial over gonotropic cycle; b Depicting live (green) and dead (red) bacteria in the midgut lumen
Fig. 7
Fig. 7
Effect of fixation of midgut samples on the FCM microbiota analysis. a Dot plot of SSC vs SYB of Flow cytometry collection from fixed midgut homogenate at different time points after blood feed. The bacterial event population is shown in box. b Effect of storage conditions of fixed gut homogenate samples on the flow cytometry bacterial count. The samples correspond to midgut homogenates fixed with 4 % PFA in PBS

References

    1. Oliveira JH, Goncalves RL, Oliveira GA, Oliveira PL, Oliveira MF, Barillas-Mury C. Energy metabolism affects susceptibility of Anopheles gambiae mosquitoes to Plasmodium infection. Insect Biochem Mol Biol. 2011;41(6):349–355. doi: 10.1016/j.ibmb.2011.02.001. - DOI - PMC - PubMed
    1. Pumpuni CB, Demaio J, Kent M, Davis JR, Beier JC. Bacterial population dynamics in three anopheline species: the impact on Plasmodium sporogonic development. Am J Trop Med Hyg. 1996;54(2):214–218. - PubMed
    1. Clayton AM, Dong Y, Dimopoulos G. The Anopheles innate immune system in the defense against malaria infection. J Innate Immun. 2014;6(2):169–181. doi: 10.1159/000353602. - DOI - PMC - PubMed
    1. Ponton F, Wilson K, Holmes AJ, Cotter SC, Raubenheimer D, Simpson SJ. Integrating nutrition and immunology: a new frontier. J Insect Physiol. 2013;59(2):130–137. doi: 10.1016/j.jinsphys.2012.10.011. - DOI - PubMed
    1. Weiss BL, Maltz M, Aksoy S. Obligate symbionts activate immune system development in the tsetse fly. J Immunol. 2012;188(7):3395–3403. doi: 10.4049/jimmunol.1103691. - DOI - PMC - PubMed

Publication types

Substances