. 2016 Mar 23:6:23593.
doi: 10.1038/srep23593.

α-Galactosylceramide protects swine against influenza infection when administered as a vaccine adjuvant

Affiliations

α-Galactosylceramide protects swine against influenza infection when administered as a vaccine adjuvant

Bianca L Artiaga et al. Sci Rep. .

Abstract

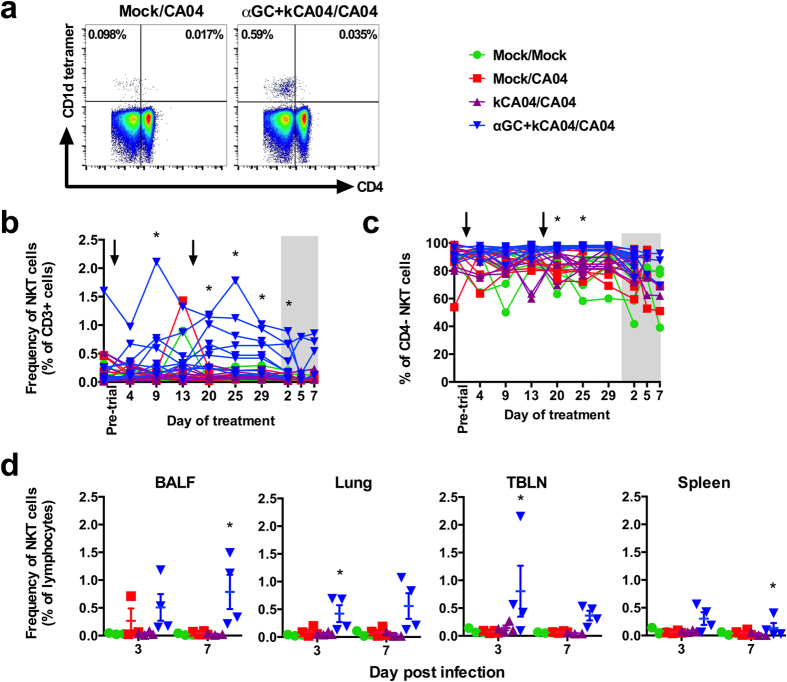
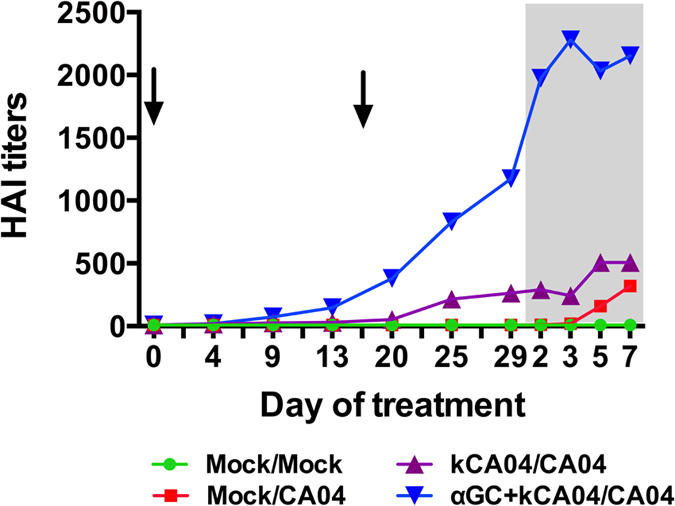
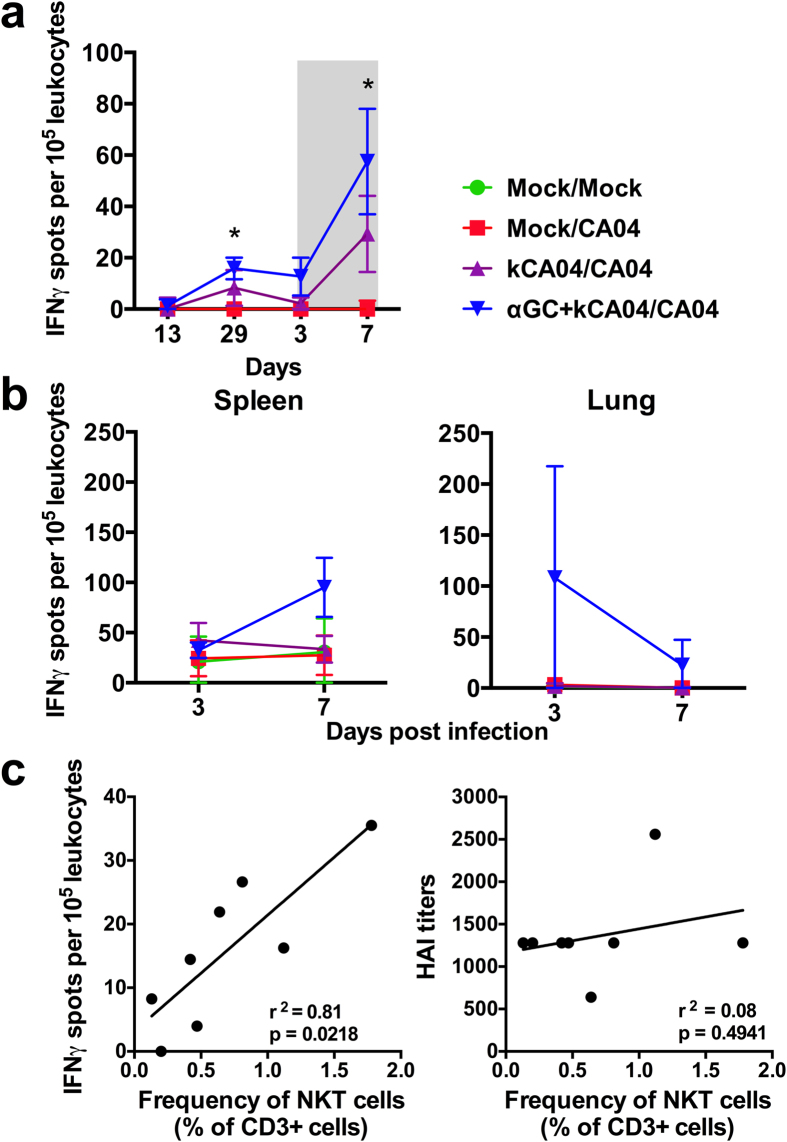
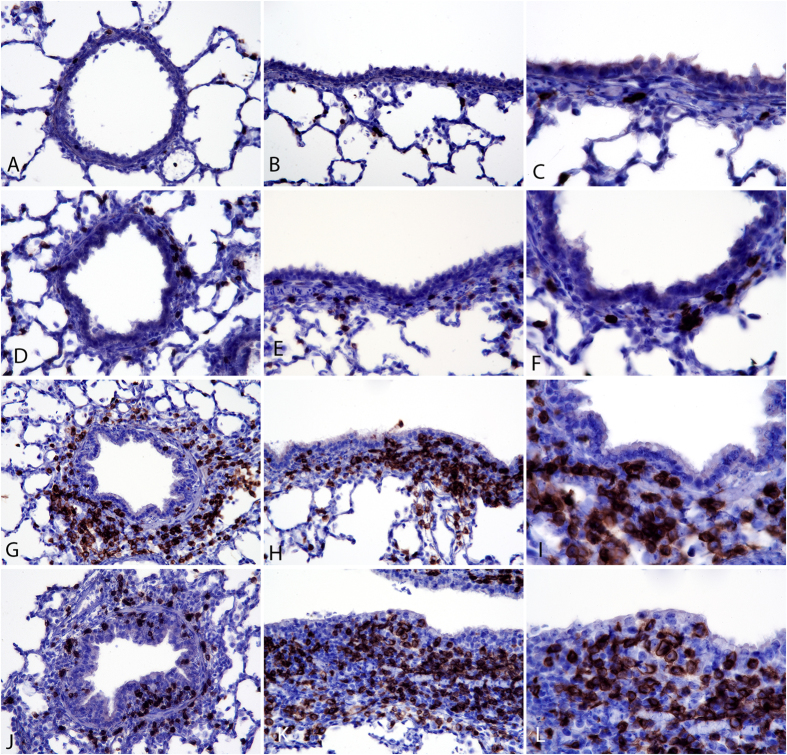
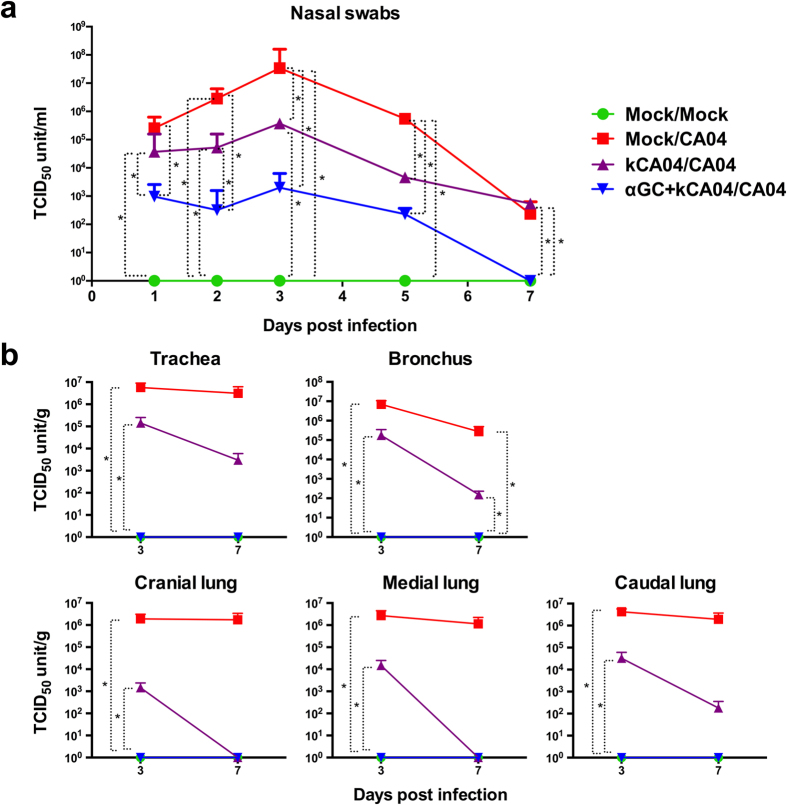
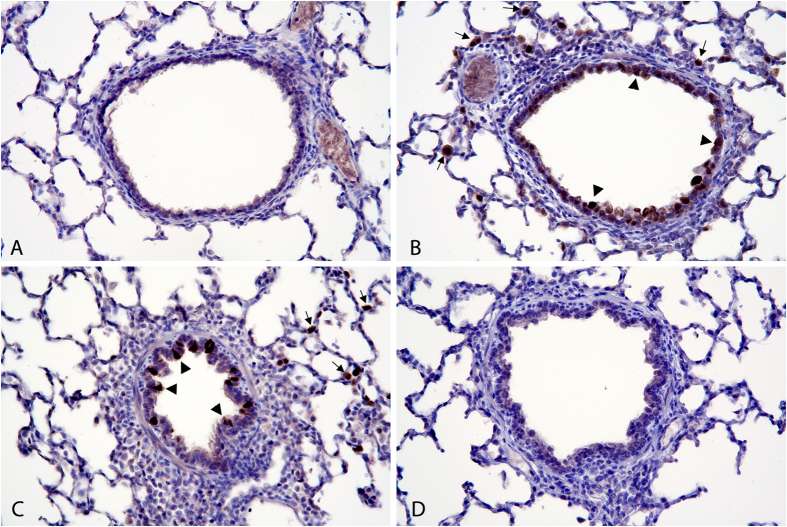
Natural killer T (NKT) -cells activated with the glycolipid ligand α-galactosylceramide (α-GalCer) stimulate a wide array of immune responses with many promising immunotherapeutic applications, including the enhancement of vaccines against infectious diseases and cancer. In the current study, we evaluated whether α-GalCer generates protective immunity against a swine influenza (SI) virus infection when applied as an intramuscular vaccine adjuvant. Immunization of newly weaned piglets with UV-killed pandemic H1N1 A/California/04/2009 (kCA04) SI virus and α-GalCer induced high titers of anti-hemagglutinin antibodies and generated virus-specific T cells that localized in intrapulmonary airways and in alveolar walls. Vaccination with α-GalCer resulted in a systemic increase in NKT-cell concentrations, including in the respiratory tract, which was associated with complete inhibition of viral replication in the upper and lower respiratory tract and much reduced viral shedding. These results indicate that NKT-cell agonists could be used to improve swine vaccine formulations in order to reduce the clinical signs of SI infection and limit the spread of influenza viruses amongst commercial pigs.


Figures

Figure 1
Figure 1. α-GalCer expands porcine NKT-cells that are mostly CD4.
(a) Representative flow cytometry plots comparing peripheral blood (PB) NKT-cells from a mock-vaccinated pig versus a pig vaccinated with α-GalCer. Single cell suspensions were membrane-labeled with anti-CD3 mAb and PBS57-loaded CD1d tetramer. Gating to discriminate CD4+ and CD4 NKT-cell subsets was based on CD4 staining after gating on CD3+ lymphocytes. (b) Frequency of NKT-cells as a percentage of CD3+ lymphocytes in PB of individual pigs during the vaccination period and post infection (shaded region). (c) Percentage of CD4 NKT-cells in PB during the vaccination period and post infection (shaded region). (d) Frequency of NKT-cells as a percentage of total lymphocytes in bronchoalveolar lavage fluid (BALF), lung, tracheobronchial lymph node (TBLN) and spleen at 3 and 7 days p.i. Differences in PB NKT-cell frequencies and subsets were analyzed using the SAS PROC MIXED procedure and the Turkey’s test was used to examine treatment differences at each time point for each dependent variable. Changes in BALF, lung, TBLN and spleen NKT-cell frequencies were analyzed using the Kruskal-Wallis test. *P < 0.05. Data are represented as mean ± SEM. Arrows indicate when vaccinations were administered.
Figure 2
Figure 2. Geometric mean of HAI titers against CA04 H1N1 antigen in plasma at during the 32 day vaccination period as well as 2, 3, 5 and 7 days post-infection (indicated by the shaded region).
Arrows indicate when vaccinations were administered. Geometric mean was calculated as the ‘n’th root product of ‘n’ numbers.
Figure 3
Figure 3. Cellular responses to CA04 H1N1 antigen were measured by IFN-γ-ELISPOT assays.
IFN-γ production by CA04-reactive cells in (a) PBMCs during the vaccination period and post infection (shaded region) and (b) spleen and lung at 3 and 7 days p.i. Single cell suspensions were incubated for 72 h with UV-inactivated CA04 H1N1 virus. Results represent mean IFN-γ spots per 104 leukocytes after subtracting spots counted in unstimulated wells. Results are displayed as the mean ± SEM. Means were compared using the Kruskal-Wallis test. *P < 0.05. (c) Correlations between peripheral blood NKT-cell frequencies and concentrations of CA04-reactive cells in PBMCs (left panel) and CA04-specific antibody titers in plasma (right panel) at day 29 after primary vaccination. Correlations were determined using linear regression analysis and the line in each plot represents the best linear fit.
Figure 4
Figure 4. Localization of CD3+ T cells after SI virus infection.
Mock/Mock: Images (A–C). Images (A,B) are transverse and longitudinal sections of CD3 stained bronchioles at 180× magnification. Image (C) is at 360×. Mock/CA04: Images (D–F). Images (D,E) are transverse and longitudinal sections of CD3 stained bronchioles at 180× with low density CD3+ T-cells in bronchiolar walls. Image (F) is at 360× showing dark brown, CD3-stained T-cells in bronchiolar walls. kCA04/CA04: Images (G–I). Images (G,H) are transverse and longitudinal sections of CD3 stained bronchioles at 180× with thickened bronchiolar walls containing moderate to high density aggregates of CD3+ T-cells. Image (I) is at 360× showing high density CD3+ cells in the bronchiolar wall below columnar to cuboidal bronchiolar epithelial cells. αGC+kCA04/CA04: Images (J–L). Images (J,K) are transverse and longitudinal sections of CD3 stained bronchioles at 180× with markedly thickened bronchiolar walls containing moderate to high density aggregates of CD3+ T-cells with infiltration of CD3+ T-cells within bronchiolar epithelium which is hyperplastic. Image (L) is at 360× showing high density CD3+ cells in the bronchiolar wall within hyperplastic cuboidal bronchiolar epithelial cells.
Figure 5
Figure 5. Viral titers in mock-vaccinated pigs (Mock) and pigs intramuscularly vaccinated 2 times with inactivated CA04 H1N1 virus (kCA04) alone or with α-GalCer (αGC) that were mock inoculated or challenged with homologous CA04 virus.
Mean virus titers for (a) nasal swabs at 1, 2, 3, 5, and 7 days p.i. and (b) homogenized airway tissues at 3 and 7 days p.i. Changes in nasal swab titers were analyzed using the SAS PROC MIXED procedure and the Turkey’s test was used to examine treatment differences at each time point for each dependent variable. Changes in tissue titers were analyzed using the Kruskal-Wallis test. *P < 0.05. Data are represented as mean ± SEM.
Figure 6
Figure 6. Localization of viral antigen in lung at 3 days post infection.
All images are transverse sections of bronchioles and alveolar tissue stained for H1N1 antigen at 174x magnification. Mock/Mock: Image (A). Bronchioles and alveolar tissue are negative for H1N1 antigen. Mock/CA04: Image (B). There is diffuse staining of H1N1 antigen in bronchiolar epithelium (large arrowheads). Type II alveolar epithelial cells stain multifocally (small arrows). kCA04/CA04: Image (C). There is multifocal staining of H1N1 antigen in bronchiolar epithelial cells (large arrowheads). Type II alveolar epithelial cells stain multifocally (small arrows). αGC+kCA04/CA04: Image (D). Bronchioles and alveolar tissue are negative for H1N1 antigen.

References

    1. Vincent A. et al. Review of influenza A virus in swine worldwide: a call for increased surveillance and research. Zoonoses Public Hlth. 61, 4–17 (2014). - PubMed
    1. Brown G. B. & McMillen J. K. MaxiVac-Flu: evaluation ofthe safety and efficacy of a swine influenza. in Proceedings of the American Association of Swine Practitioners, 25th Annual Meeting, Chicago, IL 25, 37–39 (1994).
    1. Bikour M. H., Cornaglia E. & Elazhary Y. Evaluation of a protective immunity induced by an inactivated influenza H3N2 vaccine after an intratracheal challenge of pigs. Can. J. Vet. Res. 60, 312–314 (1996). - PMC - PubMed
    1. Loving C. L. et al. Efficacy in pigs of inactivated and live attenuated influenza virus vaccines against infection and transmission of an emerging H3N2 similar to the 2011–2012 H3N2v. J. Virol. 87, 9895–9903 (2013). - PMC - PubMed
    1. Vincent A. L. et al. Efficacy of inactivated swine influenza virus vaccines against the 2009 A/H1N1 influenza virus in pigs. Vaccine 28, 2782–2787 (2010). - PubMed

Publication types

MeSH terms