

EPIG-Seq: extracting patterns and identifying co-expressed genes from RNA-Seq data
- PMID: 27004791
- PMCID: PMC4804494
- DOI: 10.1186/s12864-016-2584-7
EPIG-Seq: extracting patterns and identifying co-expressed genes from RNA-Seq data
Abstract
Background: RNA sequencing (RNA-Seq) measures genome-wide gene expression. RNA-Seq data is count-based rendering normal distribution models for analysis inappropriate. Normalization of RNA-Seq data to transform the data has limitations which can adversely impact the analysis. Furthermore, there are a few count-based methods for analysis of RNA-Seq data but they are essentially for pairwise analysis of treatment groups or multiclasses but not pattern-based to identify co-expressed genes.
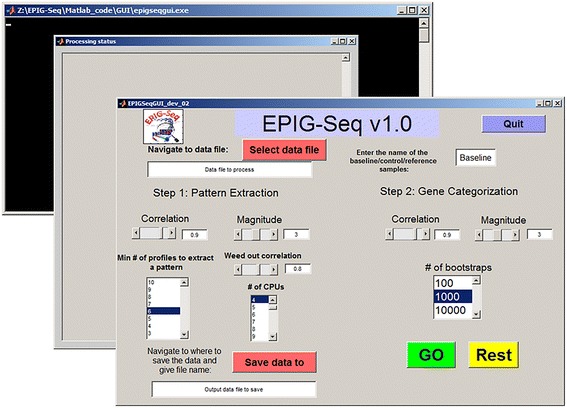
Results: We adapted our extracting patterns and identifying genes methodology for RNA-Seq (EPIG-Seq) count data. The software uses count-based correlation to measure similarity between genes, quasi-Poisson modelling to estimate dispersion in the data and a location parameter to indicate magnitude of differential expression. EPIG-Seq is different than any other software currently available for pattern analysis of RNA-Seq data in that EPIG-Seq 1) uses count level data and supports cases of inflated zeros, 2) identifies statistically significant clusters of genes that are co-expressed across experimental conditions, 3) takes into account dispersion in the replicate data and 4) provides reliable results even with small sample sizes. EPIG-Seq operates in two steps: 1) extract the pattern profiles from data as seeds for clustering co-expressed genes and 2) cluster the genes to the pattern seeds and compute statistical significance of the pattern of co-expressed genes. EPIG-Seq provides a table of the genes with bootstrapped p-values and profile plots of the patterns of co-expressed genes. In addition, EPIG-Seq provides a heat map and principal component dimension reduction plot of the clustered genes as visual aids. We demonstrate the utility of EPIG-Seq through the analysis of toxicogenomics and cancer data sets to identify biologically relevant co-expressed genes. EPIG-Seq is available at: sourceforge.net/projects/epig-seq.
Conclusions: EPIG-Seq is unlike any other software currently available for pattern analysis of RNA-Seq count level data across experimental groups. Using the EPIG-Seq software to analyze RNA-Seq count data across biological conditions permits the ability to extract biologically meaningful co-expressed genes associated with coordinated regulation.
Keywords: Cancer; Clustering; EPIG-Seq; Gene expression; Pattern analysis; RNA-Seq; Toxicogenomics.
Figures


Similar articles
-
Extracting gene expression patterns and identifying co-expressed genes from microarray data reveals biologically responsive processes.BMC Bioinformatics. 2007 Nov 2;8:427. doi: 10.1186/1471-2105-8-427. BMC Bioinformatics. 2007. PMID: 17980031 Free PMC article.
-
A flexible count data model to fit the wide diversity of expression profiles arising from extensively replicated RNA-seq experiments.BMC Bioinformatics. 2013 Aug 21;14:254. doi: 10.1186/1471-2105-14-254. BMC Bioinformatics. 2013. PMID: 23965047 Free PMC article.
-
Comparison of normalization and differential expression analyses using RNA-Seq data from 726 individual Drosophila melanogaster.BMC Genomics. 2016 Jan 5;17:28. doi: 10.1186/s12864-015-2353-z. BMC Genomics. 2016. PMID: 26732976 Free PMC article.
-
Statistical detection of differentially expressed genes based on RNA-seq: from biological to phylogenetic replicates.Brief Bioinform. 2016 Mar;17(2):243-8. doi: 10.1093/bib/bbv035. Epub 2015 Jun 24. Brief Bioinform. 2016. PMID: 26108230 Review.
-
A comparison of statistical methods for detecting differentially expressed genes from RNA-seq data.Am J Bot. 2012 Feb;99(2):248-56. doi: 10.3732/ajb.1100340. Epub 2012 Jan 20. Am J Bot. 2012. PMID: 22268221 Review.
Cited by
-
Patterns, Profiles, and Parsimony: Dissecting Transcriptional Signatures From Minimal Single-Cell RNA-Seq Output With SALSA.Front Genet. 2020 Oct 9;11:511286. doi: 10.3389/fgene.2020.511286. eCollection 2020. Front Genet. 2020. PMID: 33193599 Free PMC article.
-
A Leveraged Signal-to-Noise Ratio (LSTNR) Method to Extract Differentially Expressed Genes and Multivariate Patterns of Expression From Noisy and Low-Replication RNAseq Data.Front Genet. 2018 May 16;9:176. doi: 10.3389/fgene.2018.00176. eCollection 2018. Front Genet. 2018. PMID: 29868123 Free PMC article.
-
Best practices on the differential expression analysis of multi-species RNA-seq.Genome Biol. 2021 Apr 29;22(1):121. doi: 10.1186/s13059-021-02337-8. Genome Biol. 2021. PMID: 33926528 Free PMC article. Review.
-
Differential expression analysis using a model-based gene clustering algorithm for RNA-seq data.BMC Bioinformatics. 2021 Oct 20;22(1):511. doi: 10.1186/s12859-021-04438-4. BMC Bioinformatics. 2021. PMID: 34670485 Free PMC article.
-
Temporal Dynamic Methods for Bulk RNA-Seq Time Series Data.Genes (Basel). 2021 Feb 27;12(3):352. doi: 10.3390/genes12030352. Genes (Basel). 2021. PMID: 33673721 Free PMC article. Review.
References
Publication types
MeSH terms
Grants and funding
LinkOut - more resources
Full Text Sources
Other Literature Sources
