. 2016 Aug;5(4):560-74.
doi: 10.1002/mbo3.351. Epub 2016 Mar 23.

Constitutive aneuploidy and genomic instability in the single-celled eukaryote Giardia intestinalis

Affiliations

Constitutive aneuploidy and genomic instability in the single-celled eukaryote Giardia intestinalis

Pavla Tůmová et al. Microbiologyopen. 2016 Aug.

Abstract

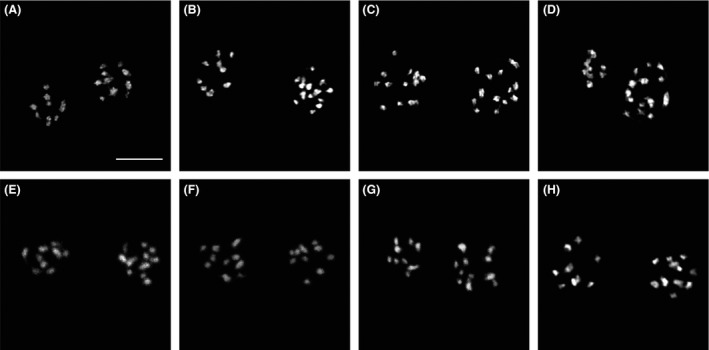
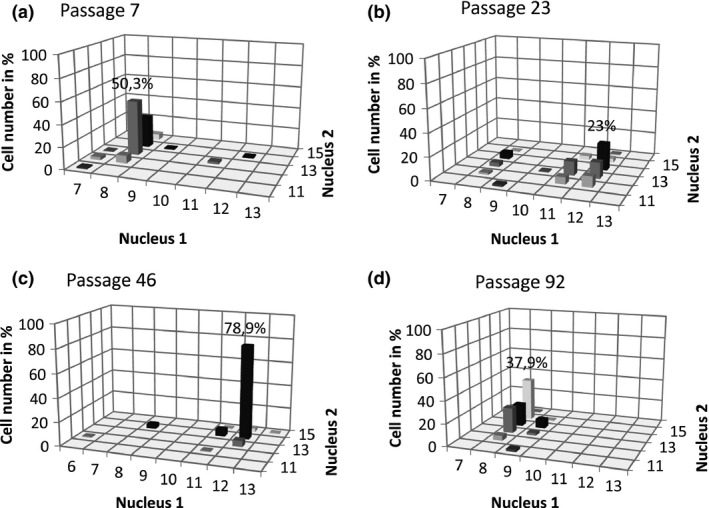
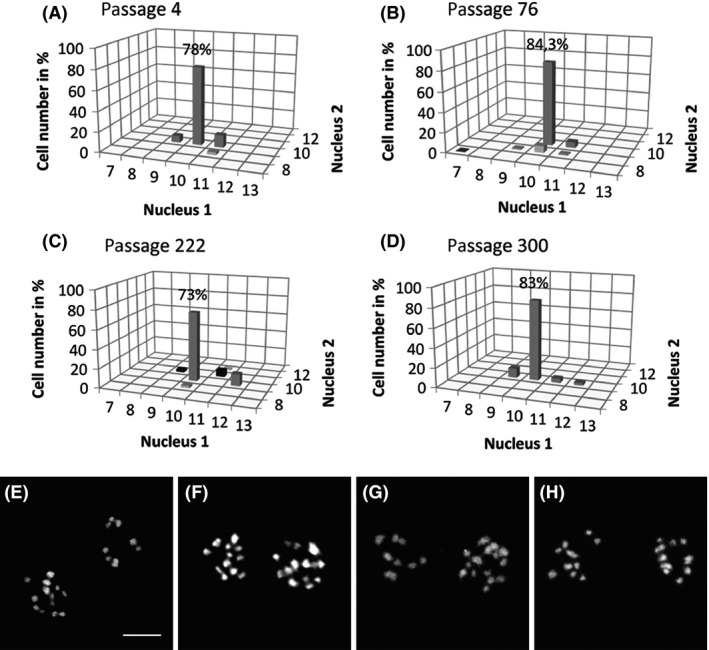
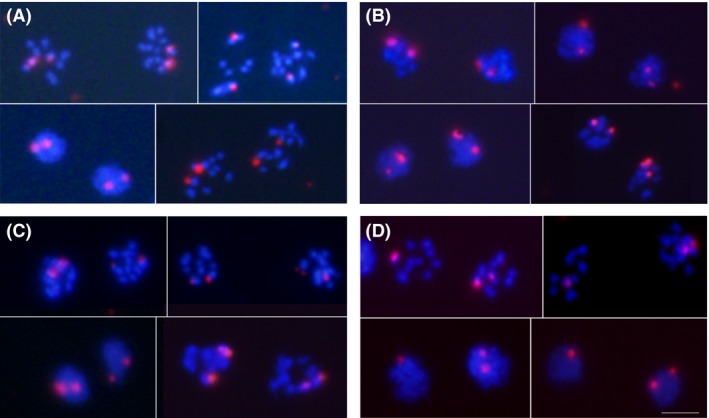
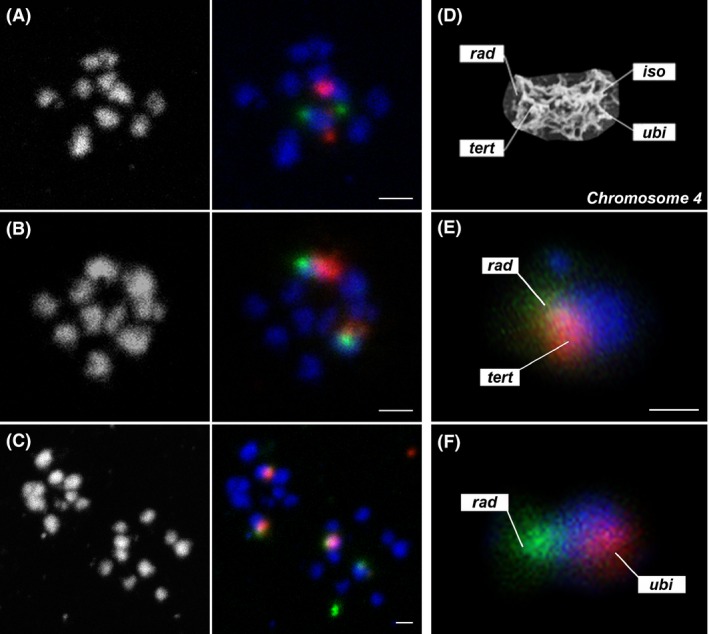
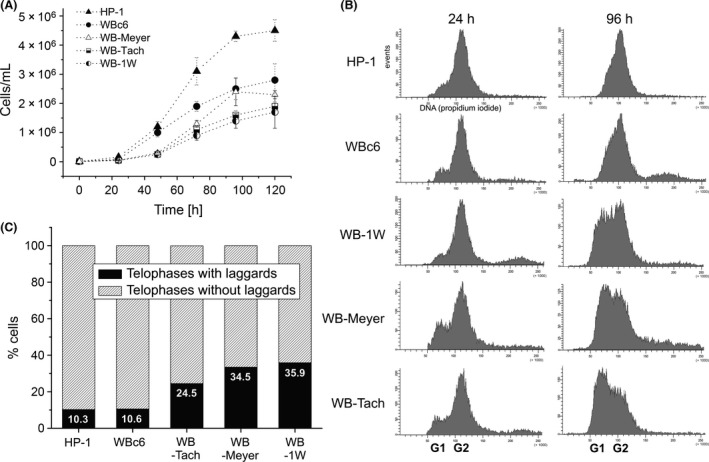
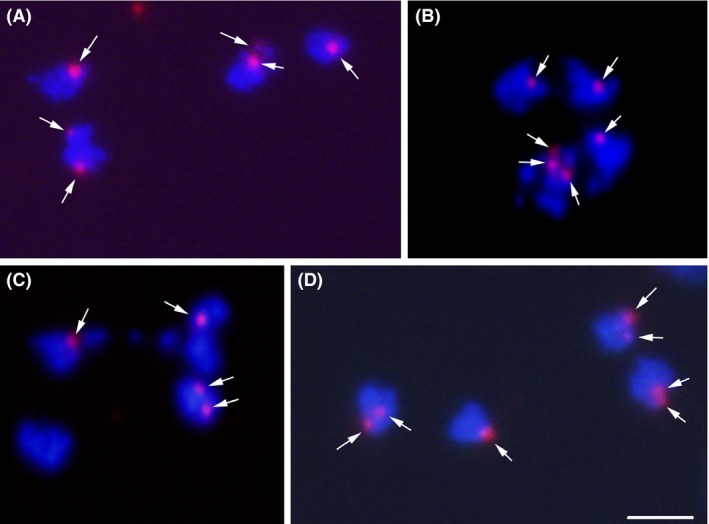
Giardia intestinalis is an important single-celled human pathogen. Interestingly, this organism has two equal-sized transcriptionally active nuclei, each considered diploid. By evaluating condensed chromosome numbers and visualizing homologous chromosomes by fluorescent in situ hybridization, we determined that the Giardia cells are constitutively aneuploid. We observed karyotype inter-and intra-population heterogeneity in eight cell lines from two clinical isolates, suggesting constant karyotype evolution during in vitro cultivation. High levels of chromosomal instability and frequent mitotic missegregations observed in four cell lines correlated with a proliferative disadvantage and growth retardation. Other cell lines, although derived from the same clinical isolate, revealed a stable yet aneuploid karyotype. We suggest that both chromatid missegregations and structural rearrangements contribute to shaping the Giardia genome, leading to whole-chromosome aneuploidy, unequal gene distribution, and a genomic divergence of the two nuclei within one cell. Aneuploidy in Giardia is further propagated without p53-mediated cell cycle arrest and might have been a key mechanism in generating the genetic diversity of this human pathogen.

Keywords: Aneuploidy; FISH; chromosome; giardia; karyotype; protist.


Figures

Figure 1
Figure 1
Condensed metaphase chromosomes in the two nuclei of different Giardia intestinalis lines. Metaphase chromosomes of representative cells from the respective Giardia lines (see Table 1) with the following prevailing karyotypes: (A) WBATCC, 9 + 10 chromosomes; (B) WB‐1W, 10 + 14 chromosomes; (C) WB‐Tach, 13 + 13 chromosomes; (D) WB‐Meyer, 8 + 14 chromosomes; (E) WBc6‐ATTC, 9 + 11 chromosomes; (F) WBc6‐Cande, 10 + 10 chromosomes; (G) Portland‐1, 9 + 11 chromosomes; and (H) HP‐1, 9 + 11 chromosomes. The chromosomes were counterstained with DAPI. The frequency of the given karyotype pattern in the Giardia population and number of analyzed cells are listed in Table 1. Bar represents 5 μm.
Figure 2
Figure 2
The karyotype changes in an unstable Giardia intestinalis line (WB‐Meyer) during a long‐term in vitro cultivation. (A‐D) Four selected passages in a one‐year observation period to show the dynamics in karyotype evolution and the karyotype change. The prevailing karyotype changed from 8 + 13 in passage 7 (A), to 12 + 14 in passage 23 (B, C), and 8 + 15 in passage 92 (D). Minor karyotype variants were present in all passages, reflecting the rapid karyotype evolution possibly due to missegregation. The frequency of some minor variants reached up to 30%. For the complete data, see Table S1. Representative images of karyotypes of cells with the prevailing karyotype patterns 8 + 13, 12 + 14, and 8 + 15 are shown in Fig. 3E‐G.
Figure 3
Figure 3
The karyotype stability in a stable Giardia intestinalis line (WBc6‐Cande) during a long‐term in vitro cultivation. (A‐D) Four selected passages in a two‐year observation period. The prevailing karyotype remained unchanged, that is, 10 + 10 chromosomes in all passages. Minor karyotype variants were generated, with some reaching up to a 13% frequency. For the complete data, see Table S2. (E‐G). Representative images of karyotypes of cells with the prevailing karyotype patterns from different WB‐Meyer passages (Fig. 2) as follows (E) px 7, 8 + 13, (F) px 23, 12 + 14, and (G) px 92, 8 + 15. (H) A representative image of a cell with the prevailing karyotype pattern in WBc6‐Cande with 10 + 10 chromosomes, observed in all analyzed passages. Bar represents 5 μm.
Figure 4
Figure 4
FISH analysis on chromosome 4 in Giardia intestinalis WBc6‐Cande line. Different FISH probes detecting chromosome 4 (red) hybridized on metaphase chromosomes and interphase nuclei. The DNA was counterstained with DAPI (blue). The 2 + 2 hybridization signals were detected in the majority of cells by using following FISH probes (A) rad, (B) iso, (C) ubi. (D) The tert probe revealed the 2 + 1 binding pattern in the majority of cells, with the two signals localized in the more slowly condensing mitotic nucleus. The occurrences of probe binding patterns of the used probes are listed in Table S3. Bar represents 5 μm. FISH, fluorescent in situ hybridization.
Figure 5
Figure 5
Two‐color FISH on chromosome 4 to reveal the probe specificity. Chromosome 4 was probed with two probes against opposite chromosome ends (A,B, F) and against the same chromosome ends (C, E). The probe localization is schematically shown in (D) on a chromosome 4 scanning‐electron‐micrograph (Tumova et al. 2015). Chromosomal spreads were counterstained with DAPI (blue), the red signal results from tetramethyl‐rhodamine‐TSA, the green signal results from fluorescein‐TSA. The used probes were (A) iso (red), rad (green), (B) ubi (red), rad (green), (C) tert (red), rad (green). The bar represents 2 μm. Magnification of a chromosome with both probes hybridized to the same chromosome end (E) tert (red), rad (green), and to the opposite chromosome ends (F) ubi (red), rad (green). The bar represents 1 μm. FISH hybridization of probes designed to different Giardia chromosomes can be found in Fig S1. FISH, fluorescent in situ hybridization.
Figure 6
Figure 6
Phenotypic differences in Giardia intestinalis lines with stable and unstable aneuploid karyotypes. (A) The growth curves of Giardia lines revealed an earlier onset of a log‐phase in HP‐1 and WBc6‐Cande line compared to WB‐Meyer, WB‐Tach, and WB‐1W. The lines that derived from the original WB isolate reached a lower total cell count than did HP‐1, which derived from the Portland‐1 isolate. (B) DNA histograms from FACS analysis showing the proliferative phases in different Giardia lines. The HP‐1 and WBc6‐Cande stable lines underwent the proliferative phase characterized by approximately the same cell number in G1 and G2 after 48 and 72 hr (see Fig S2), respectively, and reached after 96 hr the stationary phase characterized by solely the G2 peak. In contrast, the unstable aneuploid lines (WB‐1W, WB‐Meyer, WB‐Tach) revealed the active proliferation in later phases of in vitro cultivation (after 96 h). For all time intervals, see Fig S2. (C) The frequency of lagging chromatids between the formed daughter telophase nuclei observed in cytogenetic preparations.
Figure 7
Figure 7
Chromatid missegregations detected by FISH on daughter nuclei. The tert probe was hybridized on quartets of daughter nuclei. The two mother nuclei migrated one above the other and segregated laterally, as described previously (Tumova et al. 2007). The chromatin was counterstained with DAPI (blue). The tert probe binding pattern (red) is shown by arrows. We observed symmetric chromatid segregation to daughter cells generated from a mother cell with putatively 2 + 1 initial pattern, that is, 2 + 1 and 2 + 1 pattern (A), as well as asymmetric patterns, daughter cells with 3 + 1 and 1 + 1 patterns (B), 2 + 1 and 0 + 1 patterns from a mother cell with a putative 1 + 1 initial pattern (C). Uneven number of chromatids resulted in their uneven distribution (2 + 1 and 2 + 2) (D). Bar represents 5 μm. FISH, fluorescent in situ hybridization.

References

    1. Adam, R. D. 1992. Chromosome‐size variation in Giardia lamblia: the role of rDNA repeats. Nucleic Acids Res. 20:3057–3061. - PMC - PubMed
    1. Adam, R. D. , Dahlstrom E. W., Martens C. A., Bruno D. P., Barbian K. D., Ricklefs S. M., et al. 2013. Genome sequencing of Giardia lamblia genotypes A2 and B isolates (DH and GS) and comparative analysis with the genomes of genotypes A1 and E (WB and Pig). Genome Biol. Evol. 5:2498–2511. - PMC - PubMed
    1. Agresti, A . 2002. Appendix B: Chi‐Squared Distribution Values Pp. 654–654 in Categorical Data Analysis. John Wiley & Sons, Inc., Hoboken, New Jersey.
    1. Andreassen, P. R. , Lohez O. D., Lacroix F. B., and Margolis R. L.. 2001. Tetraploid state induces p53‐dependent arrest of nontransformed mammalian cells in G1. Mol. Biol. Cell 12:1315–1328. - PMC - PubMed
    1. Aylon, Y. , and Oren M.. 2011. p53: guardian of ploidy. Mol. oncol. 5:315–323. - PMC - PubMed

Publication types

MeSH terms

LinkOut - more resources