

Variation at 2q35 (PNKD and TMBIM1) influences colorectal cancer risk and identifies a pleiotropic effect with inflammatory bowel disease
- PMID: 27005424
- PMCID: PMC5081051
- DOI: 10.1093/hmg/ddw087
Variation at 2q35 (PNKD and TMBIM1) influences colorectal cancer risk and identifies a pleiotropic effect with inflammatory bowel disease
Abstract
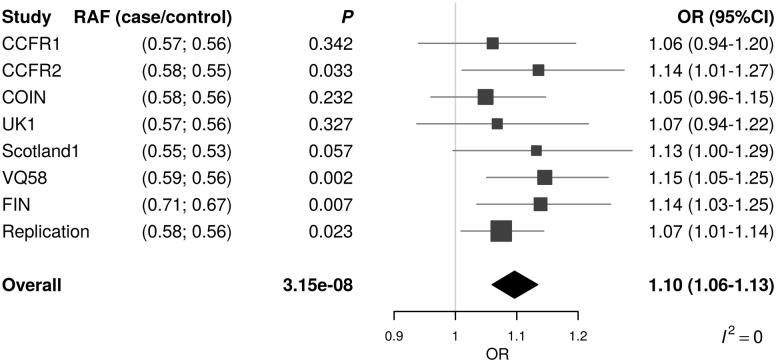
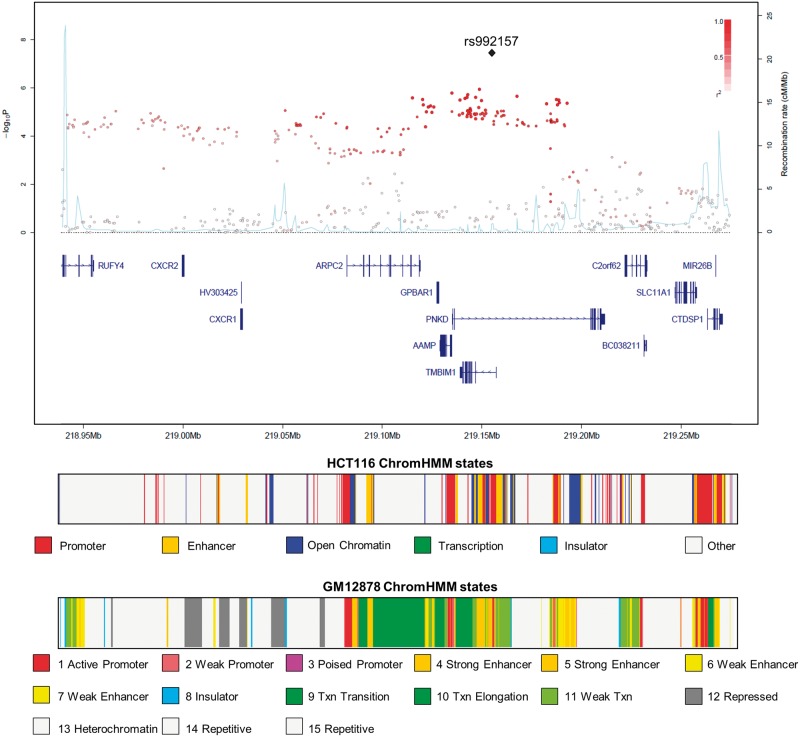
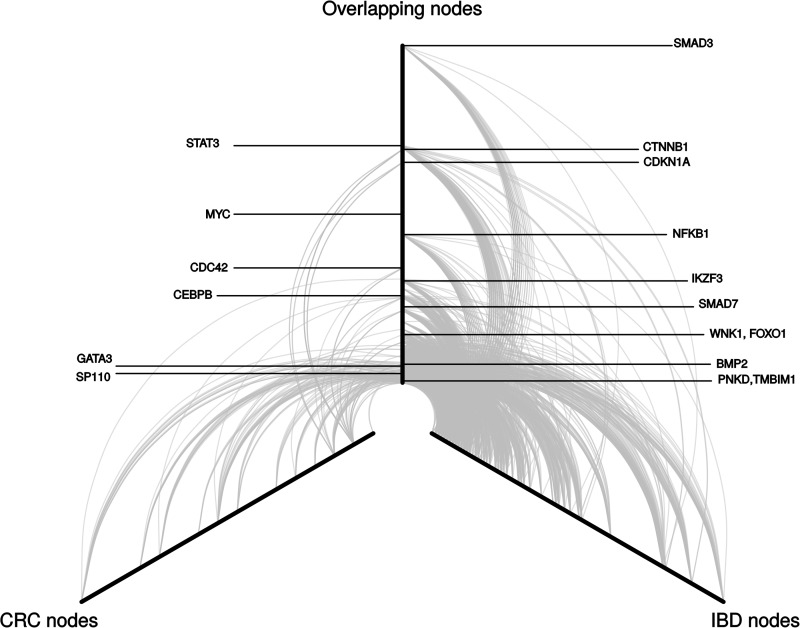
To identify new risk loci for colorectal cancer (CRC), we conducted a meta-analysis of seven genome-wide association studies (GWAS) with independent replication, totalling 13 656 CRC cases and 21 667 controls of European ancestry. The combined analysis identified a new risk association for CRC at 2q35 marked by rs992157 (P = 3.15 × 10⁻⁸, odds ratio = 1.10, 95% confidence interval = 1.06-1.13), which is intronic to PNKD (paroxysmal non-kinesigenic dyskinesia) and TMBIM1 (transmembrane BAX inhibitor motif containing 1). Intriguingly this susceptibility single-nucleotide polymorphism (SNP) is in strong linkage disequilibrium (r2 = 0.90, D' = 0.96) with the previously discovered GWAS SNP rs2382817 for inflammatory bowel disease (IBD). Following on from this observation we examined for pleiotropy, or shared genetic susceptibility, between CRC and the 200 established IBD risk loci, identifying an additional 11 significant associations (false discovery rate [FDR]) < 0.05). Our findings provide further insight into the biological basis of inherited genetic susceptibility to CRC, and identify risk factors that may influence the development of both CRC and IBD.
© The Author 2016. Published by Oxford University Press.
Figures
References
-
- Tomlinson I.P., Carvajal-Carmona L.G., Dobbins S.E., Tenesa A., Jones A.M., Howarth K., Palles C., Broderick P., Jaeger E.E., Farrington S. et al. (2011) Multiple common susceptibility variants near BMP pathway loci GREM1, BMP4, and BMP2 explain part of the missing heritability of colorectal cancer. PLoS Genet., 7, e1002105. - PMC - PubMed
-
- Broderick P., Carvajal-Carmona L., Pittman A.M., Webb E., Howarth K., Rowan A., Lubbe S., Spain S., Sullivan K., Fielding S. et al. (2007) A genome-wide association study shows that common alleles of SMAD7 influence colorectal cancer risk. Nat. Genet., 39, 1315–1317. - PubMed
Publication types
MeSH terms
Substances
Grants and funding
- G1001799/MRC_/Medical Research Council/United Kingdom
- MC_UU_12023/20/MRC_/Medical Research Council/United Kingdom
- MR/N01104X/1/MRC_/Medical Research Council/United Kingdom
- K05 AA000145/AA/NIAAA NIH HHS/United States
- R01 AA012502/AA/NIAAA NIH HHS/United States
- U24 CA074799/CA/NCI NIH HHS/United States
- U01 CA074799/CA/NCI NIH HHS/United States
- MC_PC_U127527198/MRC_/Medical Research Council/United Kingdom
- U24 CA074783/CA/NCI NIH HHS/United States
- N01 CN067009/CN/NCI NIH HHS/United States
- 12076/CRUK_/Cancer Research UK/United Kingdom
- 16459/CRUK_/Cancer Research UK/United Kingdom
- U24 CA074794/CA/NCI NIH HHS/United States
- MR/K014781/1/MRC_/Medical Research Council/United Kingdom
- MC_U122861325/MRC_/Medical Research Council/United Kingdom
- U24 CA074806/CA/NCI NIH HHS/United States
- N01 PC035137/CA/NCI NIH HHS/United States
- HHSN261201300009C/CA/NCI NIH HHS/United States
- MC_U127527198/MRC_/Medical Research Council/United Kingdom
- U24 CA097735/CA/NCI NIH HHS/United States
- U01 CA074794/CA/NCI NIH HHS/United States
- HHSN261201300011C/RC/CCR NIH HHS/United States
- HHSN261201300012I/CA/NCI NIH HHS/United States
- R01 CA143237/CA/NCI NIH HHS/United States
- N01 PC035142/CA/NCI NIH HHS/United States
- MR/K018647/1/MRC_/Medical Research Council/United Kingdom
- MC_UU_12023/3/MRC_/Medical Research Council/United Kingdom
- 13154/CRUK_/Cancer Research UK/United Kingdom
- 18927/CRUK_/Cancer Research UK/United Kingdom
- K02 AA018755/AA/NIAAA NIH HHS/United States
- HHSN261201300021C/CA/NCI NIH HHS/United States
- HHSN261201000035I/CA/NCI NIH HHS/United States
- HHSN261201000035C/PC/NCI NIH HHS/United States
- HHSN261201000034C/CA/NCI NIH HHS/United States
- U01 CA097735/CA/NCI NIH HHS/United States
- K05 CA152715/CA/NCI NIH HHS/United States
- UM1 CA167551/CA/NCI NIH HHS/United States
- U01 CA122839/CA/NCI NIH HHS/United States
- U58 DP003862/DP/NCCDPHP CDC HHS/United States
- WT_/Wellcome Trust/United Kingdom
- U01 CA074783/CA/NCI NIH HHS/United States
- 20240/CRUK_/Cancer Research UK/United Kingdom
- U01 CA074806/CA/NCI NIH HHS/United States
- U24 CA074800/CA/NCI NIH HHS/United States
- HHSN261201000121C/CP/NCI NIH HHS/United States
- U01 CA074800/CA/NCI NIH HHS/United States
- 15116/CRUK_/Cancer Research UK/United Kingdom
- R37 AA012502/AA/NIAAA NIH HHS/United States
LinkOut - more resources
Full Text Sources
Other Literature Sources
Medical
Research Materials
