. 2016 Mar 23:6:23608.
doi: 10.1038/srep23608.

Prohibitin-induced, obesity-associated insulin resistance and accompanying low-grade inflammation causes NASH and HCC

Affiliations

Prohibitin-induced, obesity-associated insulin resistance and accompanying low-grade inflammation causes NASH and HCC

Sudharsana R Ande et al. Sci Rep. .

Abstract

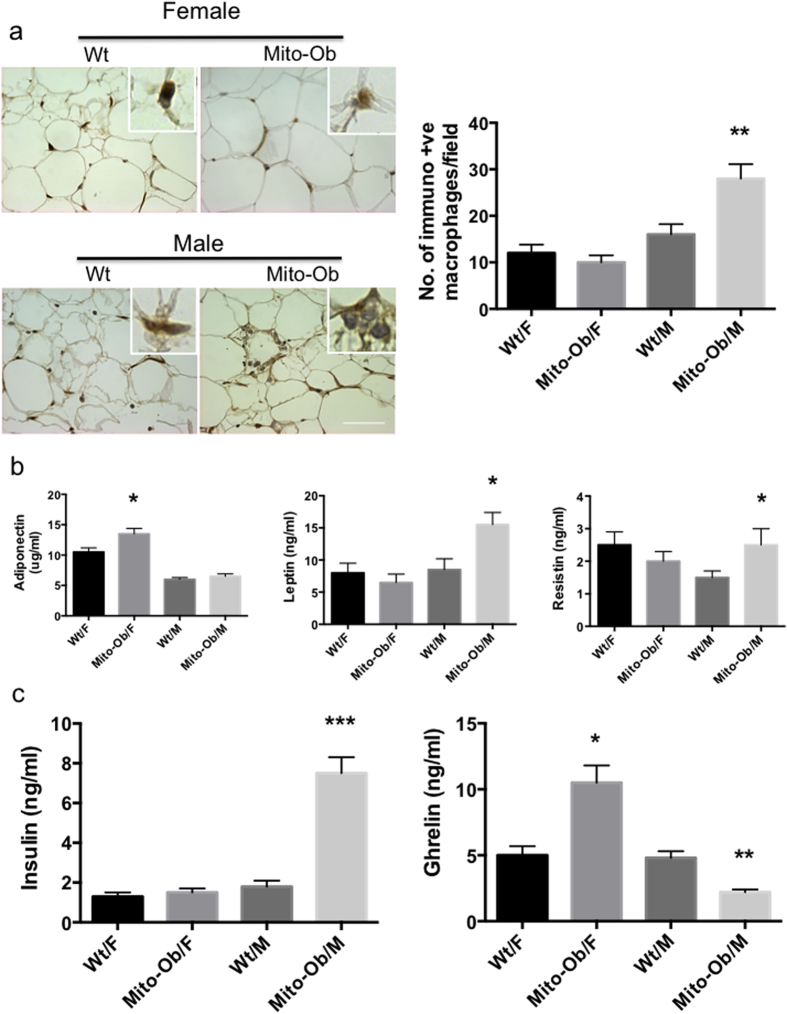
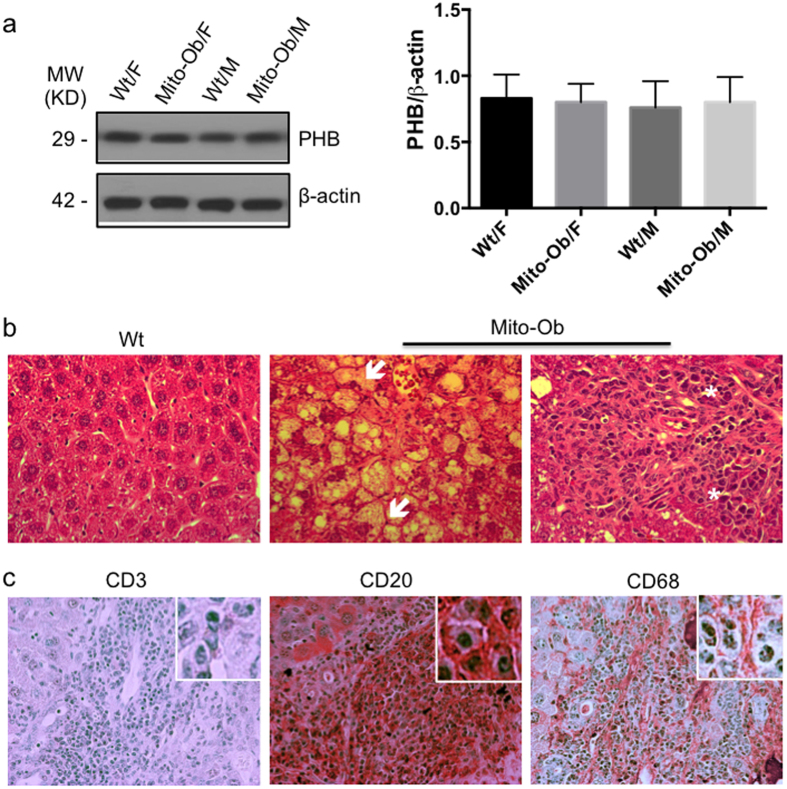
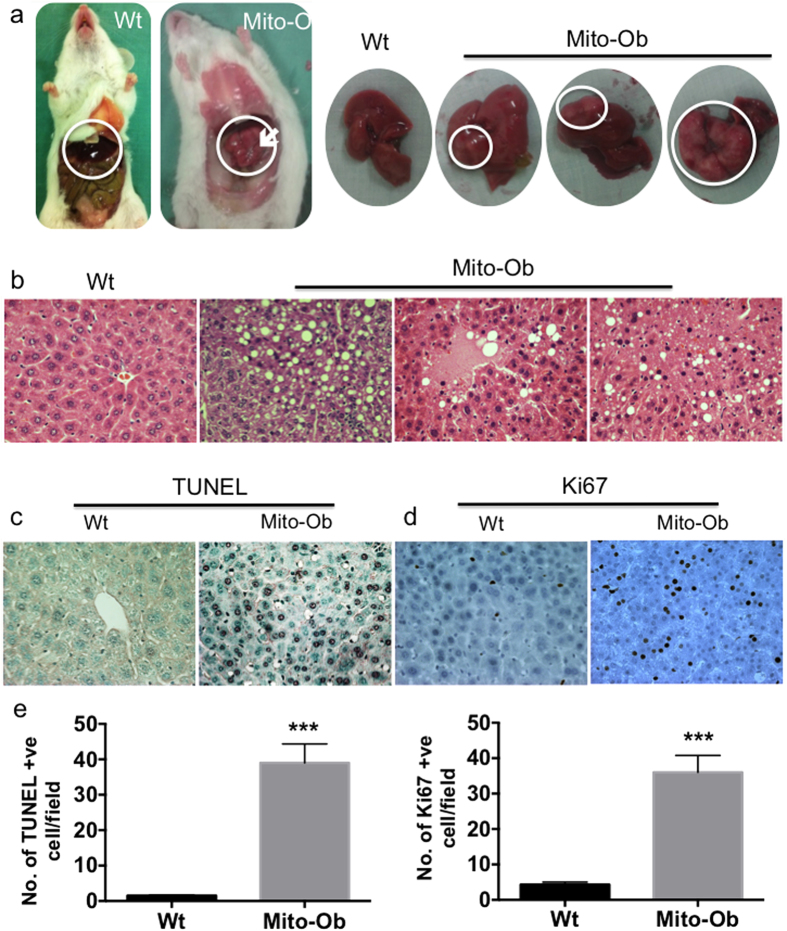
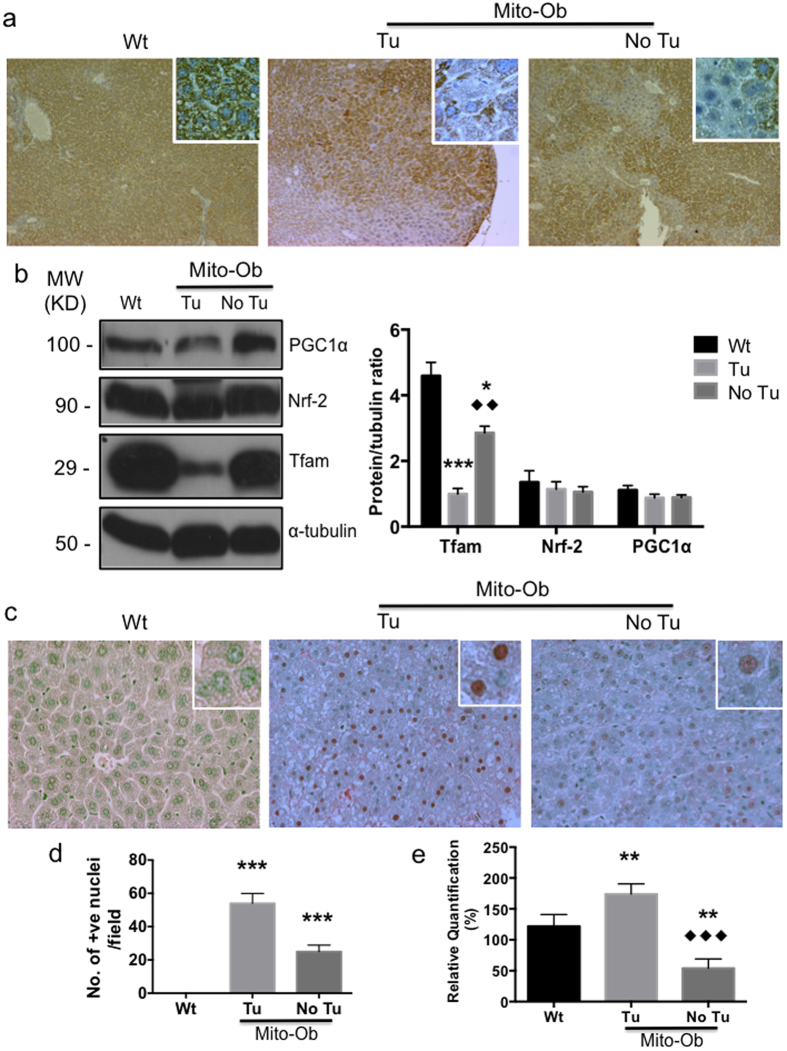
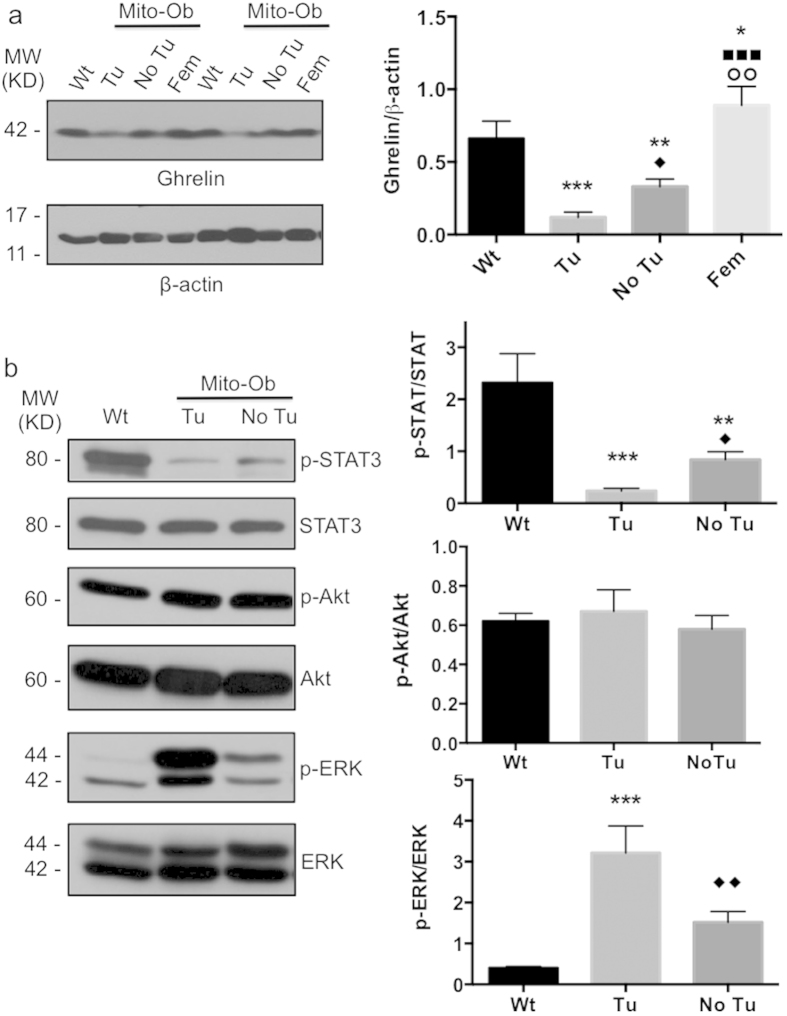
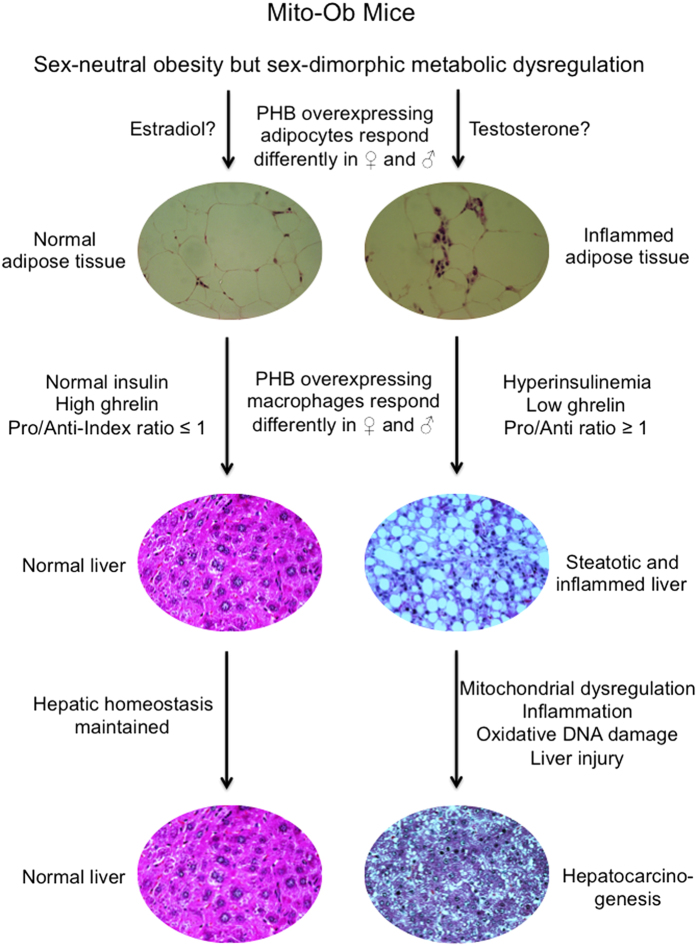
Obesity increases the risk for nonalcoholic steatohepatitis (NASH) and hepatocarcinogenesis. However, the underlying mechanisms involved in the disease process remain unclear. Recently, we have developed a transgenic obese mouse model (Mito-Ob) by prohibitin mediated mitochondrial remodeling in adipocytes. The Mito-Ob mice develop obesity in a sex-neutral manner, but obesity-associated adipose inflammation and metabolic dysregulation in a male sex-specific manner. Here we report that with aging, the male Mito-Ob mice spontaneously develop obesity-linked NASH and hepatocellular carcinoma (HCC). In contrast, the female Mito-Ob mice maintained normal glucose and insulin levels and did not develop NASH and HCC. The anti-inflammatory peptide ghrelin was significantly upregulated in the female mice and down regulated in the male mice compared with respective control mice. In addition, a reduction in the markers of mitochondrial content and function was found in the liver of male Mito-Ob mice with NASH/HCC development. We found that ERK1/2 signaling was significantly upregulated whereas STAT3 signaling was significantly down regulated in the tumors from Mito-Ob mice. These data provide a proof-of-concept that the metabolic and inflammatory status of the adipose tissue and their interplay at the systemic and hepatic level play a central role in the pathogenesis of obesity-linked NASH and HCC.


Figures

Figure 1
Figure 1. Mito-Ob mice display sex differences in adipose tissue structure and function, and in metabolic dysregulation.
(a) Left panel: Representative photomicrographs showing immunohistochemical analysis of the inflammatory macrophages using anti-CD68 antibody in visceral adipose tissue from 9 months old Mito-Ob mice (Magnification 40X). Right panel: Histograms showing quantification of anti-CD68 positive macrophages as shown in the left panel. (n = 5–7 mice in each group). (b,c) Histograms showing serum adipokine and hormone levels in Mito-Ob mice at 9 months of age. Data are presented as mean ± SEM (n = 5–7 mice in each group). Two-way ANOVA (ac) macrophage: P < 0.05 for genotype, P < 0.001 for sex, P < 0.01 for interaction; adiponectin: P = 0.17 for genotype, P < 0.001 for sex, P = 0.27 for interaction; leptin: P < 0.02 for genotype, P < 0.001 for sex, and P < 0.005 for interaction; Resistin: P = 0.72 for genotype, P = 0.72 for sex, and P = 0.30 for interaction; insulin: P < 0.0001for genotype, sex, and interaction; ghrelin: P < 0.05 for genotype, P < 0.0005 for sex and interaction. Asterisks indicate comparison between sex matched Mito-Ob vs Wt. *P < 0.05, **P < 0.01, ***P < 0.001 by Student’s t test. Wt – wild type; F – female; M – male.
Figure 2
Figure 2. NAFLD in male Mito-Ob progresses to NASH with aging.
(a) Left panel: Representative immunoblot showing PHB protein level in liver from 6 months old Mito-Ob mice in comparison with wild type mice. Beta-actin immunoblot is shown as loading control. Similar conditions were used for the electrophoretic analysis of proteins by Western immunoblotting. Right panel: Histograms showing quantification of PHB levels by densitometry as shown in the left panel. Data are presented as mean ± SEM (n = 3). No significant difference was found among groups. (b) Representative photomicrographs showing histological structure of the liver of male Mito-Ob mice and their age matched wild type littermates at 9 months of age. Hepatocyte ballooning and immune infiltration are indicated with white arrow and asterisk respectively. (c) Liver immunohisto-chemistry using macrophage and lymphocyte specific marker antibodies. (Magnification 40X; n = 4–6 mice in each group). MW – molecular weight; KD – kilo Dalton.
Figure 3
Figure 3. Male Mito-Ob mice spontaneously develop HCC with aging.
(a) Representative photographs showing liver morphology from 12–14 months old Mito-Ob mice and their wild type littermates. Tumor in the male Mito-Ob mice is indicated with white arrow and circle. Representative photomicrographs showing histological architecture of H & E stained liver showing features of NAFLD, NASH and HCC (b), apoptotic cells death as determined by TUNEL assay (c) and cell proliferation as determined by anti-Ki67 antibody (d). Magnification 40X. (e) Histograms showing quantification of cell death and cell proliferation in the liver as determined in panel (c,d). Data are presented as mean ± SEM (n = 5–7 mice in each group). Asterisks indicate comparison between sex matched Mito-Ob vs Wt. ***P < 0.001 by Student’s t test. Wt – wild type.
Figure 4
Figure 4. Male Mito-Ob mice with HCC exhibit mitochondrial dysregulation and increased hepatic oxidative DNA damage.
(a) Representative photomicrographs showing reduction in mitochondria content in the hepatic lesion as determined by immunohistochemistry using anti-prohibitin antibody. Magnification 10X. Magnified view of hepatocytes is shown in the insets. (b) Left panel: Representative immunoblots showing expression level of mitochondrial marker proteins in the liver from Mito-Ob mice and control mice. Nrf-2 was used as a control for nuclear transcription factor and beta-tubulin blot is shown as a loading control. Similar conditions were used for the electrophoretic analysis of proteins by Western immunoblotting. Right panel: Histograms showing quantification of protein levels. Data are presented as mean ± SEM (n = 5–7 mice in each group). (c) Representative photomicrographs showing oxidative DNA damage in the liver at 12–14 months of age. (d) Histograms showing quantification of oxidative DNA damage in the liver as shown in the panel (c). (e) Histograms showing mitochondrial copy numbers as determined real time-PCR. Data are presented as mean ± SEM (n = 5–7 mice in each group). Asterisks indicate comparison between sex matched Mito-Ob vs Wt. *P < 0.05, **P < 0.01, ***P < 0.001 by Student’s t test. Diamonds indicate comparison between Tu and No Tu group by Dunnett’s t test. Wt – wild type; Tu – tumor; No Tu – No tumor; MW – molecular weight; KD – kilo Dalton.
Figure 5
Figure 5. ERK1/2 and STAT3 signaling are inversely altered in the liver tumors from Mito-Ob mice.
(a) Left panel: Representative immunoblots showing liver ghrelin level at 12–14 months of age as determined by rabbit polyclonal anti-ghrelin antibody. Data from two different animals in each group is shown. Similar conditions were used for the electrophoretic analysis of proteins by Western immunoblotting. Right panel: Histogram showing quantification of the liver ghrelin level as shown in the left panel. Data are presented as mean ± SEM (n = 3–4 mice in each group). Asterisks indicate comparison between sex matched Mito-Ob vs Wt. *P < 0.05, **P < 0.01, ***P < 0.001 by Student’s t test. Diamonds indicate comparison between Tu and No Tu group, square indicate comparison between Tu and Fem and circle indicate comparison between No Tu and Fem by Dunnett’s t test. (b) Left panel: Representative immunoblots showing the activation level of Akt, ERK, and STAT3 signaling pathways in the liver at 12–14 months of age as determined by their phospho-specific antibodies. Similar conditions were used for the electrophoretic analysis of proteins by Western immunoblotting. Right panel: Histograms showing quantification of the activation level of Akt, ERK, and STAT3 in the liver as shown in the left panel. Data are presented as mean ± SEM (n = 5–7 mice in each group). Asterisks indicate comparison between sex matched Mito-Ob vs Wt. NS, not significant; *P < 0.05, **P < 0.01, ***P < 0.001 by Student’s t test. Diamonds indicate comparison between Tu and No Tu group by Dunnett’s t test. P < 0.05. Wt – wild type; Tu – tumor; No Tu – No tumor; Fem – female; MW – molecular weight; KD – kilo Dalton.
Figure 6
Figure 6. Schematic diagram showing proposed mechanism in obesity-linked NASH and HCC development.
We propose that an extensive interplay between the metabolic and inflammatory status at the adipose tissue and systemic levels, as well as at the hepatic tissue level is involved in the progression of obesity-linked hepatic steatosis to NASH and HCC. Pro – proinflammatory; Anti – anti-inflammatory.

References

    1. Nakagawa H. et al. ER stress cooperates with hypernutrition to trigger TNF-dependent spontaneous HCC development. Cancer Cell. 26, 331–343 (2014). - PMC - PubMed
    1. El-Serag H. B. Hepatocellular carcinoma. N Engl J Med. 365, 118–127 (2011). - PubMed
    1. Turati F. et al. Metabolic syndrome and hepatocellular carcinoma risk. Br J Cancer. 108, 222–228 (2013). - PMC - PubMed
    1. Tilg H. & Moschen A. R. Mechanisms behind the link between obesity and gastrointestinal cancers. Best Pract Res Clin Gastroenterol. 28, 599–610 (2014). - PubMed
    1. Calle E. E. et al. Overweight, obesity and mortality from cancer in a prospective studied cohort of U.S. adults. N Engl J Med 348, 1625–1638 (2003). - PubMed

Publication types