. 2016 Mar 22:17:140.
doi: 10.1186/s12859-016-0984-y.

pcaReduce: hierarchical clustering of single cell transcriptional profiles

Affiliations

pcaReduce: hierarchical clustering of single cell transcriptional profiles

Justina Žurauskienė et al. BMC Bioinformatics. .

Abstract

Background: Advances in single cell genomics provide a way of routinely generating transcriptomics data at the single cell level. A frequent requirement of single cell expression analysis is the identification of novel patterns of heterogeneity across single cells that might explain complex cellular states or tissue composition. To date, classical statistical analysis tools have being routinely applied, but there is considerable scope for the development of novel statistical approaches that are better adapted to the challenges of inferring cellular hierarchies.

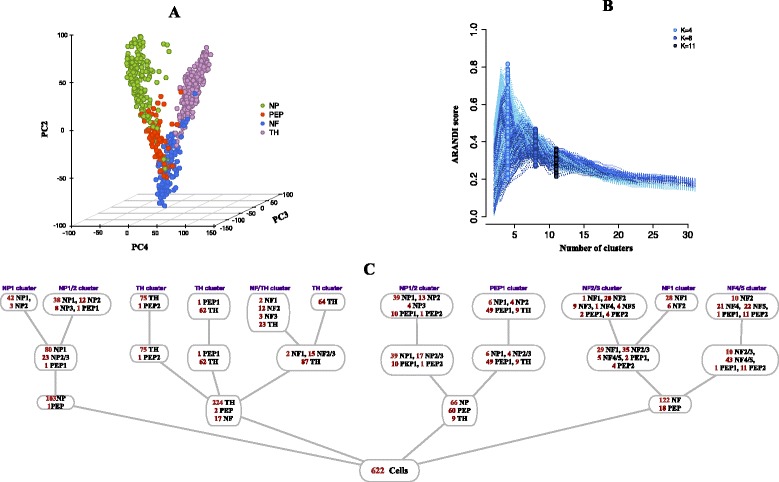
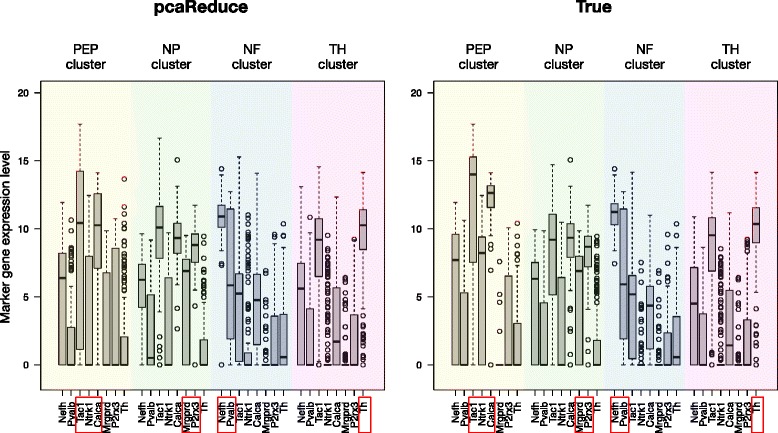
Results: We have developed a novel agglomerative clustering method that we call pcaReduce to generate a cell state hierarchy where each cluster branch is associated with a principal component of variation that can be used to differentiate two cell states. Using two real single cell datasets, we compared our approach to other commonly used statistical techniques, such as K-means and hierarchical clustering. We found that pcaReduce was able to give more consistent clustering structures when compared to broad and detailed cell type labels.

Conclusions: Our novel integration of principal components analysis and hierarchical clustering establishes a connection between the representation of the expression data and the number of cell types that can be discovered. In doing so we found that pcaReduce performs better than either technique in isolation in terms of characterising putative cell states. Our methodology is complimentary to other single cell clustering techniques and adds to a growing palette of single cell bioinformatics tools for profiling heterogeneous cell populations.

Keywords: Gene expression; Hierarchical clustering; Single cell RNA-Seq.


Figures

Fig. 1
Fig. 1
Cellular hierarchies. Three hierarchically related clustering structures for a single cell mouse neuronal dataset [27]. The data has been projected on to the first four principle directions, we report the three that allows best data visualisation; we used the given cellular labels to colour cells according to the a 4, b 8, and c 11 cell subtypes identified in the original study
Fig. 2
Fig. 2
Method illustration using an autoencoder network. Clustering is applied to the data representation at each linear hidden layer. If there are K−1 linear hidden units, the data is projected into a subspace spanned by the top K−1 principal components. Consistency between the clusterings at each layer is maintained by enforcing a hierarchical constraint. a Graphical interpretation of an autoencoder network(s). b Corresponding hierarchical structure
Fig. 3
Fig. 3
Application of pcaReduce to single cell RNA sequencing of 11 cell lines. a Projection of the data on to the first two principal components. b Performance of pcaReduce, the horizontal axis corresponds to a level in the hierarchical cluster structure reported by pcaReduce, the vertical axis show the Adjusted Rand Index (ARANDI) score between the tissue-level (green) and cell-line level labels (in blue) and the clustering reported by each level of the hierarchical clustering of pcaReduce. Each line correspond to a single run of pcaReduce using probabilistic sampling. c The most probable cellular hierarchy identified using pcaReduce
Fig. 4
Fig. 4
Performance comparison on cell line data. Classification performance against known a tissue-level and b cell-line level labels. All points and boxplots illustrate performance relative to the benchmark (Method 11) measured as ARANDI score. Numbers 1−11 correspond to clustering methods in table below. Blue and green circles for Methods 1-2 illustrate consensus clustering of 100 runs of pcaReduce algorithm with sampling and max merging settings respectively. Each point for Method 10 (SC3) corresponds to a different range of the parameter d. Further details can be found in Additional file 1: Figure S3
Fig. 5
Fig. 5
Application to single cell mouse neuronal data. a Data projected on to PC2-4 for visualisation and coloured by the four major neuronal cell types. b Clustering performance of pcaReduce. c Cellular hierarchy identified using pcaReduce, further details are given in Additional file 1: Figure S4
Fig. 6
Fig. 6
Performance comparison on mouse neuronal data. Boxplots illustrate the expression levels of marker genes that define four major neuronal classes. a Illustrates results obtained using pcaReduce algorithm, whereas (b) illustrate the ground truth. The information about marker genes was obtained from [27]

References

    1. Wang D, Bodovitz S. Single cell analysis: the new frontier in ‘omics’. Trends Biotechnol. 2010;28(6):281–90. doi: 10.1016/j.tibtech.2010.03.002. - DOI - PMC - PubMed
    1. Kalisky T, Quake SR. Single-cell genomics. Nat Methods. 2011;8(4):311–4. doi: 10.1038/nmeth0411-311. - DOI - PubMed
    1. Saliba AE, Westermann AJ, Gorski SA, Vogel J. Single-cell rna-seq: advances and future challenges. Nucleic Acids Res. 2014;42:8845–60. doi: 10.1093/nar/gku555. - DOI - PMC - PubMed
    1. Macaulay IC, Voet T. Single cell genomics: advances and future perspectives. PLoS Genet. 2014;10(1):1004126. doi: 10.1371/journal.pgen.1004126. - DOI - PMC - PubMed
    1. Shalek AK, Satija R, Shuga J, Trombetta JJ, Gennert D, Lu D, Chen P, Gertner RS, Gaublomme JT, Yosef N, Schwartz S. Single cell RNA Seq reveals dynamic paracrine control of cellular variation. Nature. 2014;510(7505):363. - PMC - PubMed

Publication types