. 2016 Oct;27(10):3204-3219.
doi: 10.1681/ASN.2015101121. Epub 2016 Mar 22.

Plasma Levels of Risk-Variant APOL1 Do Not Associate with Renal Disease in a Population-Based Cohort

Affiliations

Plasma Levels of Risk-Variant APOL1 Do Not Associate with Renal Disease in a Population-Based Cohort

Julia Kozlitina et al. J Am Soc Nephrol. 2016 Oct.

Abstract

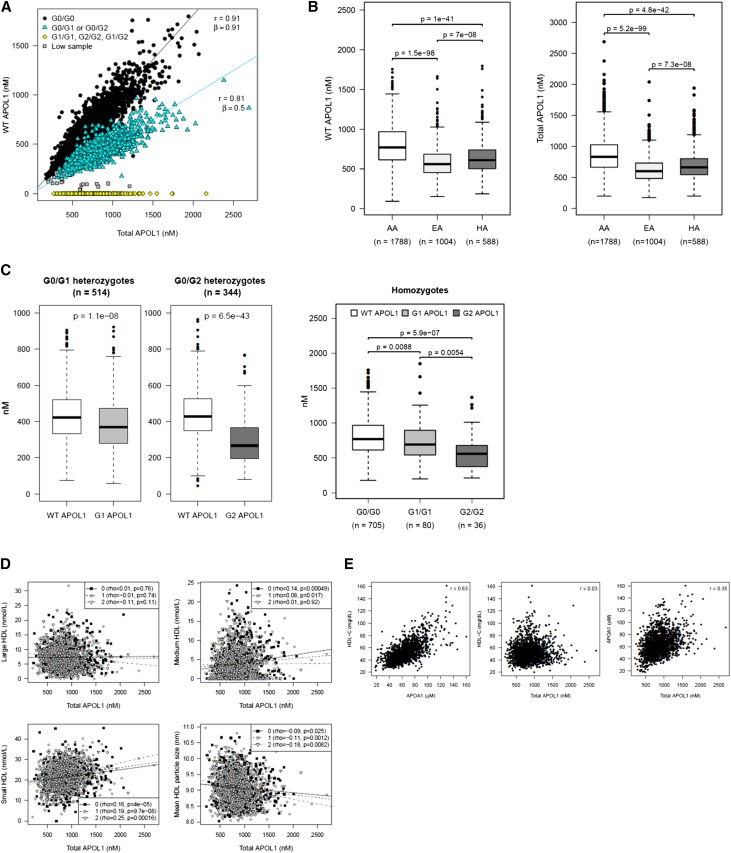
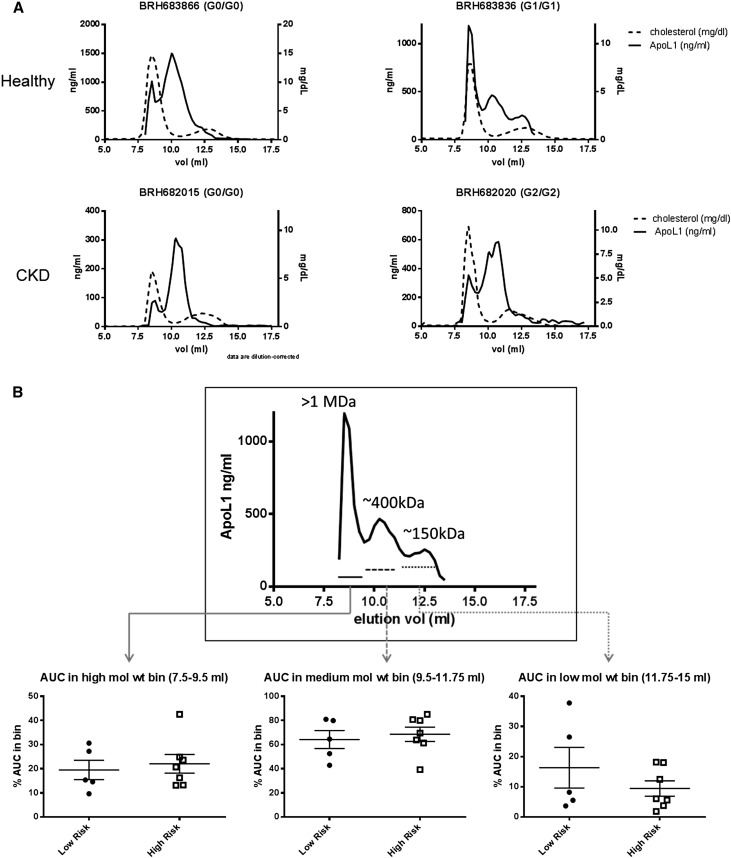
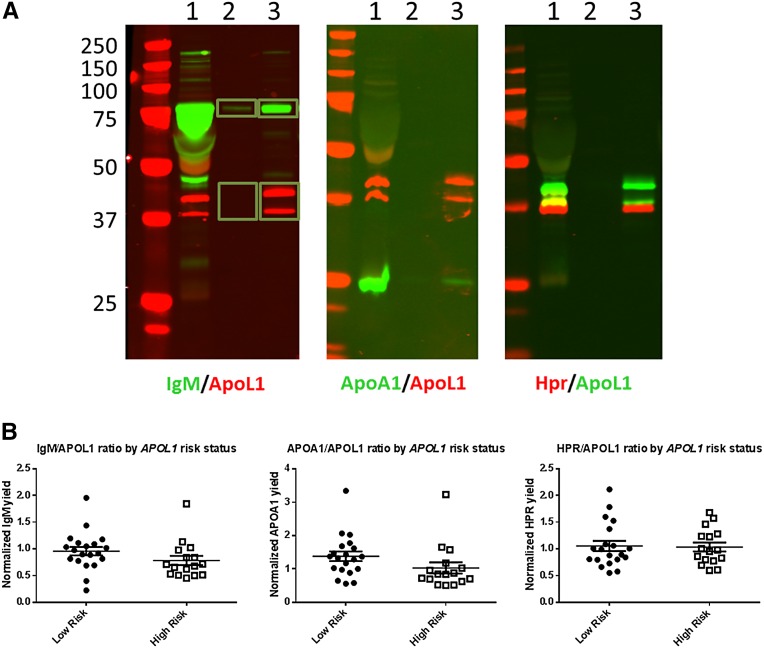
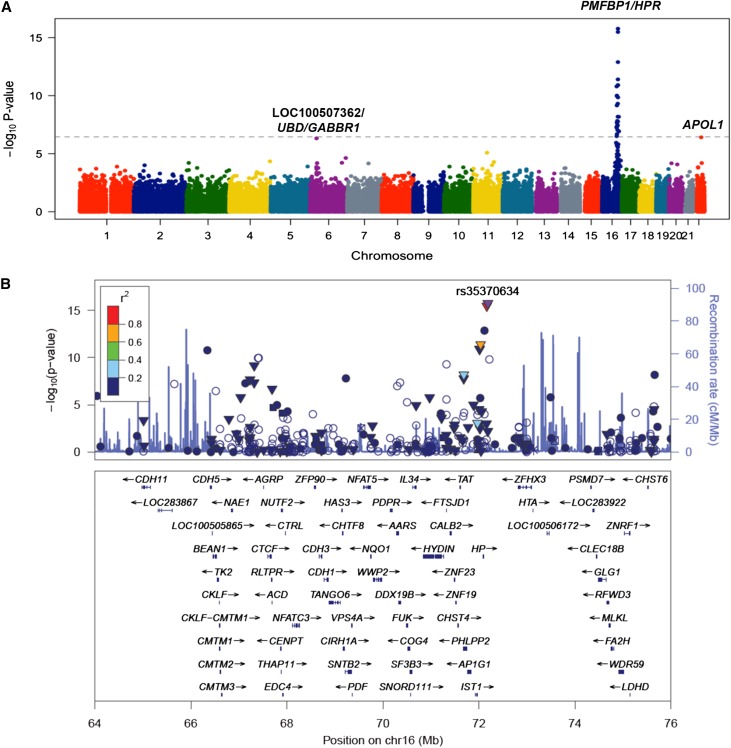
Two common missense variants in APOL1 (G1 and G2) have been definitively linked to CKD in black Americans. However, not all individuals with the renal-risk genotype develop CKD, and little is known about how APOL1 variants drive disease. Given the association of APOL1 with HDL particles, which are cleared by the kidney, differences in the level or quality of mutant APOL1‑HDL particles could be causal for disease and might serve as a useful risk stratification marker. We measured plasma levels of G0 (low risk), G1, and G2 APOL1 in 3450 individuals in the Dallas Heart Study using a liquid chromatography-MS method that enabled quantitation of the different variants. Additionally, we characterized native APOL1‑HDL from donors with no or two APOL1 risk alleles by size-exclusion chromatography and analysis of immunopurified APOL1‑HDL particles. Finally, we identified genetic loci associated with plasma APOL1 levels and tested for APOL1-dependent association with renal function. Although we replicated the previous association between APOL1 variant status and renal function in nondiabetic individuals, levels of circulating APOL1 did not associate with microalbuminuria or GFR. Furthermore, the size or known components of APOL1‑HDL did not consistently differ in subjects with the renal-risk genotype. Genetic association studies implicated variants in loci harboring haptoglobin-related protein (HPR), APOL1, and ubiquitin D (UBD) in the regulation of plasma APOL1 levels, but these variants did not associate with renal function. Collectively, these data demonstrate that the risk of renal disease associated with APOL1 is probably not related to circulating levels of the mutant protein.

Keywords: Epidemiology and outcomes; Pathophysiology of Renal Disease and Progression; chronic kidney disease; genetic renal disease; human genetics; risk factors.


Figures

Figure 1.
Figure 1.
Population characteristics of plasma APOL1 levels in the DHS. Data on G0, G1, or G2 APOL1 (LNILNN[NY]K) or full-length APOL1 (ALDNLAR) are presented. (A) APOL1 levels as determined by the carboxy‑terminal LNI peptide or the internal ALD peptide are highly correlated. The relationship was estimated by linear regression without an intercept. (B) Plasma APOL1 levels by ethnic status in DHS. APOL1 circulates at higher levels in black participants than in other ethnic groups. WT APOL1 refers to protein as quantified by the LNILNNNYK peptide. Total APOL1 refers to protein as quantified by the internal ALD peptide. (C) G1 and G2 APOL1, as measured by the LNI peptide, circulate at levels below G0 APOL1 in either one or two risk allele carriers. (D) APOL1, as measured by the ALD peptide, is poorly correlated with overall HDL levels, but is correlated with small HDL. (E) APOL1 is more significantly correlated with plasma APOA1 compared with HDL.
Figure 2.
Figure 2.
Size distribution of APOL1 particles in EDTA plasma from subjects with or without the RRG, with or without ESRD as measured by size-exclusion chromatography on a Superdex 200 column. (A) Representative chromatograms of total cholesterol (dashed) or APOL1 (solid) in neat plasma separated by size-exclusion chromatography. The cholesterol peak eluting at 8 ml represents LDL and VLDL eluting in the void volume of the column, the heterogeneous cholesterol peak between 12 and 13 ml represents HDL. A fraction of APOL1 consistently elutes with VLDL/LDL and represents IgM-bound APOL1. The remaining APOL1 elutes largely between the HDL peak and the void volume suggesting a mol wt greater than the bulk of the HDL pool. Traces from healthy subjects and subjects with ESRD with or without the RRG are shown. (B) APOL1 levels in the normalized high, medium and low mol wt pools in five subjects without the RRG or seven subjects with the RRG are shown. Differences between low- and high-risk genotypes were tested by t test. No statistically significant changes (P<0.05) were noted.
Figure 3.
Figure 3.
Analysis of the protein complement of APOL1‑HDL in subjects with or without the RRG. (A) Representative images of semiquantitative immunoblotting to determine the relative amounts of APOL1‑HDL proteins within the particle. APOL1‑HDL was immunopurified from EDTA plasma under detergent-free conditions, and proteins were eluted with Laemmli buffer and separated via SDS‑PAGE. One percent of input (lane 1) and 10% of immunopurified material from control (lane 2) or APOL1 (lane 3) immunoprecipitations was loaded in each lane and blotted with antibodies specific for the proteins noted under each image. Shown is an overlay of signal from the 680 nm channel (rabbit antibodies) and the 800 nm channel (mouse antibodies). Yellow indicates areas of overlap in the overlay. Signal was quantified separately for regions of interest for each channel. The yield of APOA1, HPR, and IgM were determined relative to the input amount and normalized for the yield of APOL1 calculated for each image. (B) APOL1‑HDL was purified from EDTA plasma using from 20 subjects without and 16 subjects without the RRG and the relative levels of known APOL1‑HDL associated proteins were determined by semiquantitative immunoblotting, as detailed above. Differences between low- and high-risk genotypes were tested by t test. No statistically significant changes (P<0.05) in the APOL1 normalized levels of IgM, APOA1, or HPR were noted.
Figure 4.
Figure 4.
Exome-wide association analysis for circulating APOL1 levels in DHS. (A) A Manhattan plot showing highly significant genome-wide association between the HPR locus on chromosome 16 and APOL1 levels. Each dot represents a SNP plotted against its chromosomal position on the x-axis and the strength of the association (–log10 P-value) on the vertical axis. The dashed line denotes the Bonferroni-corrected exome-wide significance threshold. (B) Regional plot of association with plasma total APOL1 levels at the HPR locus. Each dot represents a SNP plotted against its chromosomal position (using hg19 coordinates). The vertical axis shows –log10 P-values from single-SNP analysis for association with APOL1 levels. The most significant SNP at the locus is shown in purple color. The remaining SNPs are color-coded according to their linkage disequilibrium with the lead SNP as indicated by the color key. The strength of linkage disequilibrium is measured by pairwise R2 values based on the DHS data. Estimated recombination rates (from HapMap) are shown by the blue line, with spikes indicating locations of frequent recombination. Genes located in the region and the direction of transcription are noted below the plots based on the data from UCSC genome browser (www.genome.ucsc.edu). (▼) Nonsynonymous variants, (▪) coding variants, and (•) SNPs with no functional annotation and (○ ) noncoding variants. The plot was generated using LocusZoom software.

References

    1. Genovese G, Friedman DJ, Ross MD, Lecordier L, Uzureau P, Freedman BI, Bowden DW, Langefeld CD, Oleksyk TK, Uscinski Knob AL, Bernhardy AJ, Hicks PJ, Nelson GW, Vanhollebeke B, Winkler CA, Kopp JB, Pays E, Pollak MR: Association of trypanolytic ApoL1 variants with kidney disease in African Americans. Science 329: 841–845, 2010 - PMC - PubMed
    1. Tzur S, Rosset S, Shemer R, Yudkovsky G, Selig S, Tarekegn A, Bekele E, Bradman N, Wasser WG, Behar DM, Skorecki K: Missense mutations in the APOL1 gene are highly associated with end stage kidney disease risk previously attributed to the MYH9 gene. Hum Genet 128: 345–350, 2010 - PMC - PubMed
    1. Freedman BI, Langefeld CD, Andringa KK, Croker JA, Williams AH, Garner NE, Birmingham DJ, Hebert LA, Hicks PJ, Segal MS, Edberg JC, Brown EE, Alarcón GS, Costenbader KH, Comeau ME, Criswell LA, Harley JB, James JA, Kamen DL, Lim SS, Merrill JT, Sivils KL, Niewold TB, Patel NM, Petri M, Ramsey-Goldman R, Reveille JD, Salmon JE, Tsao BP, Gibson KL, Byers JR, Vinnikova AK, Lea JP, Julian BA, Kimberly RP Lupus Nephritis–End‐Stage Renal Disease Consortium : End-stage renal disease in African Americans with lupus nephritis is associated with APOL1. Arthritis Rheumatol 66: 390–396, 2014 - PMC - PubMed
    1. Kopp JB, Nelson GW, Sampath K, Johnson RC, Genovese G, An P, Friedman D, Briggs W, Dart R, Korbet S, Mokrzycki MH, Kimmel PL, Limou S, Ahuja TS, Berns JS, Fryc J, Simon EE, Smith MC, Trachtman H, Michel DM, Schelling JR, Vlahov D, Pollak M, Winkler CA: APOL1 genetic variants in focal segmental glomerulosclerosis and HIV-associated nephropathy. J Am Soc Nephrol 22: 2129–2137, 2011 - PMC - PubMed
    1. Larsen CP, Beggs ML, Saeed M, Walker PD: Apolipoprotein L1 risk variants associate with systemic lupus erythematosus-associated collapsing glomerulopathy. J Am Soc Nephrol 24: 722–725, 2013 - PMC - PubMed