. 2016 Mar 23:7:11017.
doi: 10.1038/ncomms11017.

VEGFR2 pY949 signalling regulates adherens junction integrity and metastatic spread

Affiliations

VEGFR2 pY949 signalling regulates adherens junction integrity and metastatic spread

Xiujuan Li et al. Nat Commun. .

Abstract

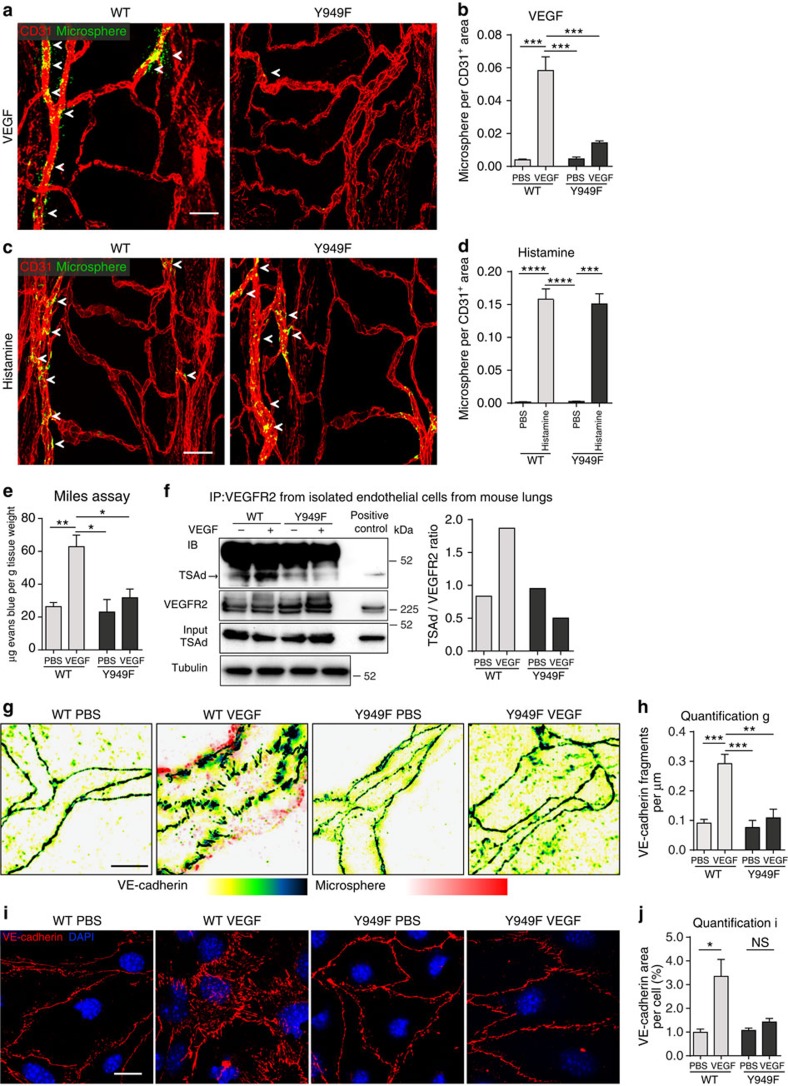
The specific role of VEGFA-induced permeability and vascular leakage in physiology and pathology has remained unclear. Here we show that VEGFA-induced vascular leakage depends on signalling initiated via the VEGFR2 phosphosite Y949, regulating dynamic c-Src and VE-cadherin phosphorylation. Abolished Y949 signalling in the mouse mutant Vegfr2(Y949F/Y949F) leads to VEGFA-resistant endothelial adherens junctions and a block in molecular extravasation. Vessels in Vegfr2(Y949F/Y949F) mice remain sensitive to inflammatory cytokines, and vascular morphology, blood pressure and flow parameters are normal. Tumour-bearing Vegfr2(Y949F/Y949F) mice display reduced vascular leakage and oedema, improved response to chemotherapy and, importantly, reduced metastatic spread. The inflammatory infiltration in the tumour micro-environment is unaffected. Blocking VEGFA-induced disassembly of endothelial junctions, thereby suppressing tumour oedema and metastatic spread, may be preferable to full vascular suppression in the treatment of certain cancer forms.


Figures

Figure 1
Figure 1. Arrest in VEGFA-induced vascular leakage in Vegfr2Y949F/Y949F mice.
(a) Tracheal vessel leakage in WT (left) and Vegfr2Y949F/Y949F (Y949F; right) mice after tail vein injection of VEGFA or PBS combined with 30 nm fluorescent microspheres (green). Arrows: microsphere leakage from CD31+ vessels (red). Scale bar, 50 μm. (b) Microsphere area per CD31-positive area fraction in VEGFA/PBS samples from a. n=3 mice per genotype. Two-way ANOVA: P(treatment)<0.0001; P(genotype)=0.001; P(interaction)=0.0008. (c) Tracheal vessel leakage in response to tail vein-injected histamine (as in a), in WT and Vegfr2Y949F/Y949F (Y949F) mice. (d) Microsphere area per CD31-positive area fraction in histamine/PBS samples from c. n=3–6 mice per genotype. Two-way ANOVA: P(treatment)<0.0001; P(genotype)=0.84; P(interaction)=0.80. (e) Evans' blue extravasation induced by VEGFA/PBS in the dermis of WT and Vegfr2Y949F/Y949F (Y949F) mice. Values were normalized to tissue weight. n=3 mice per genotype. Two-way ANOVA: P(treatment)=0.0053; P(genotype)=0.0206; P(interaction)=0.0482. (f) VEGFR2/TSAd complex formation in isolated mouse lung endothelial cells from WT and Vegfr2Y949F/Y949F (Y949F) mice, treated or not with VEGFA. Immunoprecipitation (IP) for VEGFR2 and immunoblotting for TSAd and VEGFR2. Total lysates were immunoblotted for TSAd and tubulin. Positive control, total lysate. Molecular weight markers to the right. (g) VE-cadherin immunostaining (yellow–black heatmap) on trachea from WT and Vegfr2Y949F/Y949F (Y949F) mice, tail vein-injected with VEGFA/PBS and microspheres (pink–red heatmap). Images were rendered using structured illumination microscopy. Note VE-cadherin rearrangement in VEGFA-injected WT trachea. Scale bar, 10 μm. (h) VE-cadherin fragments per μm vessel length from g. n=3–6 individual tissues per genotype. Total vessel length assessed: WT/PBS, 236 μm; WT/VEGFA, 308 μm; Y949F/PBS, 150 μm; and Y949F/VEGFA, 145 μm. Two-way ANOVA: P(treatment)=0.0022; P(genotype)=0.0065; P(interaction)=0.0164. (i) VE-cadherin immunostaining (red) on endothelial cells isolated from WT and Vegfr2Y949F/Y949F (Y949F) mouse lungs and then treated or not with VEGFA (100 ng ml−1). Hoechst 33342 (blue) staining shows nuclei. Scale bar, 20 μm. (j) VE-cadherin-positive staining per cell; samples generated as in i. n=30 cells per condition. Two-way ANOVA: P(treatment)=0.0189; P(genotype)=0.099; P(interaction)=0.0741. Data presented as mean±s.e.m. Two-way ANOVA with Tukey's post hoc test, *P<0.05, **P<0.01, ***P<0.001, ****P<0.0001. Experiments were performed at least three independent times.
Figure 2
Figure 2. Vegfr2Y949F/Y949F vessel parameters.
(a) Isolectin-B4 (IB4, red) and ERG (green) immunostaining on WT and Vegfr2Y949F/Y949F (Y949F) P6 retinal vasculature. Scale bar, 100 μm. (b) Tip cells numbers. n=3–4 retinas per genotype. (c) IB4-positive vessel area normalized to WT. n=3–4 retinas per genotype. (d) Radial vessel outgrowth normalized to WT. n=4–5 retinas per genotype. (e) Heatmap of VE-cadherin morphology in WT and Vegfr2Y949F/Y949F (Y949F) P6 retinas. Scale bar, 50 μm. (f) Retinal images in e processed for VE-cadherin morphology, lying within the vascular mask, into ‘patches' of 100 × 100 pixels (× 63, n=6 per group). The VE-cadherin morphology in each patch was hand-classified according to the classification key in g. (g) Adherens junctions classification from ‘active' (red; irregular/serrated morphology with diffuse/vesicular regions) to ‘inactive' (blue; straighter morphology with less vesicular staining). (h) Transmission electron microscopy analysis of kidney glomerulus and peritubular capillary (cap) show normal appearance of junctions (red arrows) and fenestrae (insets) in the two genotypes. (i) PV1 protein immunoblot in lung lysates after injection of PBS (P) or VEGFA (V) and circulation for 1–10 min (P1; injection of PBS and 1 min circulation and so on). GAPDH; equal loading. Molecular weight markers to the right. (j). Blood pressure 10 min after saline or VEGFA infusion, monitored in the ascending aorta. Values (positive or negative) show diastolic blood pressure (BP) normalized to BP before VEGFA/PBS injection (70 mm Hg; NS between genotypes). n=6–8 mice per genotype. Student's t-test, *P<0.05. Two-way ANOVA: P(treatment)=0.0001; P(genotype)=0.738; P(interaction)=0.5321. (k) CD31-positive (red) tracheal endothelium and desmin-positive (green) pericytes. Scale bar; 50 μm. (l) Pericyte area per total area from k. n=4 mice per genotype. (m) CD31-positive (red) tracheal endothelium and collagen IV-positive (green) basement membrane. Scale bar; 50 μm. (n) Collagen IV area per total area in m. n=3 mice per genotype. (o) RNAseq analysis of total lung polyA+ RNA. Data for selected endothelial genes as log10-scaled fold-change based on the frequency of normalized expression. For Vegfr2 (KDR) the Y949F mutant showed a −0.24 (DESeq2log2) fold decrease compared with WT. Data presented as mean±s.e.m. Student's t-test (bd) and Wilcoxon rank test (f); NS, not significant. Experiments were performed three independent times or performed once with at least three independent data sets (j,o).
Figure 3
Figure 3. Reduced glioblastoma permeability in Vegfr2Y949F/Y949F mice.
(a) GL261 glioma volumes at D18, estimated by measuring all tumour-containing sections in series throughout the brain of WT and Vegfr2Y949F/Y949F (Y949F) mice. n=13–14 mice per genotype. (b) Lectin-positive, perfused vessel density (area fraction per tumour area) at D18. n=12–14 mice per genotype. (c) Cadaverine-555 fluorescence intensity units estimated within the tumour (intratumoural) and at a 0–500-μm rim around the tumour border (peritumoural), Y949F normalized to WT. n=8–11 mice per genotype. (d) GL261 lectin-perfused vessels (lectin in green). Boxed area, typical point of leakage/disrupted barrier in the WT. (e) Cadaverine-555 (red) extravasation in WT and Y949F GL261 gliomas. Scale bar, 100 μm (d) and 50 μm (e). Data are presented as mean±s.e.m. Student's t-test, *P<0.05, **P<0.01. Experiments were performed three independent times. NS, not significant.
Figure 4
Figure 4. Reduced RIP1-TAg2 vascular leakage and metastatic spread in Vegfr2Y949F/Y949F.
(a) RIP1-TAg2 WT and Vegfr2Y949F/Y949F insulinoma tumour volumes at week 14. n=19–21 mice per genotype. (b) Angiogenic islet numbers at week 14. n=14–16 mice per genotype. (c) Tumour size distribution (1–5 and >5 mm diameter), week 14. n=17–19 mice per genotype. (d) Tumour cells (SV40 T antigen+; green) and vessels (CD31+; red) in RIP1-TAg2 insulinomas (left), Arrows; individual tumour cells associated with vessels. Scale bar, 100 μm. SV40 T antigen+ (green; upper) and haematoxylin-eosin (HE; lower) metastatic liver lesion (right). Scale bars, 50 μm. Number of liver metastases; mean per section, 30 sections per liver. n=11–17 mice per genotype. (e) Leakage of 30-nm microspheres (green; arrows) from VE-cadherin+ tumour vessels (red). Scale bar, 50 μm. (f) Microspheres area per VE-cadherin area from e. n=10–11 tumours per genotype. (g,h) VE-cadherin+ (red) and podocalyxin+ (green) RIP1-TAg2 tumour vasculature. Lower panels, magnification of boxed areas in upper panels. Arrows indicate typical disorganized podocalyxin in WT tumour vasculature. Scale bars, 50 μm (g), 5 μm (h). (i) VE-cadherin area, % of total area from g. n=15–17 tumours per genotype. (j) Podocalyxin area, % of total area from g. n=15–17 tumours per genotype. Data shown as mean±s.e.m. Student's t-test, *P<0.05, **P<0.01, NS, not significant. Data are pooled from three independent studies.
Figure 5
Figure 5. Reduced B16F10 vascular leakage and metastatic spread in Vegfr2Y949F/Y949F.
(a) Subcutaneous B16F10 tumour volumes for WT (blue) and Vegfr2Y949F/Y949F (Y949F; magenta) mice at different days after inoculation. n=14–15 mice per genotype. Repeated measures ANOVA: P(time)<0.0001; P(genotype)=NS. (b) CD31+ area per field in B16F10 tumours from WT and Y949F mice. n=21 mice per genotype at D12 and 11–16 mice per genotype at D18. (c) Area of tomato lectin-perfused vessels normalized to CD31+ area. n=21 mice per genotype, D12; and 11–16 mice per genotype at D18. *P<0.05. (d) Tumour vasculature (upper panels; CD31+ vessels; white) and perivascular fibrinogen deposition (lower panels, heatmap from red, high, to blue, low) in B16F10 tumours from WT and Vegfr2Y949F/Y949F mice at D12. Scale bars, 50 μm. (e) Fibrinogen+ area normalized to CD31+ area. n=22–27 mice per genotype at D12 and 13–14 mice per genotype at D18. Student's t-test, P=0.0310. (f) Oedema in B16F10 tumours estimated by weighing tumours before and after drying. Data show (wet weight−dry weight)/wet weight in % at D12 and D18. n=16-18 mice per genotype at D12 and 19–24 mice per genotype at D18. Student's t-test, P=0.0385. (g) Tumour volumes at D12 of TMZ or vehicle (dimethylsulfoxide)-treated mice with B16F10 tumours, receiving treatment between D4 and D8 after inoculation. n=12–15 mice per group. Kruskal–Wallis test, P=0.0289. (h) B16F10 tumour volumes in mouse ear. n=12–13 mice per genotype. Repeated measures ANOVA: P(time)<0.0001; P(genotype)=NS. (i) Spontaneous B16F10 lung metastasis spreading to the lungs from primary B16F10 tumours in the ear. dsred-B16F10 metastases in four longitudinal sections of each left main lung lobe were counted. n=12 mice per genotype. Mann–Whitney U, P=0.0028. Data shown as mean±s.e.m. Dashed lines in b,c,e and f indicate that data sets from D12 and D18 were not compared statistically. *P<0.05, **P<0.01, NS, not significant. Experiments were performed three independent times (ae,hj) or two times (f,g), and data were pooled.
Figure 6
Figure 6. VEGFA-induced signalling in Vegfr2Y949F/Y949F.
(a) VEGFR2 immunoprecipitation (IP) and immunoblotting (IB) for pY1173VEGFR2, VEGFR2, pY658VE-cadherin and VE-cadherin from lung lysates after tail vein injection of PBS (P) or VEGFA (V) in WT and Vegfr2Y949F/Y949F (Y949F) mice, followed by circulation for different time periods (P1, P2, P5: PBS injection and circulation for 1, 2 or 5 min; V1, V2, V5, V10, V15, V60: VEGFA injection and circulation for 1, 2, 5, 10, 15 or 60 min). Quantification shown to the right; n=4. Groups of early (V1–V2), intermediate (V5, V10, V15) and late (V60) time points were quantified. Phosphoform/total protein band densities were normalized to the mean of all PBS samples. Two-way ANOVA, upper (p1173VEGFR2): P(genotype)=0.032, P(time)=0.0009; lower (VE-cadherin): P(genotype) <0.0001, P(time)=0.0049. (b) VEGFA-induced accumulation of pY418 Src (upper) and pT308 Akt (lower) in total lung lysates (TLL) from Vegfr2Y949F/Y949F (Y949F) mice. Quantification as in a, relative to the unphosphorylated c-Src and Akt pools and normalized to mean PBS values. Two-way ANOVA, upper (Src): P(genotype)=0.0137, P(time)=NS; lower (Akt): P(genotype)=NS, P(time)=0.0013. (c) Quantification (top) of IB (bottom) for pY1173VEGFR2 and VEGFR2 in VEGFR2 immunoprecipitates (IP) from B16F10 tumours at D12 and D18 after inoculation of WT and Vegfr2Y949F/Y949F (Y949F) mice. n=19/WT D12, 14/WT D18, 15/Y949F D12 and 14/Y949F D18. (d) Quantification (top) of IB (bottom) for pY418Src and c-Src in VEGFR2 immunoprecipitates (IP) from tumour lysates as in c. n=19/WT D12, 13/WT D18, 14/Y949F D12 and 14/Y949F D18. (e) Quantification (top) of IB (bottom) for VEPTP and VEGFR2 on VEGFR2 immunoprecipitates (IP) from tumour lysates as in c. n=19/WT D12, 14/WT D18, 15/Y949F D12 and 14/Y949F D18 tumours. Data shown as mean±s.e.m. Dashed lines in ce indicate that data sets from D12 and D18 were not compared statistically. In a,b two-way ANOVA, with Sidak's post hoc test; in ce Student's t-test. *P<0.05, **P<0.01, ***P<0.0001, ****P<0.00001. Experiments were performed four independent times.
Figure 7
Figure 7. Schematic outline of Y949 signalling in VEGFA-regulated vascular permeability.
WT and Vegfr2Y949F/Y949F (Y949F) endothelial junctions are shown (upper). In the WT, the junction is active, that is, VE-cadherin is not engaged in homophilic interaction, and VEGFA signalling results in c-Src activation at junctions. In the Y949F mutant, VEGFR2 remains in complex with VEPTP and VE-cadherin, promoting junctional quiescence. c-Src may be activated but not at junctions. Lower schematics shows that junctional activation in the WT results in extravasation of cells and molecules, causing tissue oedema as well as metastatic spread via tumour cell intravasation into the blood stream (cells indicated in green). In the Y949F mutant, extravasation and oedema are blocked and metastatic spread is suppressed, while inflammatory cell extravasation is unaffected.

References

    1. Baluk P., Hashizume H. & McDonald D. M. Cellular abnormalities of blood vessels as targets in cancer. Curr. Opin. Genet. Dev. 15, 102–111 (2005). - PubMed
    1. Liao D. & Johnson R. S. Hypoxia: a key regulator of angiogenesis in cancer. Cancer Metastasis Rev. 26, 281–290 (2007). - PubMed
    1. Dejana E., Orsenigo F. & Lampugnani M. G. The role of adherens junctions and VE-cadherin in the control of vascular permeability. J. Cell Sci. 121, 2115–2122 (2008). - PubMed
    1. Goel S. et al.. Normalization of the vasculature for treatment of cancer and other diseases. Physiol. Rev. 91, 1071–1121 (2011). - PMC - PubMed
    1. Ebos J. M., Lee C. R. & Kerbel R. S. Tumor and host-mediated pathways of resistance and disease progression in response to antiangiogenic therapy. Clin. Cancer Res. 15, 5020–5025 (2009). - PMC - PubMed

Publication types

MeSH terms