. 2016 Mar 23:16:6.
doi: 10.1186/s12861-016-0104-2.

Long-term time-lapse live imaging reveals extensive cell migration during annelid regeneration

Affiliations

Long-term time-lapse live imaging reveals extensive cell migration during annelid regeneration

Eduardo E Zattara et al. BMC Dev Biol. .

Abstract

Background: Time-lapse imaging has proven highly valuable for studying development, yielding data of much finer resolution than traditional "still-shot" studies and allowing direct examination of tissue and cell dynamics. A major challenge for time-lapse imaging of animals is keeping specimens immobile yet healthy for extended periods of time. Although this is often feasible for embryos, the difficulty of immobilizing typically motile juvenile and adult stages remains a persistent obstacle to time-lapse imaging of post-embryonic development.

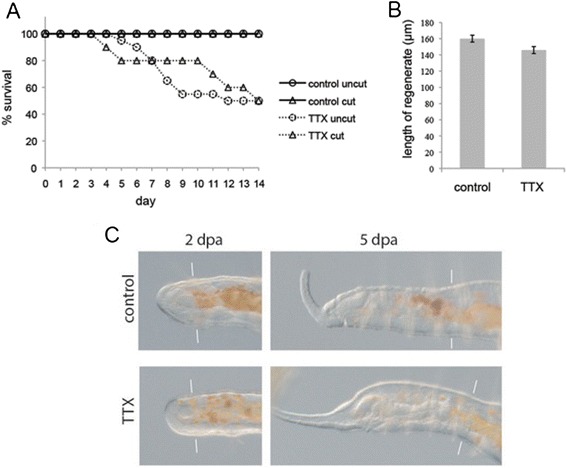
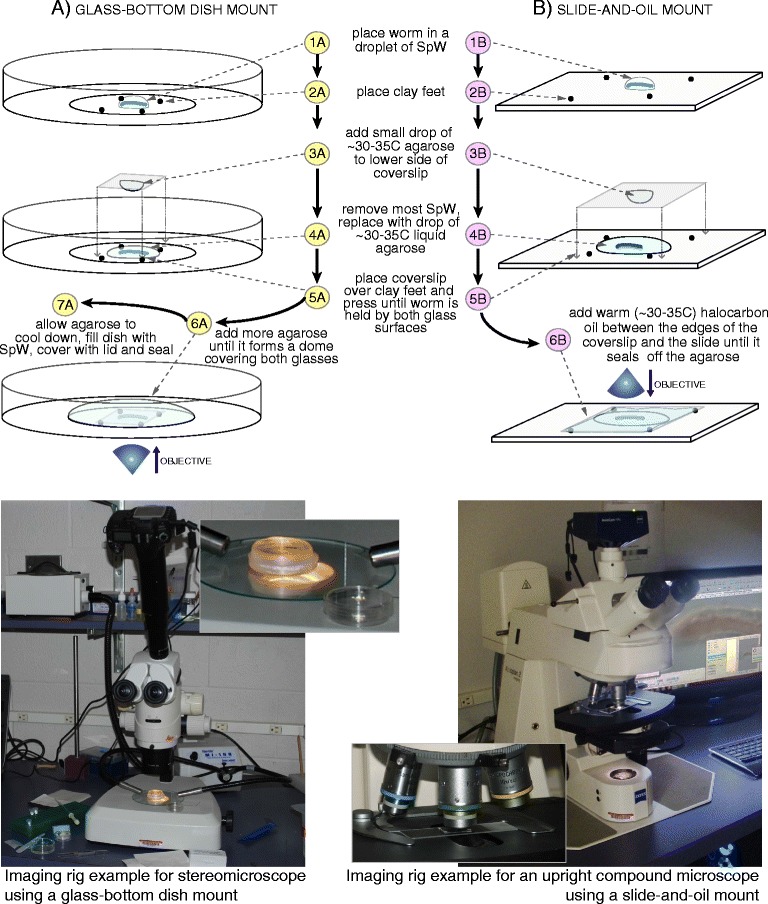
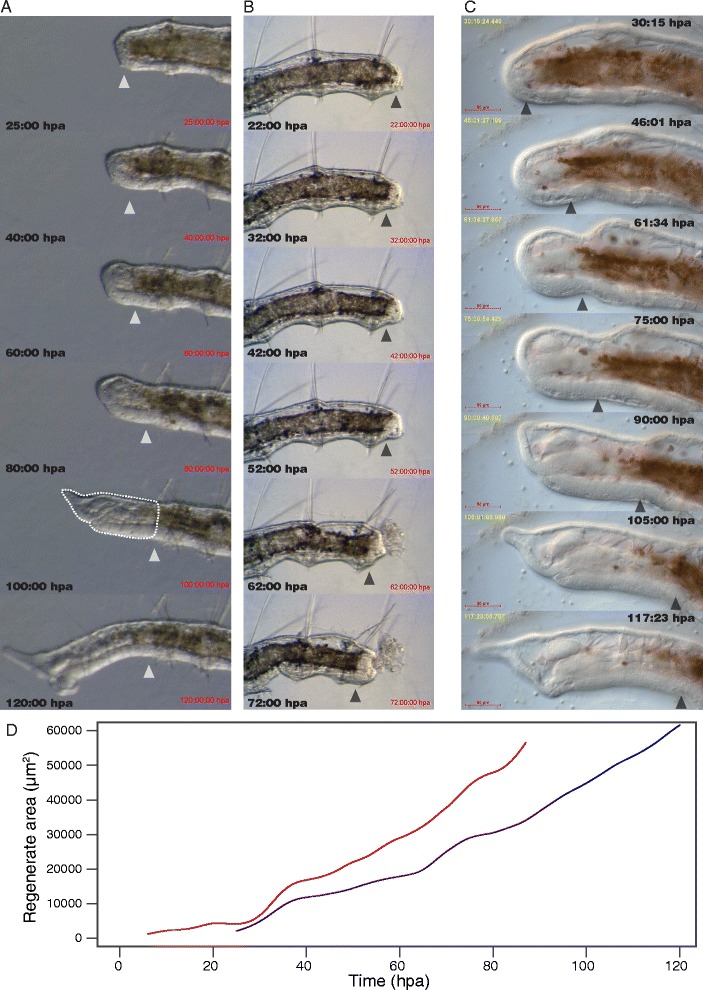
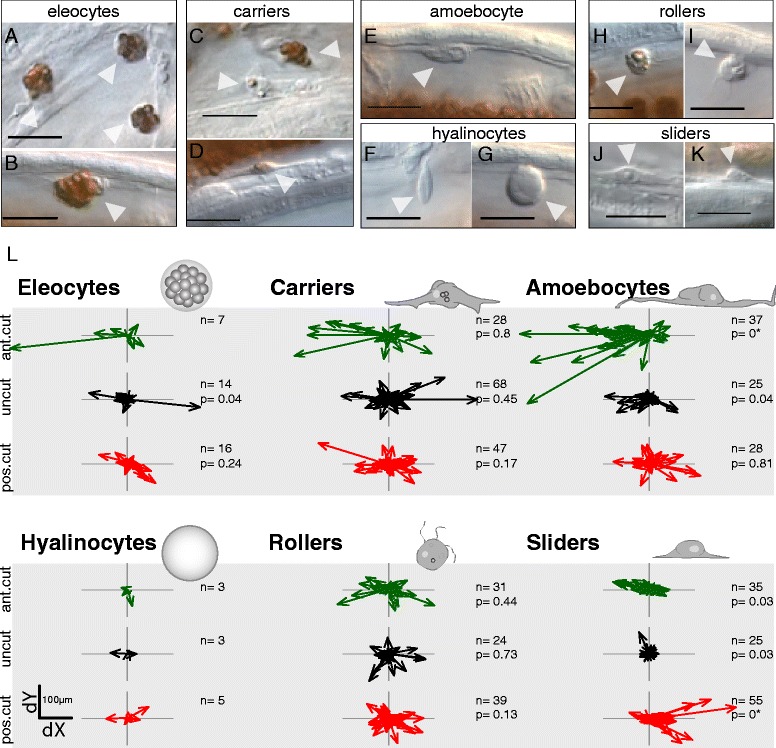
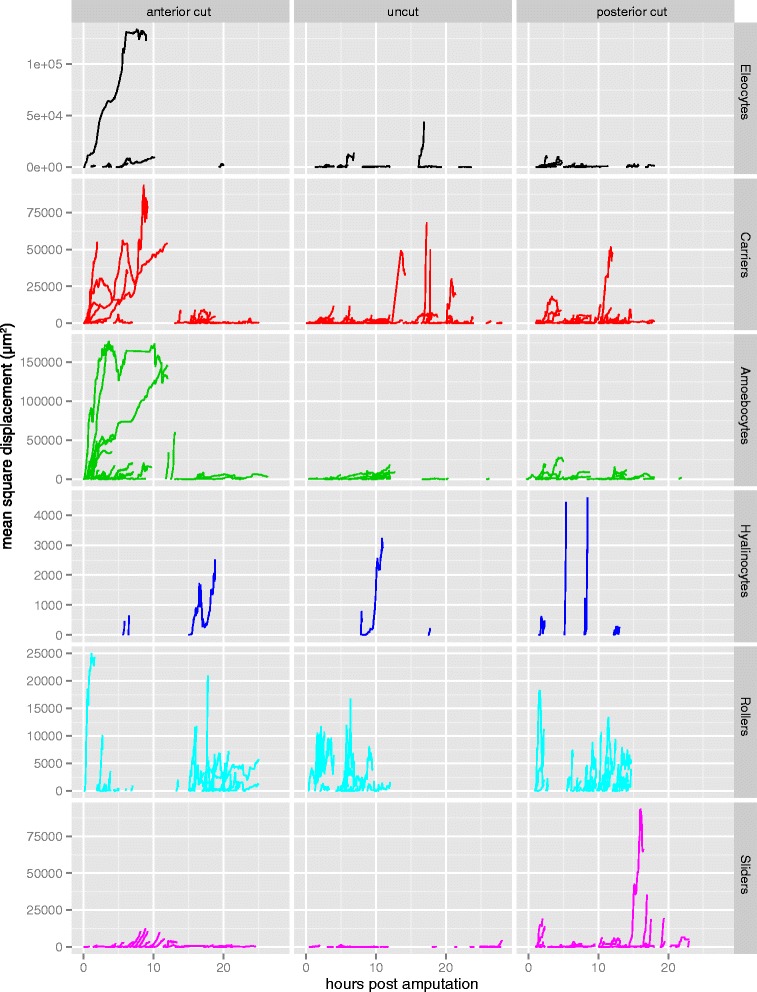
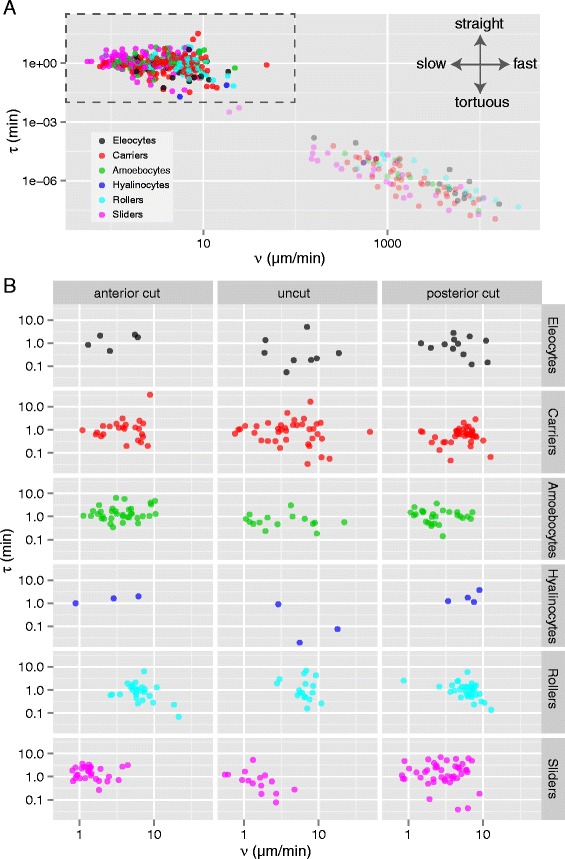
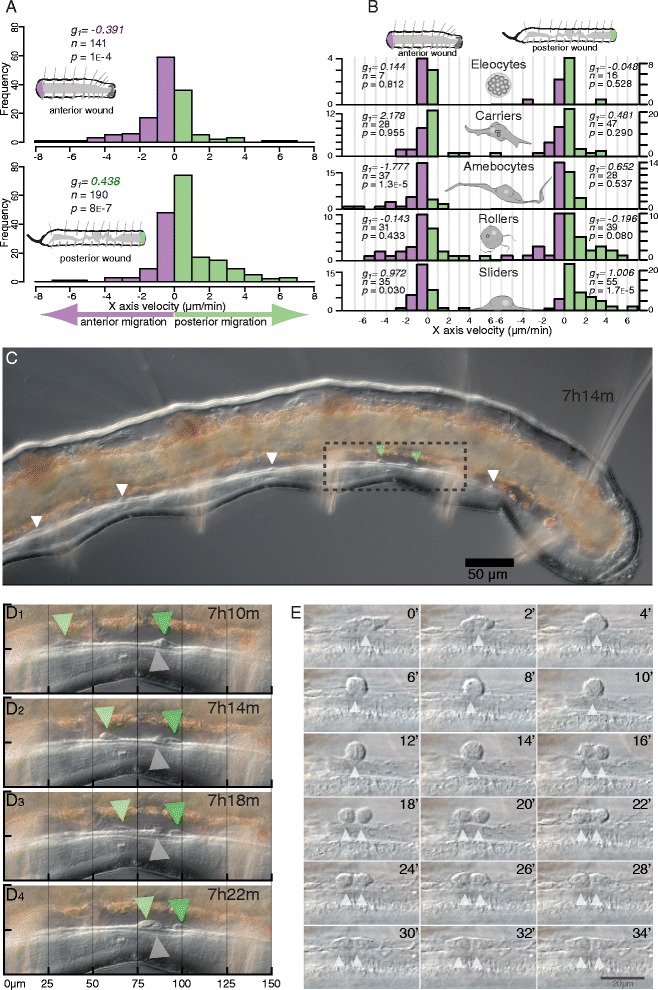
Results: Here we describe a new method for long-duration time-lapse imaging of adults of the small freshwater annelid Pristina leidyi and use this method to investigate its regenerative processes. Specimens are immobilized with tetrodotoxin, resulting in irreversible paralysis yet apparently normal regeneration, and mounted in agarose surrounded by culture water or halocarbon oil, to prevent dehydration but allowing gas exchange. Using this method, worms can be imaged continuously and at high spatial-temporal resolution for up to 5 days, spanning the entire regeneration process. We performed a fine-scale analysis of regeneration growth rate and characterized cell migration dynamics during early regeneration. Our studies reveal the migration of several putative cell types, including one strongly resembling published descriptions of annelid neoblasts, a cell type suggested to be migratory based on "still-shot" studies and long hypothesized to be linked to regenerative success in annelids.

Conclusions: Combining neurotoxin-based paralysis, live mounting techniques and a starvation-tolerant study system has allowed us to obtain the most extensive high-resolution longitudinal recordings of full anterior and posterior regeneration in an invertebrate, and to detect and characterize several cell types undergoing extensive migration during this process. We expect the tetrodotoxin paralysis and time-lapse imaging methods presented here to be broadly useful in studying other animals and of particular value for studying post-embryonic development.

Keywords: Annelid neoblast; Cell migration; Developmental dynamics; Growth rates; In-vivo studies; Regeneration; Time-lapse imaging.


Figures

Fig. 1
Fig. 1
Effect of tetrodotoxin on survival and regeneration in P. leidyi. a Survival in TTX-treated and Control worms that were Cut or Uncut. b Regenerate length on Day 5 after anterior amputation in TTX-treated and Control worms. c Representative images of anteriorly regenerating worms that were TTX-treated or not treated, on days 2 and 5 after amputation (worms are from same experiment as panel a). Paired white lines indicate approximate amputation plane. Anterior is to the left in this and all figures
Fig. 2
Fig. 2
Workflow for tetrodotoxin treatment and sample mounting using the glass-bottom dish method (a) and the slide-and-oil method (b). Procedure steps are numbered and pictures at bottom illustrate the imaging setups used in the present study
Fig. 3
Fig. 3
Time-lapse imaging and growth rate analysis during regeneration. a Frames from a time-lapse movie of anterior regeneration using a glass-bottom dish mount. Frames shown are 20 h apart, except for the first two frames shown which are 15 h apart. Dotted outline at 100 hpa illustrates how regenerate area was measured for growth rate analysis. b Frames from a time-lapse movie of posterior regeneration using a glass-bottom dish mount. Frames shown are 10 h apart. Defecation is evident in the 62 hpa frame, indicating the re-opening of the anus. c Frames from a time-lapse movie of anterior regeneration using a slide-and-oil mount. Frames shown are 15 h apart. In a-c, time is shown as hours post-amputation; amputation level is indicated by arrowheads. d Growth curves of anterior regenerate cross-sectional area over time for two different individuals (shown in red and purple).
Fig. 4
Fig. 4
Six migratory cell populations recognized from analysis of 4D datasets. a-k Images of representative cells of each putative cell type (white arrowheads). Scale bars: 20 μm. a Round eleocytes clinging to a septum and chaetal muscles. b Migrating eleocyte sliding along the dorsal body wall. c Two carrier cells near the ventral surface of the coelom; note the variable morphology and presence of one to many granular inclusions. d A carrier moving along the ventral body wall. e An amebocyte moving along the dorsal body wall; these cells can be distinguished from amoeboid carriers by their larger size and different movement behavior. f A fusiform hyalinocyte, clinging by one end from the dorsal body wall. g A round hyalinocyte with one side attached to the dorsal body wall. h A roller with granular inclusions moving along the dorsal body wall. i A roller without inclusions moving along the dorsal body wall; note the fine filopodia. j A slider moving anteriorly along the peritoneal lining of the lateral body wall. k A slider moving posteriorly along the dorsal surface of the ventral nerve cord. l Vector plots of overall XY plane displacement of individual cells in anterior amputees (green), uncut worms (black), and posterior amputees (red). Each arrow represents the difference between XY coordinates measured at the start and end of the track of one cell (i.e., longer arrows represent larger total displacements); vectors are not corrected for track duration. Scale for all plots is shown at lower left. Shown at right for each vector group are the sample size (n) and the p-value of Wilcoxon rank sum tests for the average X displacement being significantly different from zero (calculated only for groups where n > 10; p = 0* indicates p < 0.001)
Fig. 5
Fig. 5
Mean square displacement of individual cell trajectories across time (hours post amputation; hpa), for all three treatments (columns) and six cell types (rows). Overall displacement of migrating cells is highly variable within and between cell types, treatments, and developmental time. Note that the vertical axis scale varies between rows
Fig. 6
Fig. 6
Speed and directional memory of individual cell trajectories. Most cell types show a similar range of speeds and directional memory. a Scatterplot of the timescale of autocorrelation (τ, in min) versus mean tangential speed (ν, in μm/min) for all cell types. Note that both axes are shown in log10 scale. b Scatterplots of τ versus ν for individual treatments (rows) and cell types (columns) for all cells within the boxed area in a
Fig. 7
Fig. 7
Directional migration of cell types during regeneration. a-b Histograms of cell X-axis velocities, measured as overall X displacement of a track divided by the track total duration, for cells tracked in 5 anterior (top) and 5 posterior (bottom) amputees. Purple bars represent anterior migration (negative values); green bars represent posterior migration (positive values). g1: skewness; n: number of cell tracks; p: p-value for the Wilcoxon rank sum test. Plots are made for anterior amputees and posterior amputees for all cells combined (a) and for each cell type (b); hyalinocytes were not included due to low sample size. c Sample XY slice from a 4D dataset of a posterior amputee (mid-sagital plane, approximately 7.5 hpa). Arrowheads indicate migrating sliders; green arrowheads highlight sliders shown in d (boxed area). d Detail of four XY slices of the boxed region in c spaced 4 min apart. Two ventral sliders (green arrowheads) are moving posteriorly at different speeds (light green: faster, dark green: slower). A third cell of about the same size as the sliders (grey arrowhead) remains in the same location. e Detail of a 4D dataset of an anterior amputee showing mitotic activity of a migrating cell. Shown are 18 slices, each spaced 2 min apart. While moving in an anterior direction over the peritoneal lining of the lateral body wall, a slider stops, rounds-up, and divides; the daughter cells then regain the spindle shape. Notice the transient vertical structure at 12′, presumably a metaphase plate

References

    1. Boot MJ, Westerberg CH, Sanz-Ezquerro J, Cotterell J, Schweitzer R, Torres M, Sharpe J. In vitro whole-organ imaging: 4D quantification of growing mouse limb buds. Nat Meth. 2008;5:609–12. - PubMed
    1. Öztürk G, Erdoǧan E. Multidimensional long‐term time‐lapse microscopy of in vitro peripheral nerve regeneration. Microsc Res Tech. 2004;64:228–42. doi: 10.1002/jemt.20075. - DOI - PubMed
    1. Walsh MK, Quigley HA. In vivo time-lapse fluorescence imaging of individual retinal ganglion cells in mice. J Neurosci Methods. 2008;169:214–21. doi: 10.1016/j.jneumeth.2007.11.029. - DOI - PMC - PubMed
    1. Yamagata K, Ueda J. Long-term live-cell imaging of mammalian preimplantation development and derivation process of pluripotent stem cells from the embryos. Dev Growth Differ. 2013;55:378–89. doi: 10.1111/dgd.12048. - DOI - PubMed
    1. Funahashi J, Nakamura H. Time-lapse imaging system with shell-less culture chamber. Dev Growth Differ. 2014;56:305–9. doi: 10.1111/dgd.12132. - DOI - PubMed

Publication types