. 2016 Apr 26;7(17):24125-40.
doi: 10.18632/oncotarget.8214.

Targeting the epigenetic readers in Ewing sarcoma inhibits the oncogenic transcription factor EWS/Fli1

Affiliations

Targeting the epigenetic readers in Ewing sarcoma inhibits the oncogenic transcription factor EWS/Fli1

Camille Jacques et al. Oncotarget. .

Abstract

Ewing Sarcoma is a rare bone and soft tissue malignancy affecting children and young adults. Chromosomal translocations in this cancer produce fusion oncogenes as characteristic molecular signatures of the disease. The most common case is the translocation t (11; 22) (q24;q12) which yields the EWS-Fli1 chimeric transcription factor. Finding a way to directly target EWS-Fli1 remains a central therapeutic approach to eradicate this aggressive cancer. Here we demonstrate that treating Ewing Sarcoma cells with JQ1(+), a BET bromodomain inhibitor, represses directly EWS-Fli1 transcription as well as its transcriptional program. Moreover, the Chromatin Immuno Precipitation experiments demonstrate for the first time that these results are a consequence of the depletion of BRD4, one of the BET bromodomains protein from the EWS-Fli1 promoter. In vitro, JQ1(+) treatment reduces the cell viability, impairs the cell clonogenic and the migratory abilities, and induces a G1-phase blockage as well as a time- and a dose-dependent apoptosis. Furthermore, in our in vivo model, we observed a tumor burden delay, an inhibition of the global vascularization and an increase of the mice overall survival. Taken together, our data indicate that inhibiting the BET bromodomains interferes with EWS-FLi1 transcription and could be a promising strategy in the Ewing tumors context.

Keywords: EWS/Fli1; Ewing sarcoma; JQ1; bromodomain; epigenetic.


Conflict of interest statement

Dr. Bradner is the scientific founder of Tensha Therapeutics which has licensed drug like inhibitors of BET bromodomains from the Dana-Farber Cancer Institute for clinical translation as cancer therapeutics.

Figures

Figure 1
Figure 1. Ewing Sarcoma cell lines overexpress BRD2, BRD3, BRD4 and EWS-Fli1 at mRNAs level and are sensitive to BET proteins inhibition
(A) Expression of BRD2, BRD3, BRD4 and (B) EWS-Fli1 at mRNA levels was evaluated by qRT–PCR in human Ewing Sarcoma cell lines compared with human mesenchymal stem cells (MSCs). GAPDH and B2M are used as housekeeping genes. Error bars show standard deviation for n = 3 measurements from representative experiments. (C) Chemical structure of the two JQ1 enantiomers. (D) Human Ewing Sarcoma cell lines (A673, A673-1c, ASP14, EW7, EW24, IOR/BRZ, RDES, SKES-1, SK-N-MC, TC32 and TC71) were cultured for 48 hours in the presence of JQ1(+) at the indicated concentrations and cell growth was determined by WST-1 assay and compared with control (left panel). GI50 for JQ1(+) in tumor cell lines (right panel). These experiments were repeated at least twice. Error bars show standard deviation for n = 3 measurements from representative experiments.
Figure 2
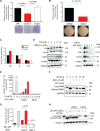
Figure 2. JQ1 inhibits the clonogenicity, the migratory potential and induces both a G1-phase cell cycle arrest and the apoptosis of human Ewing Sarcoma cell lines
(A) The TC71 Ewing Sarcoma cell line was plated at clonal density for colony numeration and treated with 4 μM JQ1(+) for 48 hours. Colony number was counted thanks to crystal violet staining performed after a 6-days incubation time and pictures of representative wells were taken. These experiments were repeated at least twice. Error bars shows standard deviation for n = 3 measurements from representative experiments. A two-tailed paired Student's t-test was used to compare the different conditions in the clonogenic assays. (B) The TC71 cells were cultured or not in presence of 4 μM JQ1(+) during 24 hours and were then plated in Boyden Chambers, always in presence of JQ1(+) for additional 48 hours. Error bars show the standard deviation for n = 8 measurements from representative experiments and a two-tailed paired Student's t-test was used to compare the different conditions. (C) The TC71 Ewing Sarcoma cell line was treated with 1 μM JQ1(+) for 48 hours and the proportion of cells in G1, S, and G2 phase was determined by propidium iodide staining. (D) The TC71 Ewing Sarcoma cell line was treated with 4 μM JQ1(+) for 3, 6, 24 or 30 hours and the cell cycle-related proteins Rb, phosphorylated-Rb, CCNE1and CCND1 expression levels were evaluated by Western blotting (left panel). The expression of the same proteins was assessed after treating or not the cells with JQ1(+) at 0.4, 4 or 8 μM during twenty-four hours (right panel). (E) TC71 cells were treated with 4 μM of JQ1(+) or JQ1(−) for 3, 6, 24, 30 or 48 hours, and the apoptosis was evaluated by dosage of the caspase 3/7 activities. (F) The TC71 cell line was treated with 4 μM JQ1(+) for 6, 16, 24 or 48 hours and apoptosis was evaluated by cleaved poly (ADP-ribose) polymerase (PARP) level by Western blotting. (G) The apoptosis was evaluated by dosage of the caspase 3/7 activity in the TC71 Ewing Sarcoma cell line after JQ1(+) or JQ1(−) treatment at 1 or 10 μM during 24 hours. (H) The same cell line was treated with 0.4, 4 or 8 μM JQ1(+) or JQ1(−) for 24 hours and apoptosis was evaluated by cleaved poly (ADP-ribose) polymerase (PARP) level by Western blotting. For all the Western blotting experiments, the Glyceraldehyde-3-phosphate dehydrogenase was used as a loading control. These experiments were repeated at least twice. For the caspase 3/7 activity assays, error bars shows standard deviation for n = 3 measurements from representative experiments. A two-tailed paired Student's t-test was used to compare the different conditions in these assays. For all the apoptosis assessment assays, a 6 hours Staurosporine (STS) treatment at 1 μM is used as a positive control.
Figure 3
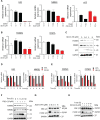
Figure 3. JQ1(+) treatment in Ewing Sarcoma cells induces a dose- and a time-dependent EWS-Fli1 down-regulation
(A) qRT–PCR for EWS-Fli1 RNA levels in DMSO or JQ1(+)-treated A673 and TC71 Ewing Sarcoma cell lines at different doses for 24 h. GAPDH and B2M expression are used as housekeeping genes. Error bars show standard deviation for n = 3 measurements from representative experiments. (B) The A673 (left panel) and TC71 (right panel) Ewing Sarcoma cell lines were treated with 0.4, 4 or 8 μM JQ1(+) for 24 hours and the EWS-Fli1 expression level was evaluated by Western blotting. Glyceraldehyde-3-phosphate dehydrogenase was used as a loading control. (C) qRT–PCR for EWS-Fli1 RNA levels in DMSO, JQ1(+)-treated A673 (left panel) and TC71 (right panel) Ewing Sarcoma cell lines at different time points, from one to nine hours (4 μM JQ1(+)). GAPDH and B2M are used as housekeeping genes. Error bars show standard deviation for n = 3 measurements from representative experiments. (D) Immunoblotting of the EWS-Fli1 expression in the same cell lines as represented in (C) treated by JQ1(+) for 6, 16, 24 or 48 hours at 1 μM. Actin was used as a loading control. (E) ChIP with a BRD4 antibody at three sites within the EWS-Fli1promoter region in A673 cells treated with 4 μM JQ1(+) for 5 h 30. Enrichment is shown as the percentage of total input DNA. Error bars show standard deviation for n = 3 measurements from representative experiments. The top track show the levels of enrichment of the H3K27Ac histone mark across the genome as determined by a ChIP-seq assay on seven cell lines from ENCODE. (F) The EWS-Fli1 expression was assessed at mRNA level in the ASP14 cell line treated or not with 1 μg/mL Doxycycline for 48 or 72 hours, to induce the shEWS-Fli1 transcription. The EWSFli1expression was assessed at mRNA level after qRT-PCR (upper panel) and at protein level after Immunoblotting (lower panel). GAPDH and B2M are used as housekeeping genes in the qRT-PCR assays. Error bars show standard deviation for n = 3 measurements from representative experiments. Glyceraldehyde-3-phosphate dehydrogenase was used as a loading control for the Western blotting. (G) ASP14 Ewing Sarcoma cells were treated or not with 1 μg/mL Doxycycline during 72 hours to induce the shEWS-Fli1 transcription and plated at clonal density for colony counts thanks to crystal violet staining performed after a 6-days incubation time. For all the clonogenic assays, error bars show the standard deviation for n = 6 measurements from representative experiments and a two-tailed paired Student's t-test was used to compare the different conditions. (H) ASP14 Ewing Sarcoma cells were treated or not with 1 μg/mL Doxycycline during 72 hours to induce the shEWS-Fli1 transcription and 2000 cells per well were seeded in 96-wells plates. The cells were then treated with 6.5 μM JQ1(+) or the same amount of DMSO. The cell viability was assessed after 48 hours by WST-1 assay. Error bars show the standard deviation for n = 3 measurements from representative experiments and a two-tailed paired Student's t-test was used to compare the different conditions.
Figure 4
Figure 4. JQ1(+) treatment in Ewing Sarcoma cells induces a dose- and a time-dependent modulation of pathways under the control of EWS-Fli1
(A) qRT–PCR for EWS-Fli1 direct-target genes (Gli1, NR0B1 and p21) and (B) EWS-Fli1indirect-target genes (FOXM1 and VEGFA) in DMSO or JQ1(+)-treated Ewing Sarcoma A673 cell line during 24 h, at 1 and 10μM JQ1(+). (C) FOXM1-, NR0B1- and p21-EWS-Fli1-target gene expression was evaluated at protein level by Immunoblotting in the A673 Ewing Sarcoma cell line after JQ1(+) treatment at 0.4, 4 or 8 μM during 24 h. Glyceraldehyde-3-phosphate dehydrogenase was used as a loading control. (D) qRT–PCR for EWS-Fli1 direct target genes (Gli1and NR0B1) and (E) EWS-Fli1 indirect-target genes (FOXM1 and CCND1) in DMSO (Veh.) or JQ1- (+)-treated Ewing Sarcoma A673 cells at 4 μM during 1, 2, 5, 9 and 24 hours. (F) FOXM1-, NR0B1- and p21-EWS-Fli1-target gene expression was evaluated at protein level by Immunoblotting in the A673 Ewing Sarcoma cell line after JQ1(+) treatment or not during 3, 6, 24, or 30 hours. (G) ERK ½ phosphorylation level was evaluated by Immunoblotting in the A673 Ewing Sarcoma cell line after a 24 hours JQ1(+) treatment at 0.4, 4 or 8 μM or after a 4 μM JQ1(+) treatment during 3, 6, 24, or 30 hours (H). All the Western blots were performed at least twice and representative blots are presented. Glyceraldehyde-3-phosphate dehydrogenase was used as a loading control. For all the qRT-PCR, GAPDH and B2M are used as housekeeping genes and error bars show standard deviation for n = 3 measurements from representative experiments.
Figure 5
Figure 5. JQ1(+) significantly delays tumor growth in TC71 xenograft model and prolongs cancer-specific survival
(A) Experimental design: 1.5 million TC71 Ewing Sarcoma cells were injected paratibially in nude mice. Mice were IP injected with 50 mg/kg JQ1(+) or vehicle (10% HP-β-CD) twice a day for the indicated time when tumor volume reached 100 mm3. (B) The mean tumor volume of mice treated was compared with control group ± s.e.m (n = 8 mice in each group).Two-way ANOVA statistical test was used. (C) In Kaplan–Meier curves, cancer-specific survival were compared between mice treated with JQ1(+) and control. The log-rank (Mantel-Cox) test was used to compare the overall survival between groups. (D) EWS-Fli1, Gli1, p21, FOXM1, VEGFA and CCND1 expressions were evaluated in tumor tissues, after RNA extraction, by qRT–PCR. For all the qRT-PCR, GAPDH and B2M are used as housekeeping genes. Unpaired two-tailed t-test was used to compare the gene expression between groups. (E) Tumors were collected at the time of euthanasia and Ki67 was evaluated by immunohistochemical analysis (original magnification, 200; scale bar, 100 μm). (F) Tumors were collected at the time of euthanasia and caspase 3 activity was evaluated by immunohistochemical analysis (original magnification, 50; scale bar, 250 μm). (G) Tumors were collected at the time of euthanasia and CD146 staining was performed by immunohistochemical analysis (left panel). The size of vessels (right panel) was also calculated thanks to the Image J software. For each mouse, ten pictures were taken and were scored and estimated in % of positive cells ± s.d. for DAB activity, in the delimited region of interest (ROI) within the tumor. Error bars show s.d. for n = 80 pictures.

Similar articles

Cited by

References

    1. Bernstein M, Kovar H, Paulussen M, Randall RL, Schuck A, Teot LA, Juergens H. Ewing's sarcoma family of tumors: current management. Oncologist. 2006;11:503–519. - PubMed
    1. Ewing J, Classics in oncology. Diffuse endothelioma of bone. James Ewing. Proceedings of the New York Pathological Society, 1921. CA Cancer J Clin. 1972;22:95–98. - PubMed
    1. Schuck A, Ahrens S, Paulussen M, Kuhlen M, Konemann S, Rube C, Winkelmann W, Kotz R, Dunst J, Willich N, Jurgens H. Local therapy in localized Ewing tumors: results of 1058 patients treated in the CESS 81, CESS 86, and EICESS 92 trials. Int J Radiat Oncol Biol Phys. 2003;55:168–177. - PubMed
    1. Grier HE, Krailo MD, Tarbell NJ, Link MP, Fryer CJ, Pritchard DJ, Gebhardt MC, Dickman PS, Perlman EJ, Meyers PA, Donaldson SS, Moore S, Rausen AR, et al. Addition of ifosfamide and etoposide to standard chemotherapy for Ewing's sarcoma and primitive neuroectodermal tumor of bone. N Engl J Med. 2003;348:694–701. - PubMed
    1. Paulussen M, Craft AW, Lewis I, Hackshaw A, Douglas C, Dunst J, Schuck A, Winkelmann W, Kohler G, Poremba C, Zoubek A, Ladenstein R, van den Berg H, et al. Results of the EICESS-92 Study: two randomized trials of Ewing's sarcoma treatment—cyclophosphamide compared with ifosfamide in standard-risk patients and assessment of benefit of etoposide added to standard treatment in high-risk patients. J Clin Oncol. 2008;26:4385–4393. - PubMed

MeSH terms