. 2016 Apr 5;113(14):3820-5.
doi: 10.1073/pnas.1601252113. Epub 2016 Mar 22.

Putative oncogene Brachyury (T) is essential to specify cell fate but dispensable for notochord progenitor proliferation and EMT

Affiliations

Putative oncogene Brachyury (T) is essential to specify cell fate but dispensable for notochord progenitor proliferation and EMT

Jianjian Zhu et al. Proc Natl Acad Sci U S A. .

Abstract

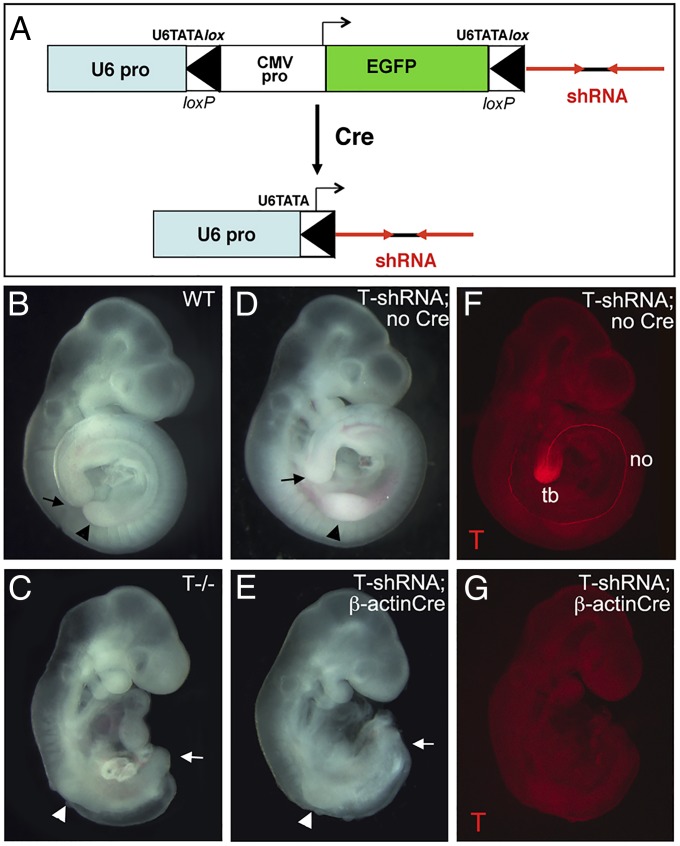
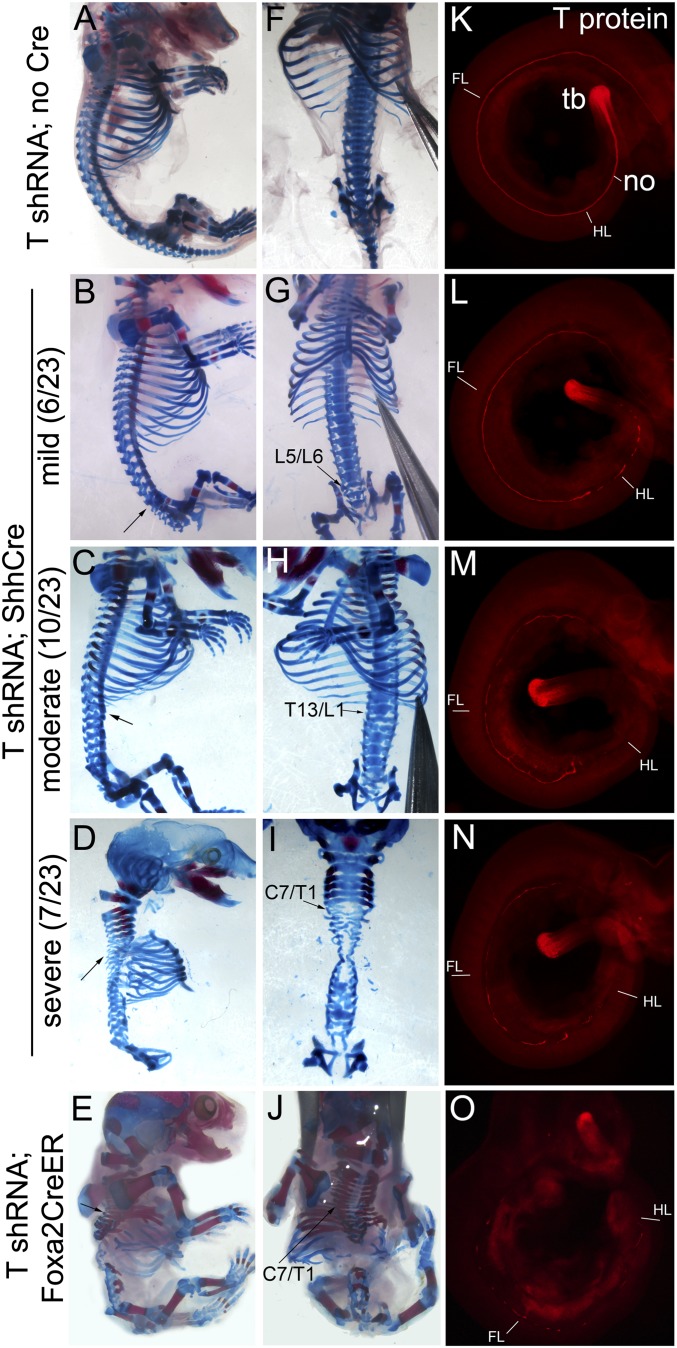
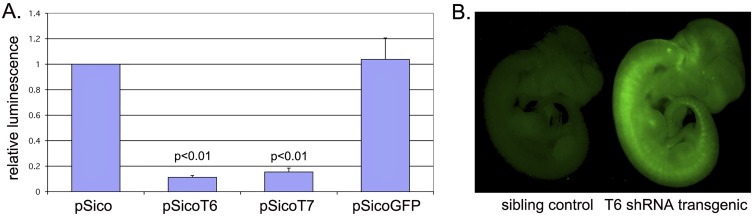
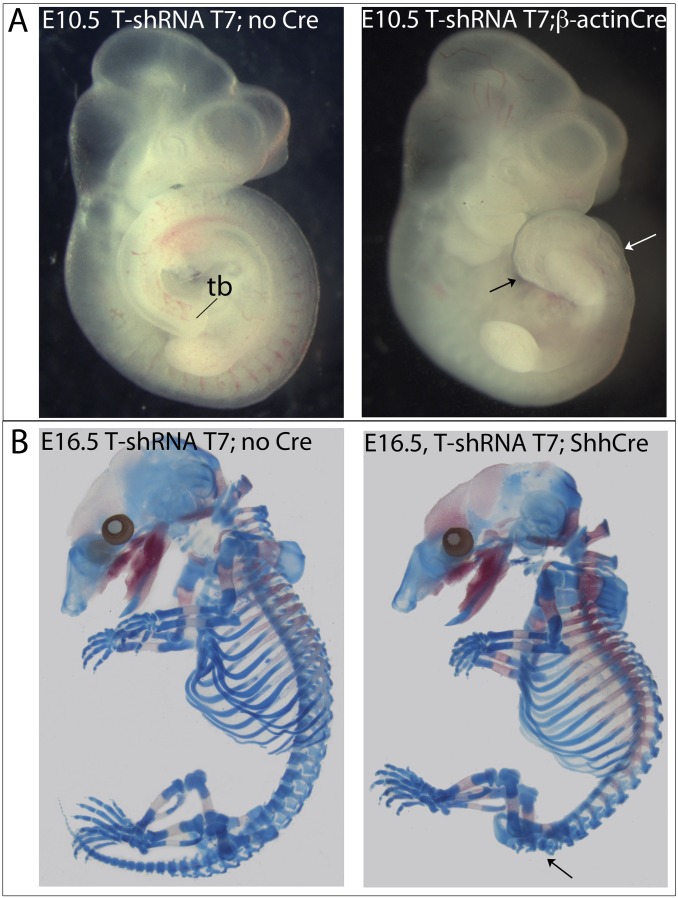
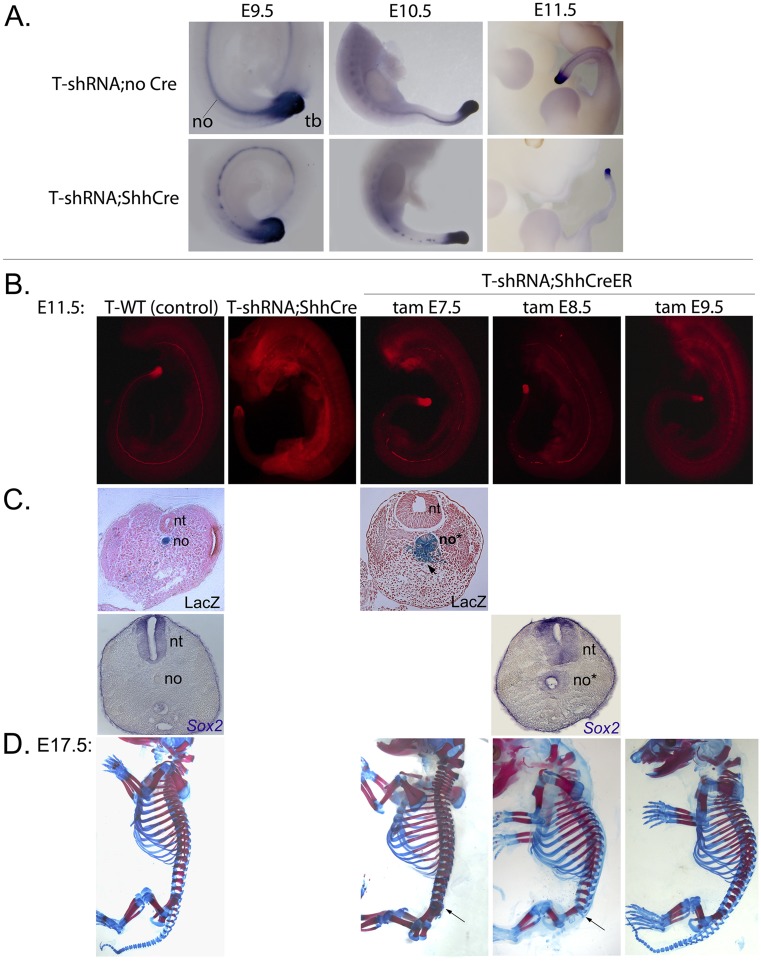
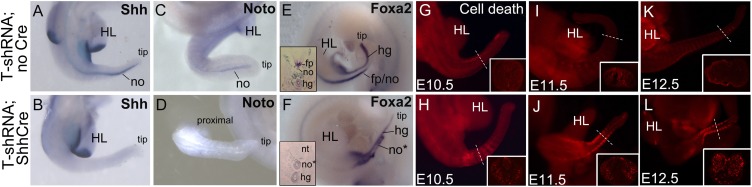
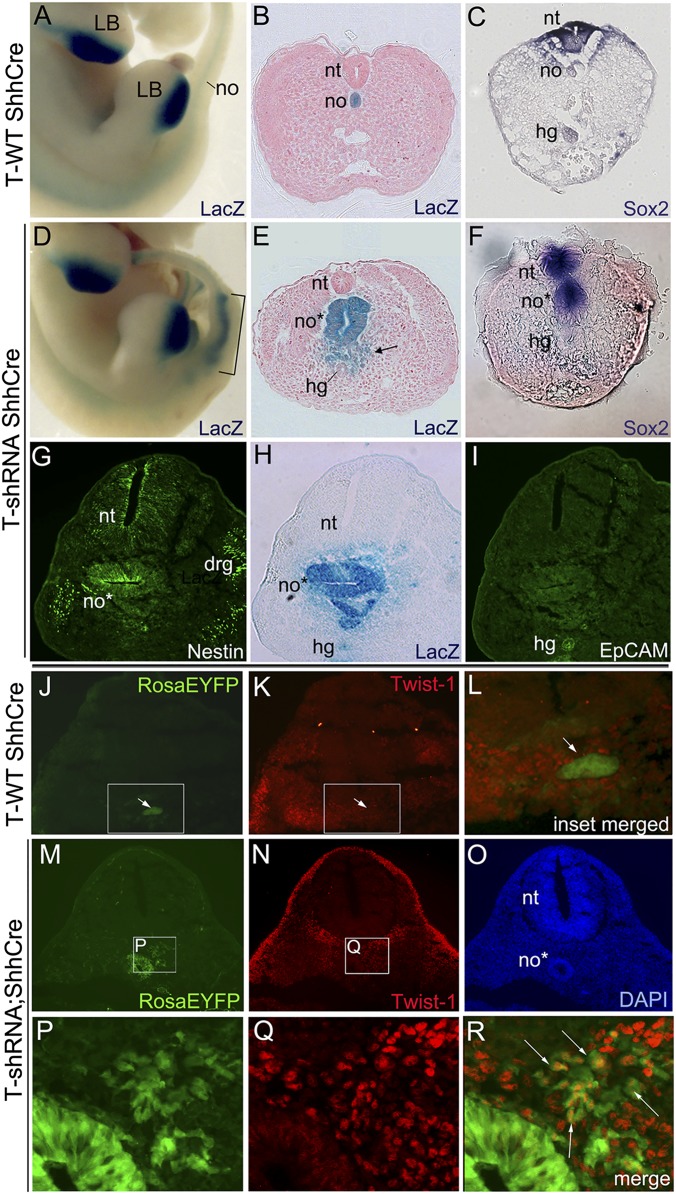
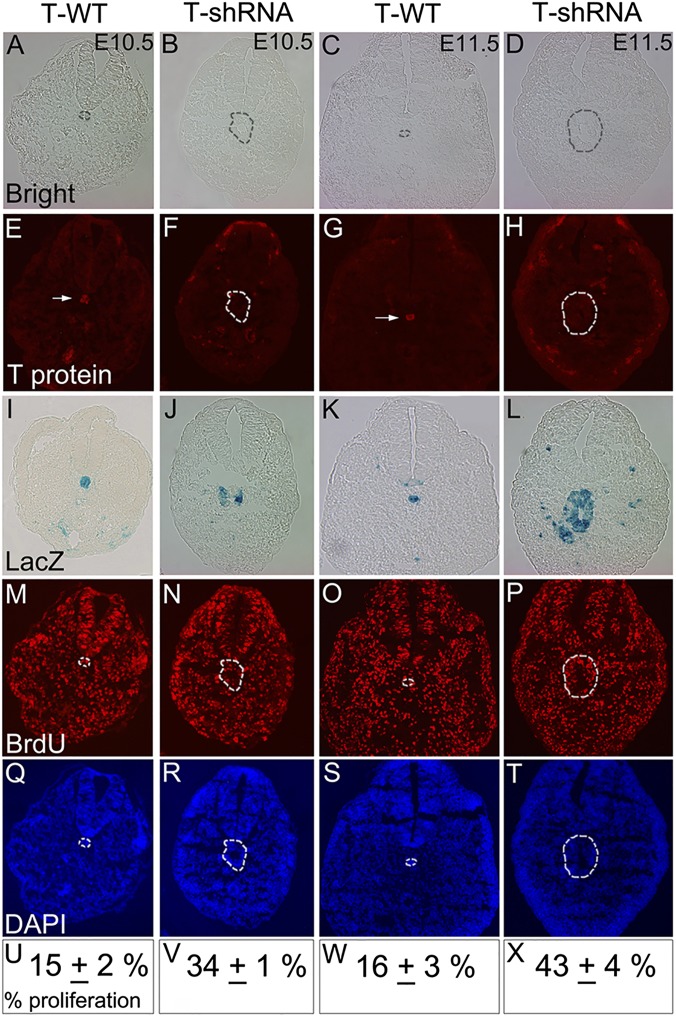
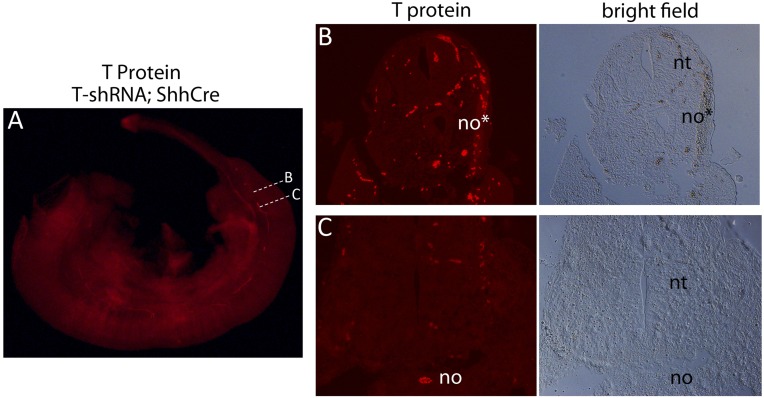
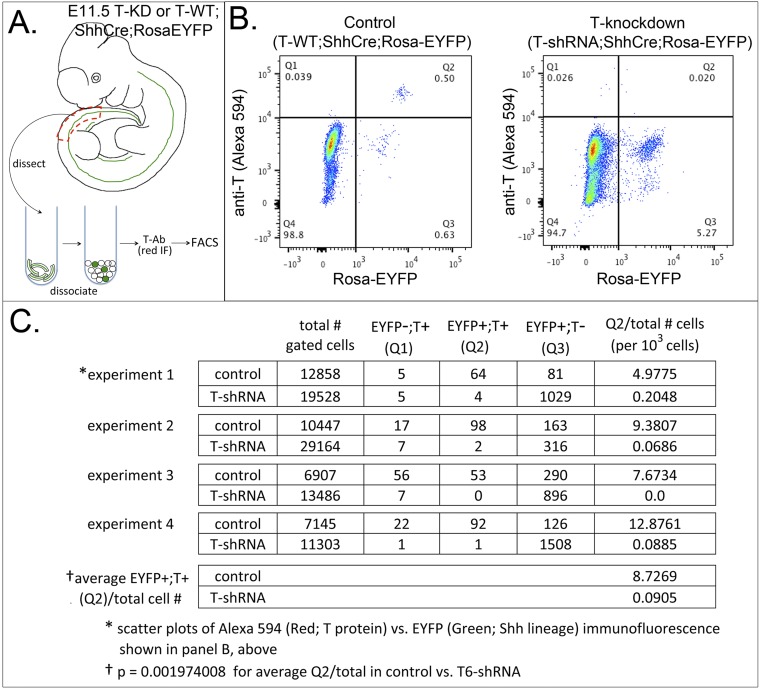
The transcription factor Brachyury (T) gene is expressed throughout primary mesoderm (primitive streak and notochord) during early embryonic development and has been strongly implicated in the genesis of chordoma, a sarcoma of notochord cell origin. Additionally, T expression has been found in and proposed to play a role in promoting epithelial-mesenchymal transition (EMT) in various other types of human tumors. However, the role of T in normal mammalian notochord development and function is still not well-understood. We have generated an inducible knockdown model to efficiently and selectively deplete T from notochord in mouse embryos. In combination with genetic lineage tracing, we show that T function is essential for maintaining notochord cell fate and function. Progenitors adopt predominantly a neural fate in the absence of T, consistent with an origin from a common chordoneural progenitor. However, T function is dispensable for progenitor cell survival, proliferation, and EMT, which has implications for the therapeutic targeting of T in chordoma and other cancers.

Keywords: Brachyury; EMT; cell fate; notochord.


Conflict of interest statement

The authors declare no conflict of interest.

Figures

Fig. 1.
Fig. 1.
Construction and efficacy of conditional T-shRNA transgenic line. (A) Schematic diagram showing Cre-inducible shRNA approach. U6 promoter is interrupted by an EGFP expression cassette flanked by loxP sites and inserted into the TATA box. Cre-mediated recombination reconstitutes U6 promoter, activating shRNA expression (15). (B–E) T-shRNA (T6) induced by early ubiquitous β-ActinCre results in truncation caudal to the forelimb level (arrowheads) in E9.5 embryos (15 of 15 embryos), recapitulating T−/− phenotype. Arrows mark caudal axis extent. In the absence of Cre, T-shRNA transgenic embryos develop similarly to WT. (F and G) T-protein immunofluorescence at E9.5 is completely absent in T-shRNA;β-actinCre embryos, whereas strong expression is seen in both notochord (no) and tail bud (tb) in control embryos.
Fig. 2.
Fig. 2.
Phenotypes and T-protein levels in embryos with notochord-selective T knockdown. All analyses for this and subsequent figures (Figs. 3–5 and Figs. S1 and S3–S5) were performed using T6-shRNA allele. (A–E) Lateral and (F–J) frontal views of E17.5 skeletal phenotypes in T-shRNA;ShhCre and T-shRNA;Foxa2CreER (tamoxifen at E6.5) embryos compared to (A and F) sibling controls. T-shRNA;Cre+ embryos are categorized according to severity of vertebral loss/malformations (arrows mark rostral level) into (B and G) mild (lumbosacral; 6 of 23 embryos), (C and H) moderate (upper lumbar; 10 of 23 embryos), and (D and I) severe (upper thoracic level; 7 of 23 embryos). In (D, F, H, and I) the hind limbs (F and H), both limbs (D), or limbs plus rib cage (I) were removed to better visualize the entire vertebral column. (K–O) Immunofluorescence for T-protein in T-shRNA;ShhCre and T-shRNA;Foxa2CreER (tamoxifen at E6.5) embryos compared to (K) sibling control. T-protein loss is extensive in notochord (no) of T-shRNA;Foxa2CreER and occurs at varying axial levels in T-shRNA;ShhCre embryos at E10.5, but is completely preserved in tail bud (tb). Notochord T-protein loss in T-shRNA;ShhCre embryos becomes more complete at later stage (Fig. S3). Positions of forelimb (FL) and hind limb (HL) bud posterior borders are indicated in K–O.
Fig. S1.
Fig. S1.
Efficiency of T-RNA removal by T6- and T7-shRNA in cultured cells and example of shRNA-vector EGFP cassette expression in transgenic embryos. (A) Efficiency of different T-shRNAs (T1–T7) was assessed by measuring activity of a chimeric Renilla luciferase reporter containing the full-length mouse T-transcript sequence fused to the 3′ end of the luciferase coding region compared with that of the firefly luciferase control. T-shRNAs were cloned into a recombined active version of the pSico vector (EGFP cassette removed) and were cotransfected into NIH 3T3 cells with the chimeric T-luciferase gene to screen for knockdown efficiencies. Empty vector (pSico) and a GFP-shRNA (pSicoGFP) were included as negative controls. Both T6- and T7-shRNAs (shown in A) achieved considerable knockdown of the T-luciferase chimera, averaging 89% for T6-shRNA and 84% for T7-shRNA. The bar graph represents averages from five independent experiments. Statistical significance (P) of difference in normalized luciferase activity was determined using Student’s two-tailed t test. Other shRNAs tested (Table S1) gave knockdown efficiencies ranging between 54% and 75%. (B) Ubiquitous expression of GFP cassette in transgenic pSico-shRNA embryos in the absence of Cre-mediated recombination.
Fig. S2.
Fig. S2.
Early tail bud and late skeletal phenotypes in T7-shRNA T-knockdown embryos. (A) T7-shRNA induced by early ubiquitous β-actinCre results in posterior axis truncation at the sacral level, with malformed tail bud (black arrow) and open posterior neural tube (white arrow), compared with normal Cre-negative siblings at E10.5. This phenotype was milder than that typically observed with activation of T6-shRNA (compare with Fig. 1). (B) E16.5 T7-shRNA;ShhCre embryos show caudal axis truncation and loss of tail and sacral vertebrae (arrow) compared with Cre-negative sibling controls, similar to the mild phenotype class observed in transgenic lines expressing T6-shRNA (compare with Fig. 2). tb, tail bud.
Fig. S3.
Fig. S3.
T-transcript and protein levels in T6-shRNA;ShhCre embryos and T-protein levels and phenotypes in T6-shRNA;ShhCreER embryos after T knockdown at different times. (A) Whole-mount in situ RNA hybridization shows progressive loss of T transcripts from notochord of T6-shRNA;ShhCre embryos from E9.5 to E11.5, whereas expression in tail bud mesenchyme is preserved. (B) T immunofluorescence shows essentially complete loss of T protein from notochord in T6-shRNA;ShhCre embryos at E11.5 (compare with Fig. 2) and the extent of T-protein loss in E11.5 T6-shRNA;ShhCreER embryos after a single tamoxifen dose (2 mg) ranging from E7.5 to E9.5. (C) LacZ activity or Sox2 expression in transverse caudal trunk sections of E11.5 T6-shRNA;ShhCreER;RosaLacZ embryos shows notochord progenitor expansion and fate change to form ectopic neural tubes as well as loose mesenchymal cells (arrow), similar to T6-shRNA;ShhCre embryos (compare with Fig. 4). (D) T6-shRNA;ShhCreER;RosaLacZ vertebral skeletal phenotypes (E17.5), with rostral level of vertebral malformations/loss indicated by arrows for E7.5 or E8.5 shRNA activation. After E9.5 tamoxifen treatment, weaker but contiguous T-protein expression is detected along the entire notochord (in B), and no vertebral abnormalities are seen at E17.5. no, notochord; no*, T-knockdown notochord; nt, neural tube; tam, tamoxifen; tb, tail bud.
Fig. 3.
Fig. 3.
Expression of notochord regulators and Shh and somite apoptosis in T-knockdown embryos. (A–F) Axial notochord expression of Shh and Noto is lost in E10.5 T-shRNA;ShhCre embryos compared with Cre-negative sibling controls, whereas expression of Foxa2, acting upstream of T, is preserved. Altered tail Foxa2 thickness in T-shRNA;ShhCre reflects morphologic changes in axial progenitors as shown in transverse sections (Insets in E and F) (Fig. 4 also demonstrates axial progenitor expansion). (G–L) Lysotracker staining shows apoptosis in somites in T-shRNA;ShhCre embryos beginning at E10.5 and becoming extensive by E11.5 and E12.5 compared with Cre-negative sibling controls. Insets in G–L show transverse sections of tail at levels indicated by dotted lines. fp, floorplate; hg, hindgut; HL, hind limb bud; no, notochord; no*, T-knockdown notochord; nt, neural tube; tip, tail distal tip.
Fig. 4.
Fig. 4.
Notochord lineage tracing and fate analysis in E12 T-knockdown embryos. (A, B, D, and E) LacZ reporter activity in notochord lineage in T-shRNA;RosaLacZ;ShhCre and control RosaLacZ;ShhCre sibling embryos (A and D whole mount; B and E transverse tail sections). Notochord progenitors in T-knockdown embryos survive and expand (bracketed area in D) to form large epithelial tubular structures (E) as well as loose mesenchymal cells (arrow in E). In A and D normal limb bud LacZ activity (Shh-expressing) is also seen. (C, F, and G-I) Neural and gut endoderm marker analysis in T-knockdown embryos. (C and F) Early panneural marker Sox2 RNA is expressed in ectopic tubes of T-knockdown embryos as well as in neural tube compared with WT sibling control. (G–I) Immunofluorescence staining in T-knockdown for (G) panneural (Nestin) and (I) gut endoderm (EpCAM) markers compared with (H) LacZ reporter activity in serial sections. LacZ-positive ectopic tubular structures express neural but not hindgut marker. (J–R) Immunofluorescence for (K, N, and Q) the EMT marker Twist-1 (red) and (J, M, and P) visualization of notochord lineage cells (green) on the same section of T-shRNA;RosaEYFP;ShhCre or control RosaEYFP;ShhCre sibling embryos. Mesenchymal-appearing notochord lineage cells (arrows in R) are Twist-1–positive in T-knockdown embryos, whereas WT notochord (arrows in J–L) is Twist-1–negative. (L) Enlargement of merged image from boxed region in J and K. (P–R) Enlargements and merged image of boxed region in M and N. DAPI staining is shown in O. Note that background fluorescence from capillary endothelium is seen both within and around neural tube in M (confirmed by CD31 immunostaining). drg, dorsal root ganglia; hg, hindgut; LB, limb bud; no, notochord; no*, ectopic tubular structures; nt, neural tube.
Fig. 5.
Fig. 5.
Proliferation rates in notochord lineage of T-knockdown embryos relative to control notochord. (A–D and M–X) BrdU immunofluorescence analysis of tail sections from T-shRNA;RosaLacZ;ShhCre (T-shRNA) or RosaLacZ;ShhCre (T-WT) sibling control embryos at E10.5 and E11.5. (A–D) Bright-field images, (M–P) BrdU immunofluorescence and (Q–T) DAPI nuclear staining shown for the same sections. (E–L) LacZ reporter staining and T-protein immunofluorescence in adjacent serial sections identify ectopic tubular structures derived from notochord progenitors in T-shRNA;ShhCre embryos and normal notochord in controls (demarcated by dotted lines in A–H and M–T). Immunofluorescence reveals T protein (arrows in E and G) present in notochord of controls but absent from ectopic tubular structures in T-knockdown embryos. Immuofluorescence and flow cytometric analyses quantitating T expression in notochord lineage are shown in Figs. S4 and S5. (U–X) Average proliferation rates in notochord lineage in T knockdown are more than twofold higher than T-WT notochord (determined from percentage of BrdU+ cells in areas outlined by dotted lines in A–H and M–T). Average proliferation rates and SDs were derived from counting multiple sections of three independent embryos for each stage and genotype (data are in Table S2).
Fig. S4.
Fig. S4.
Comparison of notochord morphology in T6-shRNA;ShhCre embryos in regions with or without detectable residual T protein. (A) Whole-mount T immunofluorescence in notochord of an E11.5 T6-shRNA;ShhCre embryo showing areas with (B) undetectable or (C) residual T protein. Dotted lines mark levels of transverse histological sections shown in B and C. (B) Fluorescence and bright field images of transverse section at level B with no detectable T protein shows expanded neural tube-like morphology in position of notochord. (Note that intense autofluorescence is seen in red blood cells.) (C) Fluorescence and bright field images of transverse section at level C with residual detectable T protein shows a normal notochord morphology. no, notochord; no*, T-knockdown notochord; nt, neural tube.
Fig. S5.
Fig. S5.
Flow cytometric analysis of T-protein levels in notochord lineage cells of T-knockdown embryos. (A) Schematic diagram shows tissue dissection for FACS from T6-shRNA;ShhCre;RosaEYFP or T-WT;ShhCre;RosaEYFP embryos. The caudal axial trunk region (red dashed line) was dissected and pooled from several embryos of the same genotype in the same litter, dissociated, stained for T protein by immunofluorescence (IF) with anti-T primary antibody and Alexa 594-conjugated secondary antibody (Materials and Methods), and analyzed for EYFP (Shh lineages: notochord/floorplate) and Alexa 594 Red (T protein) levels by FACS. (B) Scatterplots of EYFP/green (ShhCre-lineage) and red fluorescence (T protein) intensities. In T-WT;ShhCre;RosaEYFP controls, 0.50% of total gated cells (64 of 12,858) are both EYFP+ and T+ (notochord cells). In T6-shRNA;ShhCre;RosaEYFP embryos, only 0.02% (4 of 19,528) are double positive, indicating that only rare cells in the notochord lineage retain T protein in T-knockdown embryos, whereas Shh-lineage+ cells lacking T are greatly expanded (1,029 of 19,528; ectopic neural tubes) compared with sibling control (81 of 12,858; floorplate cells). (C) Table summarizing results from four independent sorting experiments. Q2 (EYFP+;T+) population percentage (column 6) is drastically reduced in T-knockdown embryos compared with control siblings (0.09 vs. 8.73 per 1,000 cells), with a P value of 0.002 (Student’s t test). Additional control tissues for flow cytometric analysis included dissociated limb buds (Shh lineage-EYFP+; T-Alexa 594-negative controls) and tail buds (T-Alexa 594+; Shh lineage-negative controls) to establish background and positive signal levels.

References

    1. Stemple DL. Structure and function of the notochord: An essential organ for chordate development. Development. 2005;132(11):2503–2512. - PubMed
    1. Chiang C, et al. Cyclopia and defective axial patterning in mice lacking Sonic hedgehog gene function. Nature. 1996;383(6599):407–413. - PubMed
    1. Choi KS, Cohn MJ, Harfe BD. Identification of nucleus pulposus precursor cells and notochordal remnants in the mouse: Implications for disk degeneration and chordoma formation. Dev Dyn. 2008;237(12):3953–3958. - PMC - PubMed
    1. Choi KS, Harfe BD. Hedgehog signaling is required for formation of the notochord sheath and patterning of nuclei pulposi within the intervertebral discs. Proc Natl Acad Sci USA. 2011;108(23):9484–9489. - PMC - PubMed
    1. Risbud MV, Schaer TP, Shapiro IM. Toward an understanding of the role of notochordal cells in the adult intervertebral disc: From discord to accord. Dev Dyn. 2010;239(8):2141–2148. - PMC - PubMed

Publication types

MeSH terms

LinkOut - more resources