

Identifying potential differences in cause-of-death coding practices across Russian regions
- PMID: 27006644
- PMCID: PMC4802884
- DOI: 10.1186/s12963-016-0078-0
Identifying potential differences in cause-of-death coding practices across Russian regions
Abstract
Background: Reliable and comparable data on causes of death are crucial for public health analysis, but the usefulness of these data can be markedly diminished when the approach to coding is not standardized across territories and/or over time. Because the Russian system of producing information on causes of death is highly decentralized, there may be discrepancies in the coding practices employed across the country. In this study, we evaluate the uniformity of cause-of-death coding practices across Russian regions using an indirect method.
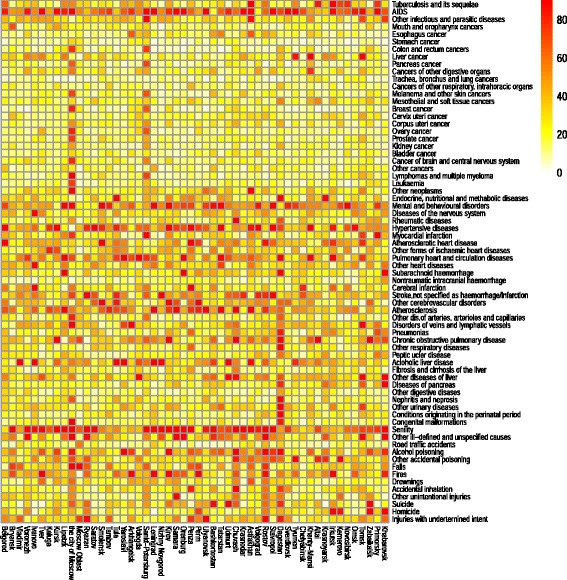
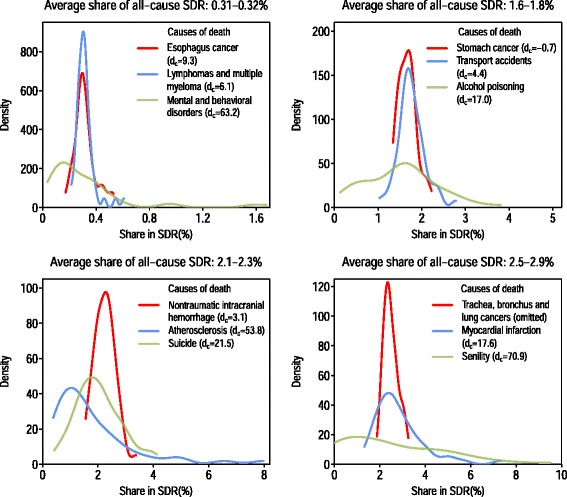
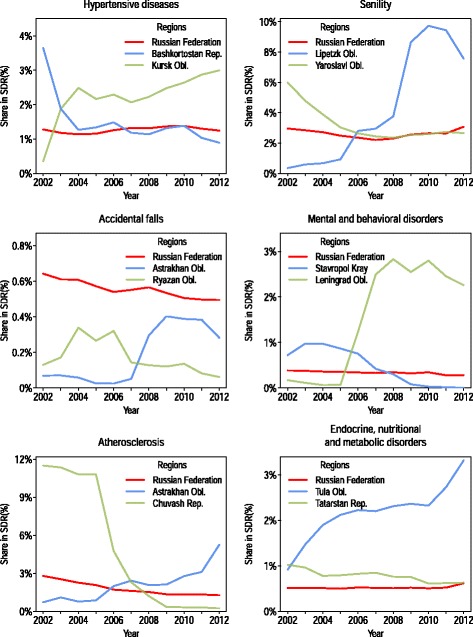
Methods: Based on 2002-2012 mortality data, we estimate the prevalence of the major causes of death (70 causes) in the mortality structures of 52 Russian regions. For each region-cause combination we measured the degree to which the share of a certain cause in the mortality structure of a certain region deviates from the respective inter-regional average share. We use heat map visualization and a regression model to determine whether there is regularity in the causes and the regions that is more likely to deviate from the average level across all regions. In addition to analyzing the comparability of cause-specific mortality structures in a spatial dimension, we examine the regional cause-of-death time series to identify the causes with temporal trends that vary greatly across regions.
Results: A high level of consistency was found both across regions and over time for transport accidents, most of the neoplasms, congenital malformations, and perinatal conditions. However, a high degree of inconsistency was found for mental and behavioral disorders, diseases of the nervous system, endocrine disorders, ill-defined causes of death, and certain cardiovascular diseases. This finding suggests that the coding practices for these causes of death are not uniform across regions. The level of consistency improves when causes of death can be grouped into broader diagnostic categories.
Conclusion: This systematic analysis allows us to present a broader picture of the quality of cause-of-death coding at the regional level. For some causes of death, there is a high degree of variance across regions in the likelihood that these causes will be chosen as the underlying causes. In addition, for some causes of death the mortality statistics reflect the coding practices, rather than the real epidemiological situation.
Keywords: Causes of death; Coding; Mortality statistics; Russia; Validation.
Figures
References
-
- Mikkelsen L, Phillips DE, AbouZahr C, Setel PW, de Savigny D, Lozano R, Lopez AD. A global assessment of civil registration and vital statistics systems: monitoring data quality and progress. Lancet. 2015; doi: 10.1016/S0140-6736 (15) 60171-4 - PubMed
-
- Mahapatra P, Shibuya K, Lopez DA, Coullare F, Notzom FC, Rao C, Szreter S, MoVE writing group. Civil registration systems and vital statistics: successes and missed opportunities. Lancet. 2007; doi: 10.1016/S0140-6736 (07) 61308-7 - PubMed
LinkOut - more resources
Full Text Sources
Other Literature Sources
