

Comparison of Respiratory Resistance Measurements Made with an Airflow Perturbation Device with Those from Impulse Oscillometry
- PMID: 27006908
- PMCID: PMC4782682
- DOI: 10.1155/2013/165782
Comparison of Respiratory Resistance Measurements Made with an Airflow Perturbation Device with Those from Impulse Oscillometry
Abstract
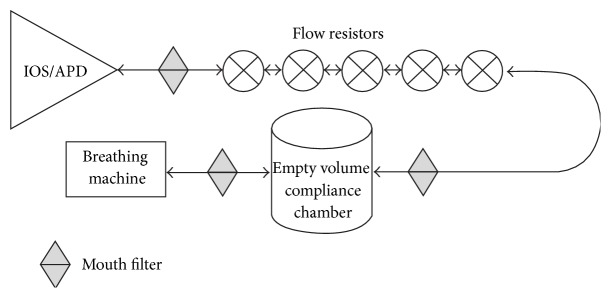
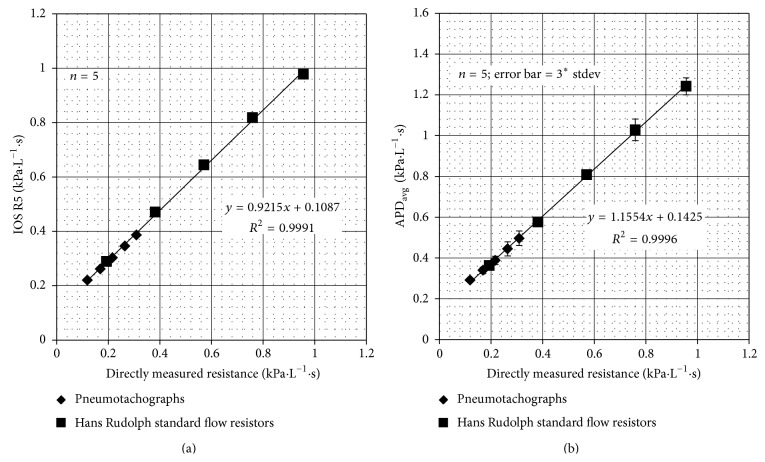
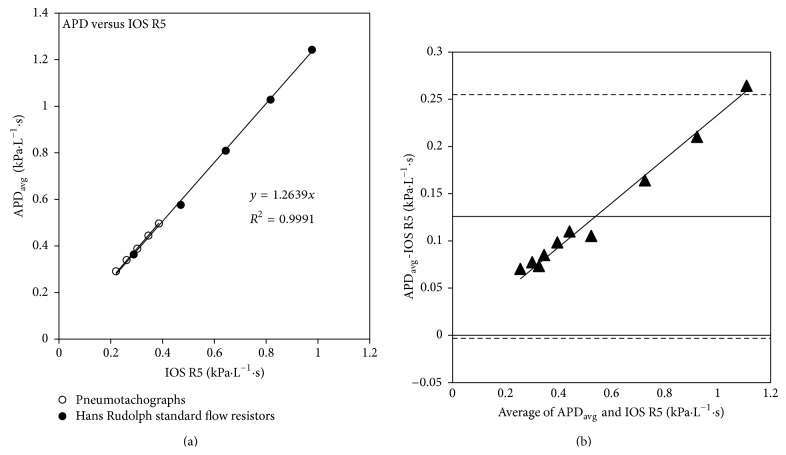
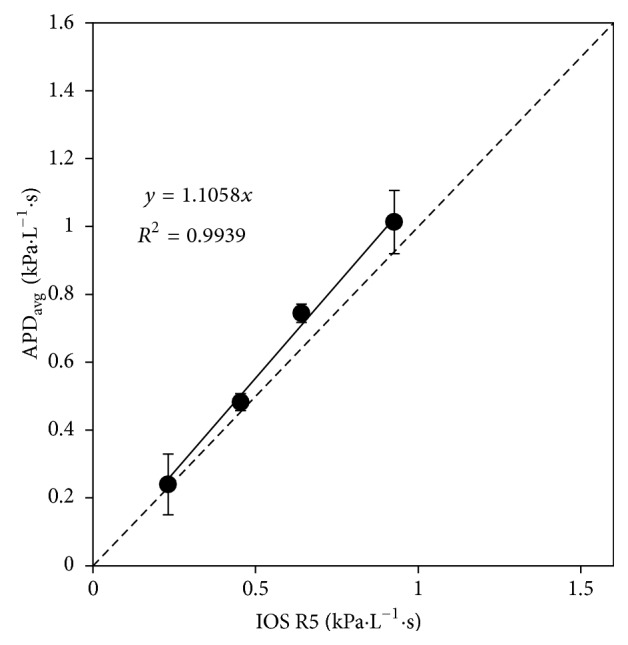
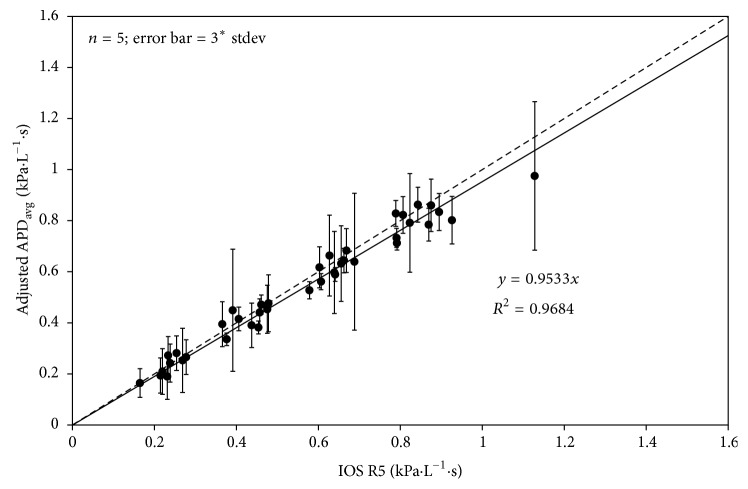
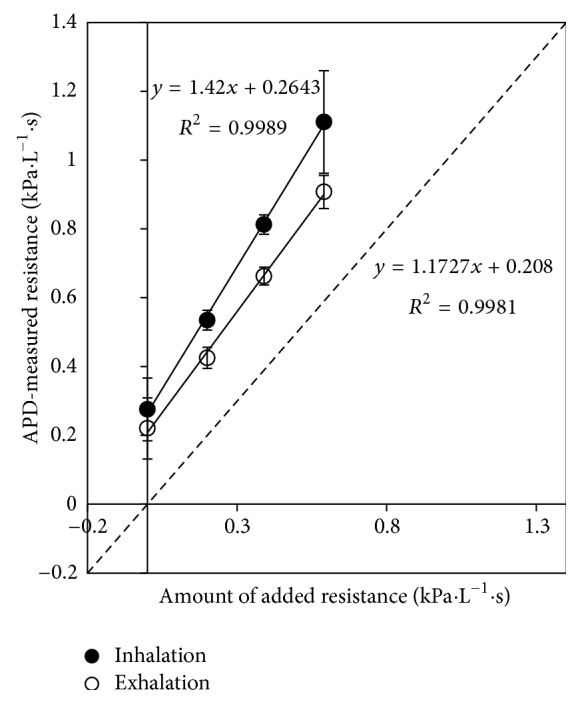
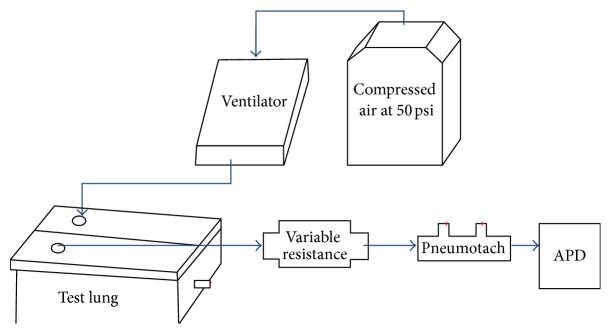
The airflow perturbation device (APD) has been developed as a portable, easy to use, and a rapid response instrument for measuring respiratory resistance in humans. However, the APD has limited data validating it against the established techniques. This study used a mechanical system to simulate the normal range of human breathing to validate the APD with the clinically accepted impulse oscillometry (IOS) technique. The validation system consisted of a sinusoidal flow generator with ten standardized resistance configurations that were shown to represent a total range of resistances from 0.12 to 0.95 kPa·L(-1) ·s (1.2-9.7 cm H2O·L(-1) ·s). Impulse oscillometry measurements and APD measurements of the mechanical system were recorded and compared at a constant airflow of 0.15 L·s(-1). Both the IOS and APD measurments were accurate in assessing nominal resistance. In addition, a strong linear relationship was observed between APD measurements and IOS measurements (R (2) = 0.999). A second series of measurements was made on ten human volunteers with external resistors added in their respiratory flow paths. Once calibrated with the mechanical system, the APD gave respiratory resistance measurements within 5% of IOS measurements. Because of their comparability to IOS measurements, APD measurements are shown to be valid representations of respiratory resistance.
Figures

Similar articles
-
Testing limits to airflow perturbation device (APD) measurements.Biomed Eng Online. 2008 Oct 31;7:28. doi: 10.1186/1475-925X-7-28. Biomed Eng Online. 2008. PMID: 18976487 Free PMC article.
-
A Rapid, Handheld Device to Assess Respiratory Resistance: Clinical and Normative Evidence.Mil Med. 2018 Sep 1;183(9-10):e370-e377. doi: 10.1093/milmed/usx224. Mil Med. 2018. PMID: 29425367
-
Respiratory resistance measured by an airflow perturbation device.Physiol Meas. 1999 Feb;20(1):21-35. doi: 10.1088/0967-3334/20/1/002. Physiol Meas. 1999. PMID: 10374824
-
Impulse oscillometry in the assessment of children's lung function.Allergol Immunopathol (Madr). 2019 May-Jun;47(3):295-302. doi: 10.1016/j.aller.2018.03.003. Epub 2018 Jul 5. Allergol Immunopathol (Madr). 2019. PMID: 29983239 Review.
-
Impulse oscillometry: The state-of-art for lung function testing.Lung India. 2016 Jul-Aug;33(4):410-6. doi: 10.4103/0970-2113.184875. Lung India. 2016. PMID: 27578934 Free PMC article. Review.
Cited by
-
The Effect of Exercise on Respiratory Resistance in Athletes With and Without Paradoxical Vocal Fold Motion Disorder.Am J Speech Lang Pathol. 2015 Aug;24(3):470-9. doi: 10.1044/2015_AJSLP-14-0110. Am J Speech Lang Pathol. 2015. PMID: 26001627 Free PMC article. Clinical Trial.
-
Oscillometry in Lung Function Assessment: A Comprehensive Review of Current Insights and Challenges.Cureus. 2023 Oct 29;15(10):e47935. doi: 10.7759/cureus.47935. eCollection 2023 Oct. Cureus. 2023. PMID: 38034137 Free PMC article. Review.
-
Inhaled furosemide for relief of air hunger versus sense of breathing effort: a randomized controlled trial.Respir Res. 2018 Sep 20;19(1):181. doi: 10.1186/s12931-018-0886-9. Respir Res. 2018. PMID: 30236110 Free PMC article. Clinical Trial.
References
-
- Johnson A. T. Biomechanics and Exercise Physiology: Quantitative Modeling. Boca Raton, Fla, USA: Taylor & Francis; 2007.
-
- Ducharme F. M., Davis G. M., Ducharme G. R. Pediatric reference values for respiratory resistance measured by forced oscillation. Chest. 1998;113(5):1322–1328. - PubMed
-
- Wohl M. E., Stigol L. C., Mead J. Resistance of the total respiratory system in healthy infants and infants with bronchiolitis. Pediatrics. 1969;43(4):495–509. - PubMed
Grants and funding
LinkOut - more resources
Full Text Sources
Other Literature Sources