. 2016 May;157(5):1866-80.
doi: 10.1210/en.2015-2010. Epub 2016 Mar 23.

Evidence for Osteocalcin Binding and Activation of GPRC6A in β-Cells

Affiliations

Evidence for Osteocalcin Binding and Activation of GPRC6A in β-Cells

Min Pi et al. Endocrinology. 2016 May.

Abstract

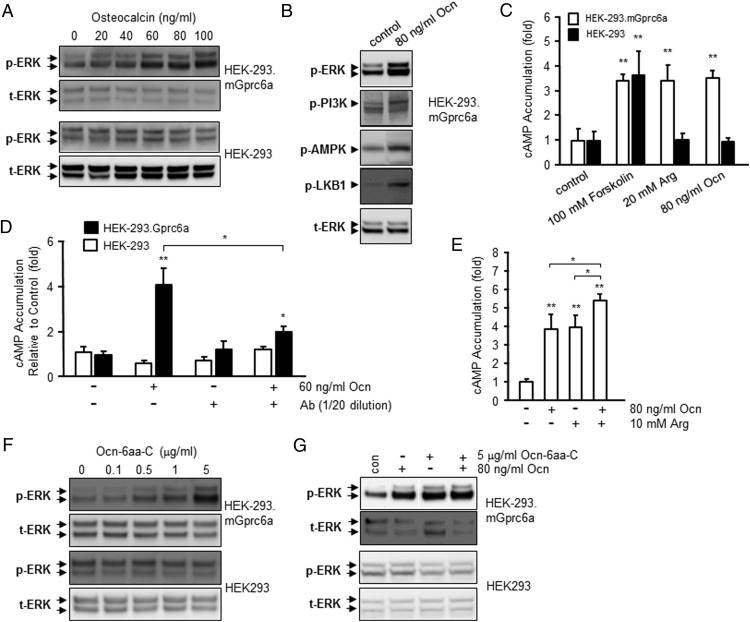
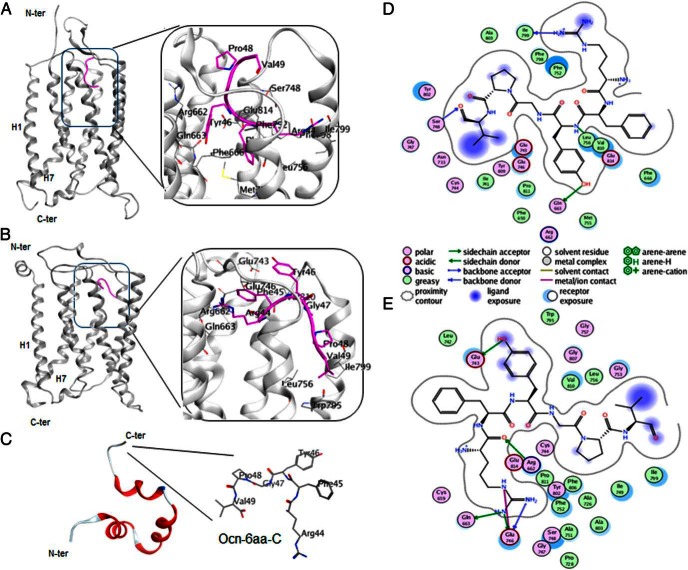
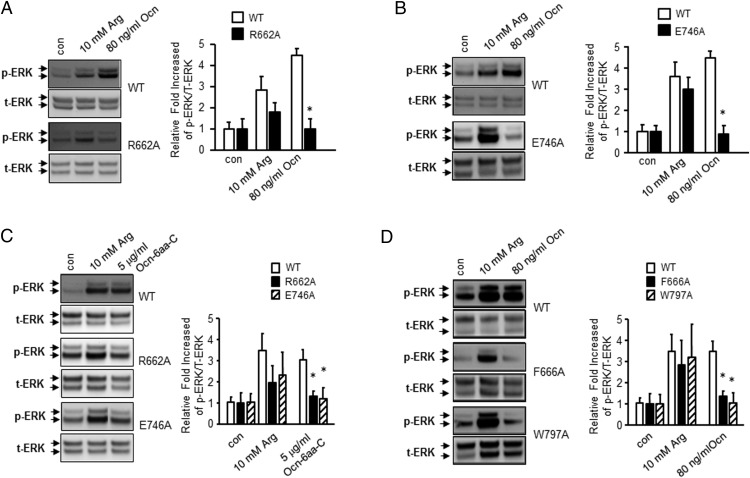
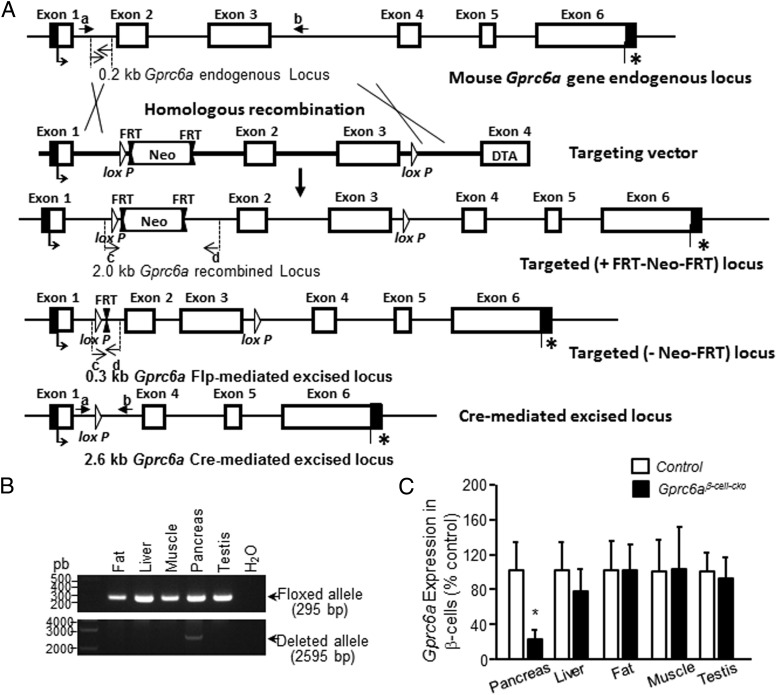
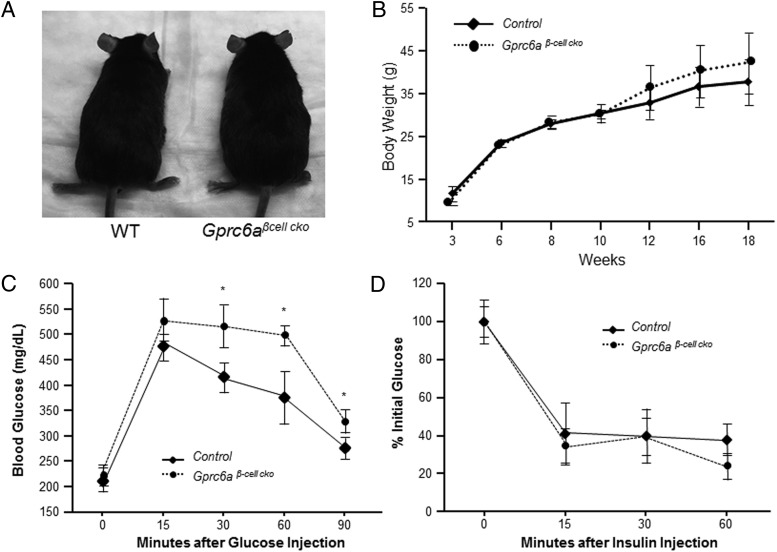
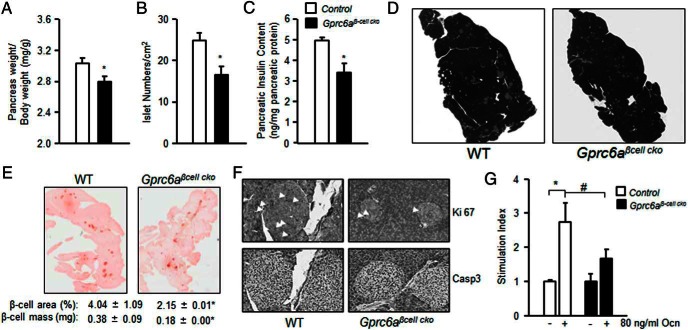
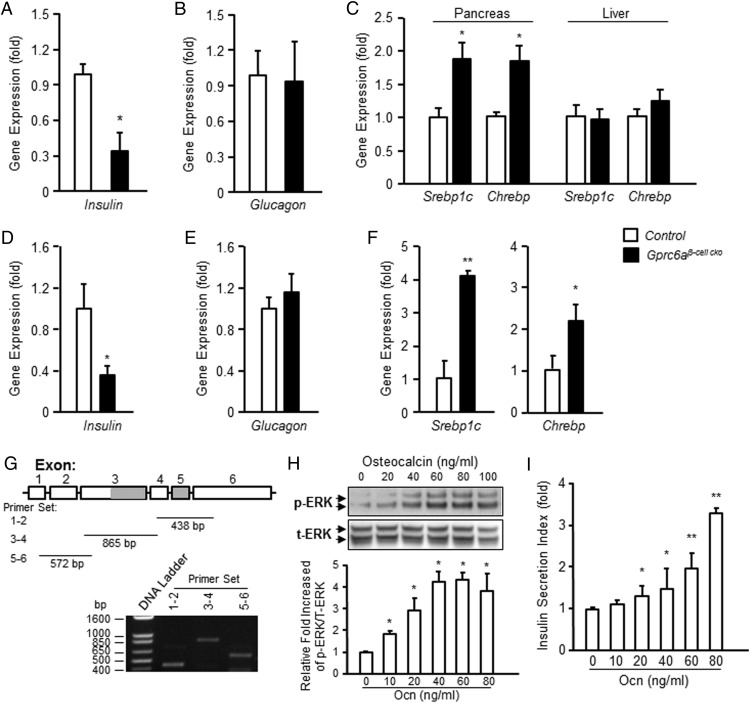
The possibility that G protein-coupled receptor family C member A (GPRC6A) is the osteocalcin (Ocn)-sensing G protein-coupled receptor that directly regulates pancreatic β-cell functions is controversial. In the current study, we found that Ocn and an Ocn-derived C-terminal hexapeptide directly activate GPRC6A-dependent ERK signaling in vitro. Computational models probe the structural basis of Ocn binding to GPRC6A and predict that the C-terminal hexapeptide docks to the extracellular side of the transmembrane domain of GPRC6A. Consistent with the modeling, mutations in the computationally identified binding pocket of GPRC6A reduced Ocn and C-terminal hexapeptide activation of this receptor. In addition, selective deletion of Gprc6a in β-cells (Gprc6a(β)(-cell-cko)) by crossing Gprc6a(flox/flox) mice with Ins2-Cre mice resulted in reduced pancreatic weight, islet number, insulin protein content, and insulin message expression. Both islet size and β-cell proliferation were reduced in Gprc6a(β)(-cell-cko) compared with control mice. Gprc6a(β)(-cell-cko) exhibited abnormal glucose tolerance, but normal insulin sensitivity. Islets isolated from Gprc6a(β)(-cell-cko) mice showed reduced insulin simulation index in response to Ocn. These data establish the structural basis for Ocn direct activation of GPRC6A and confirm a role for GPRC6A in regulating β-cell proliferation and insulin secretion.


Figures

Figure 1.
Figure 1.
Evidence for Ocn activation of GPRC6A. A, Dose-dependent effects of Ocn on GPRC6A-mediated ERK phosphorylation in HEK-293 cells overexpressing GPRC6A. B, Ocn actives GPRC6A-mediated PI3K, AMPK, and LKB1 phosphorylation in HEK-293 cells overexpressing GPRC6A. C, cAMP response to forskolin, Ocn, or L-arginine (31), a known GPRC6A ligand, in HEK-293 cells with and without GPRC6A transfection. D, An Ocn blocking antibody inhibited Ocn-stimulated cAMP accumulation in HEK-293 cells transfected with GPRC6A. E, Ocn and L-Arg show additive cAMP responses. * and **, significant differences from control and stimulated groups at P < .05 and P < .01 (n ≥ 4). F, Ocn-derived 6-aa C-terminal peptide (Ocn-6aa-C) activates GPRC6A-mediated ERK phosphorylation in HEK-293 cells expressing GPRC6A but not in control HEK-293 cells (lower panel). G, Ocn-6aa-C and Ocn show nonadditive effects on GPRC6A-dependent ERK activation.
Figure 2.
Figure 2.
Docking of Ocn C-terminal (Ocn-6aa-C) to GPRC6A. A, Binding site in the mGluR-1-based template model, Ocn-6aa-C is shown in pink ribbon-stick representation. B, Binding site in the mGlur-5-based model. C, Ocn and Ocn-6aa-C models based on bOcn structure. Ocn C-terminal consisting of 6 residues: Arg44, Phe45, Tyr46, Gly47, Pro48, and Val49. D and E, Ocn-6aa-C binding sites. Binding pocket residues found in the (D) mGluR-1- and (E) mGluR-5-based models of GPRC6A, generated using the rigid-body docking protocol.
Figure 3.
Figure 3.
Mutagenesis of residues in predicted Ocn-binding pocket of GPRC6A. A, Comparison of Ocn and L-Arg activation of WT (upper panel) and R662A GPRC6A transfected in HEK-293 cells (lower panel). Bar graph depicting fold increase in ERK activation in response to Ocn and L-Arg in WT and mutant GPRC6A. B, Comparison of Ocn and L-Arg activation of WT (upper panel) and E746A GPRC6A transfected in HEK-293 cells (lower panel). Bar graph depicting fold increase in ERK activation in response to Ocn and L-Arg in WT and mutant GPRC6A. C, Comparison of Ocn-6aa-C and L-Arg activation of WT (upper panel) and R662A GPRC6A (middle panel) and E746A GPRC6A (lower panel) transfected in HEK-293 cells. Bar graph depicting fold increase in ERK activation in response to Ocn-6aa-C and L-Arg in WT and mutant GPRC6As. D, Comparison of Ocn and L-Arg activation of WT (upper panel), F666A (middle panel), and W797A (lower panel) GPRC6A transfected in HEK-293 cells. Bar graph depicting fold increase in ERK activation in response to Ocn and L-Arg in WT and mutant GPRC6A.
Figure 4.
Figure 4.
Generation of a conditional allele of Gprc6a mouse model. A, Schematic representation of the targeting strategy. Exon 1–6 open reading frames are represented by open boxes, and thin lines represent untranslated regions of the Gprc6a locus. The neomycin resistance gene (for positive selection) flanked by 2 FRT sites and LoxP (open triangle) are indicated. B, Specificity of Gprc6a deletion was tested by PCR in the indicated tissues. C, Efficiency of Gprc6a deletion by Ins2-Cre in pancreas was tested by real-time PCR using specific Gprc6a primers as described in Materials and Methods. Expression was assessed by real-time PCR using total RNA derived from control group (WT, +/+;Gprc6aflox/+, +/+;Gprc6aflox/−, or Ins2-Cre/+;Gprc6aflox/+) and Gprc6aβ-cell-cko mouse tissues as indicated. Gprc6a expression is relative to the level of the cyclophilin control gene. Values represent the mean ± SEM. *, significant difference between control group and Gprc6aβ-cell-cko mice (P < .05; n ≥ 4).
Figure 5.
Figure 5.
Phenotype of Gprc6aβ-cell-cko mice. A, Gross appearance of adult WT and Gprc6aβ-cell-cko male mice. B, Comparison of the body weight in control group and Gprc6aβ-cell-cko male mice at ages ranging from 3 to 18 weeks. Data represent the mean ± SEM from 4 to 6 mice in each group. GTT (C) and ITT (D) (38) in WT and Gprc6aβ-cell-cko mice. Shown is blood glucose (mg/dL) during GTT in 10-week-old control and Gprc6aβ-cell-cko male and female mice. ITT data are presented as percentage of initial blood glucose concentration. Data represent the mean ± SEM from more than 5 male and female mice in each group. *, difference from control group and Gprc6aβ-cell-cko mice at P < .05.
Figure 6.
Figure 6.
Characterization of the phenotype of Gprc6aβ-cell-cko mice. A, Comparison of pancreas weight in 10-week-old control group and Gprc6aβ-cell-cko mice. The weight of pancreas was normalization by body weight. Comparison of islet number (B) and insulin content (C) in pancreas from in control group and Gprc6aβ-cell-cko mice. Values represent the mean ± SEM. *, significant difference between control group and Gprc6aβ-cell-cko mice (P < .05; n ≥ 4). D, Representative hematoxylin and eosin staining. E, Immunostaining for insulin (red staining), the quantified average stained area for WT and Gprc6aβ-cell-cko mouse pancreas sections is indicated below the image. F, The immunostaining for Ki-67 (upper panel, arrowheads show Ki-67-positive staining) and cysteine-aspartic acid protease 3 (Casp3) in WT and Gprc6aβ-cell-cko mice (bottom panel). G, Islets from Gprc6aβ-cell-cko mice showed impaired insulin stimulation index by Ocn. Stimulation index was attenuated in response to 60-ng/mL Ocn in isolated islets from Gprc6aβ-cell-cko mice. Values represent the mean ± SEM. *, significant different between control group and Gprc6aβ-cell-cko mice (P < .05; n ≥ 3); #, significant different between Ocn-treated control group and Gprc6aβ-cell-cko mice (P < .05; n ≥ 3).
Figure 7.
Figure 7.
Selective deletion of Gprc6a in pancreatic β-cell attenuated insulin, Srebp1c, and Chrebp expression but not glucagon expression in pancreas. Comparison of insulin (A) and glucagon (B) expression in pancreas from in control group and Gprc6aβ-cell-cko mice. C, Comparison of Srebp1c and Chrebp expression in pancreas and liver from in control group and Gprc6aβ-cell-cko mice. Expression was assessed by real-time PCR using total RNA derived from pancreas or liver from control group and Gprc6aβ-cell-cko mice. Insulin, glucagon, Srebp1c, and Chrebp expression is relative to the level of the cyclophilin control gene. Comparison of insulin (D) and glucagon (E) expression in pancreatic islets. Expression was assessed by real-time PCR using total RNA derived from isolated islets from control group and Gprc6aβ-cell-cko mice. Insulin and glucagon expression is relative to the level of the cyclophilin control gene. F, Comparison of Srebp1c and Chrebp expression in isolated islets from control and Gprc6aβ-cell-cko mice. Expression of insulin, Srebp1c, and Chrebp, but not glucagon, were significantly different in islets from Gprc6aβ-cell-cko mice compared with the islets from control group mice. G, Expression of GPRC6A transcript in INS-1 β-cells. The expected sized fragment was generated from 3 different primer sets for gprc6a, set 1–2 spanning exons 1 and 2 of 438-bp length, set 3–4 spanning exons 3 and 4 of 865 bp, and set 5–6 spanning exons 5–6 of 572 bp. Dose-dependent effects of Ocn on GPRC6A-mediated ERK phosphorylation (H) and insulin secretion (I) in INS-1 β-cells. Values represent the mean ± SEM. *, significant difference between control group and Gprc6aβ-cell-cko mice (P < .05; n ≥ 3).

References

    1. Karsenty G, Oury F. Regulation of male fertility by the bone-derived hormone osteocalcin. Mol Cell Endocrinol. 2014;382:521–526. - PMC - PubMed
    1. Oury F, Khrimian L, Denny CA, et al. Maternal and offspring pools of osteocalcin influence brain development and functions. Cell. 2013;155:228–241. - PMC - PubMed
    1. Oury F, Ferron M, Huizhen W, et al. Osteocalcin regulates murine and human fertility through a pancreas-bone-testis axis. J Clin Invest. 2013;123:2421–2433. - PMC - PubMed
    1. Oury F, Sumara G, Sumara O, et al. Endocrine regulation of male fertility by the skeleton. Cell. 2011;144:796–809. - PMC - PubMed
    1. Pi M, Wu Y, Quarles LD. GPRC6A mediates responses to osteocalcin in β-cells in vitro and pancreas in vivo. J Bone Miner Res. 2011;26:1680–1683. - PMC - PubMed

Publication types

MeSH terms