. 2016 Mar 31;531(7596):656-60.
doi: 10.1038/nature17426. Epub 2016 Mar 23.

Primary cilia are not calcium-responsive mechanosensors

Affiliations

Primary cilia are not calcium-responsive mechanosensors

M Delling et al. Nature. .

Abstract

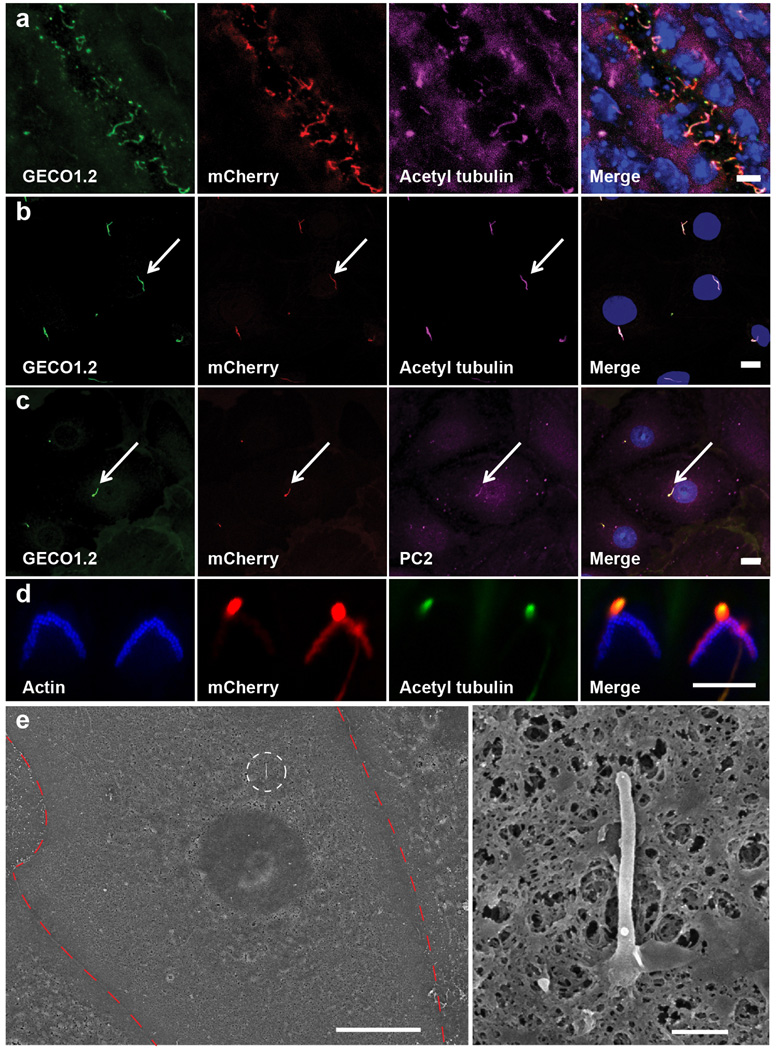
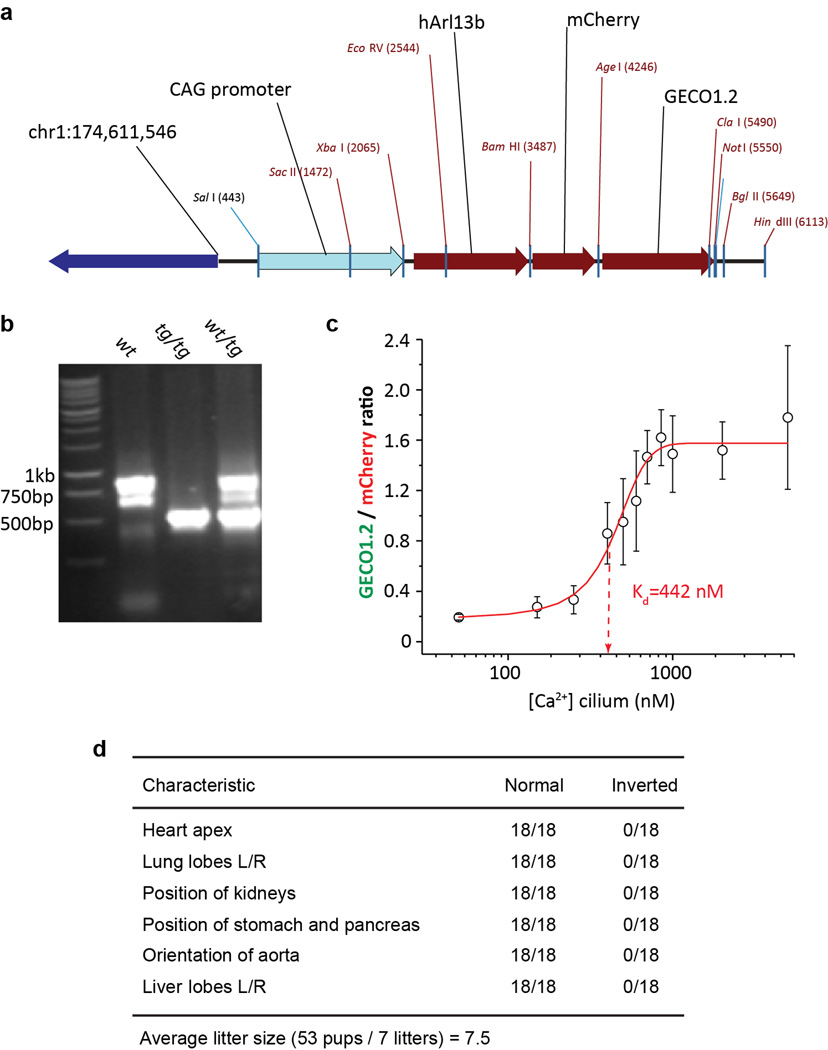
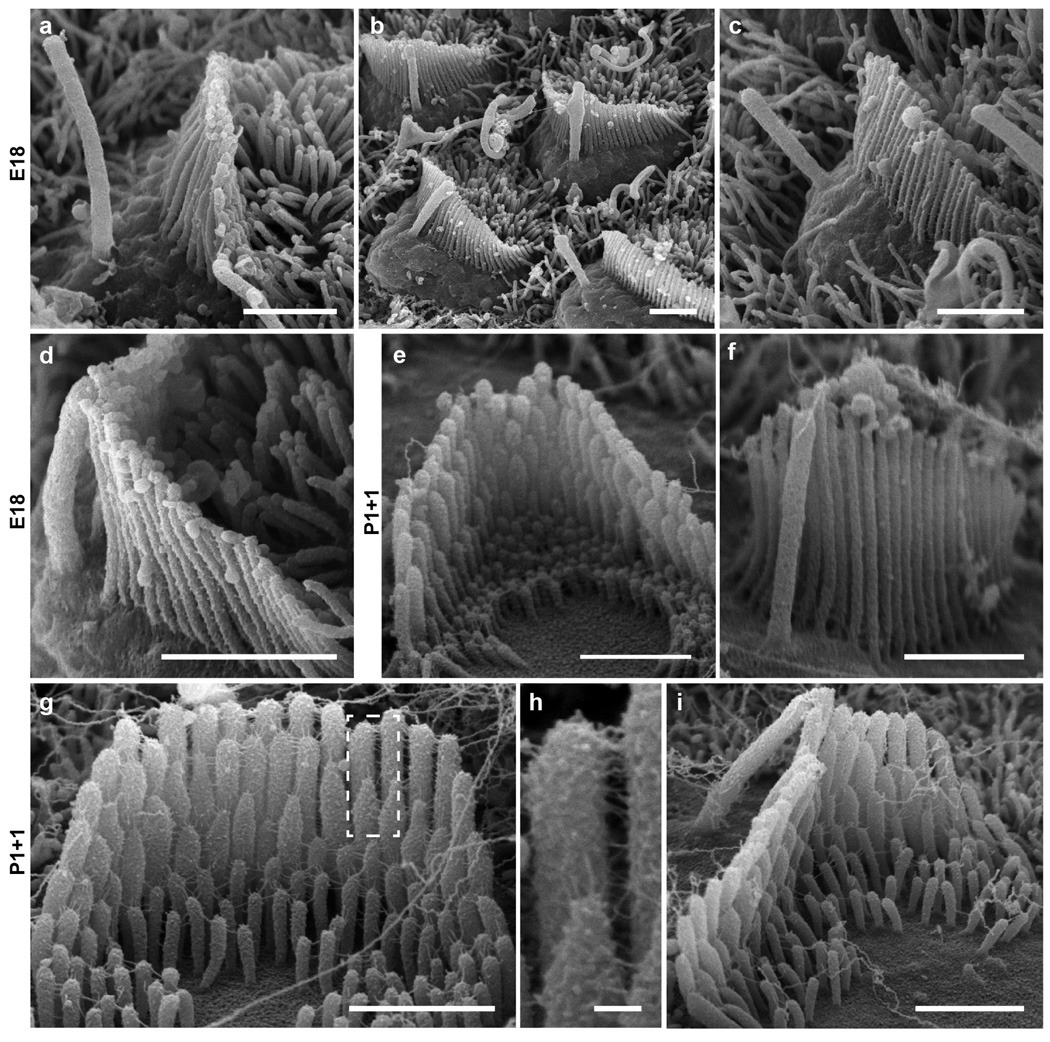
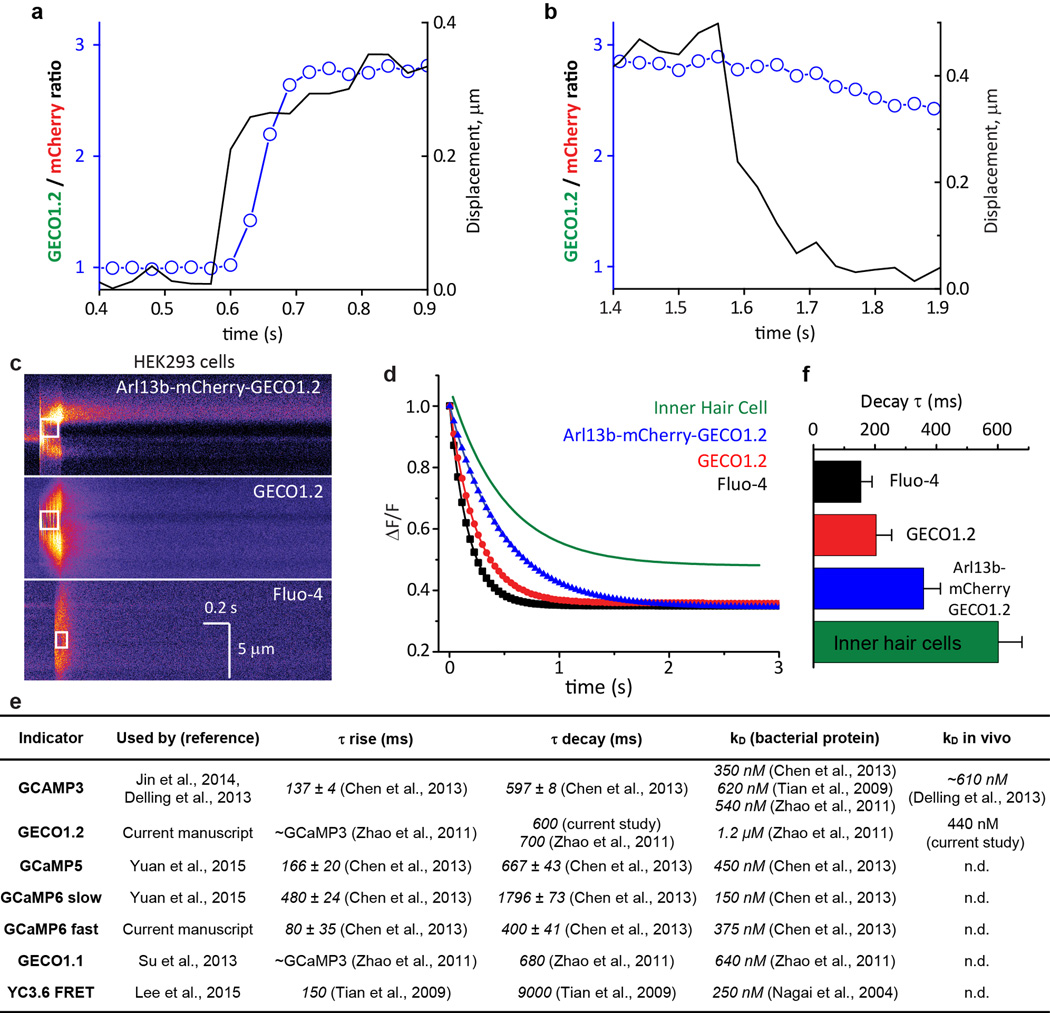
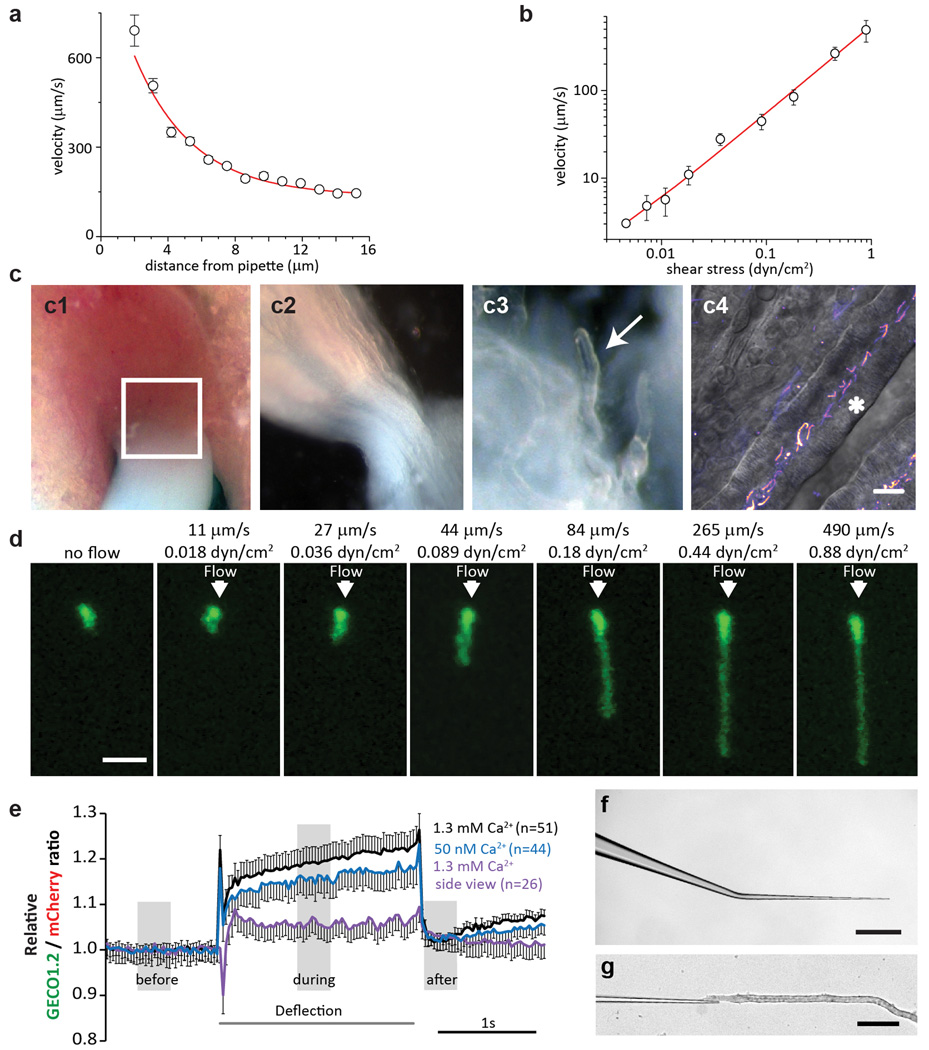
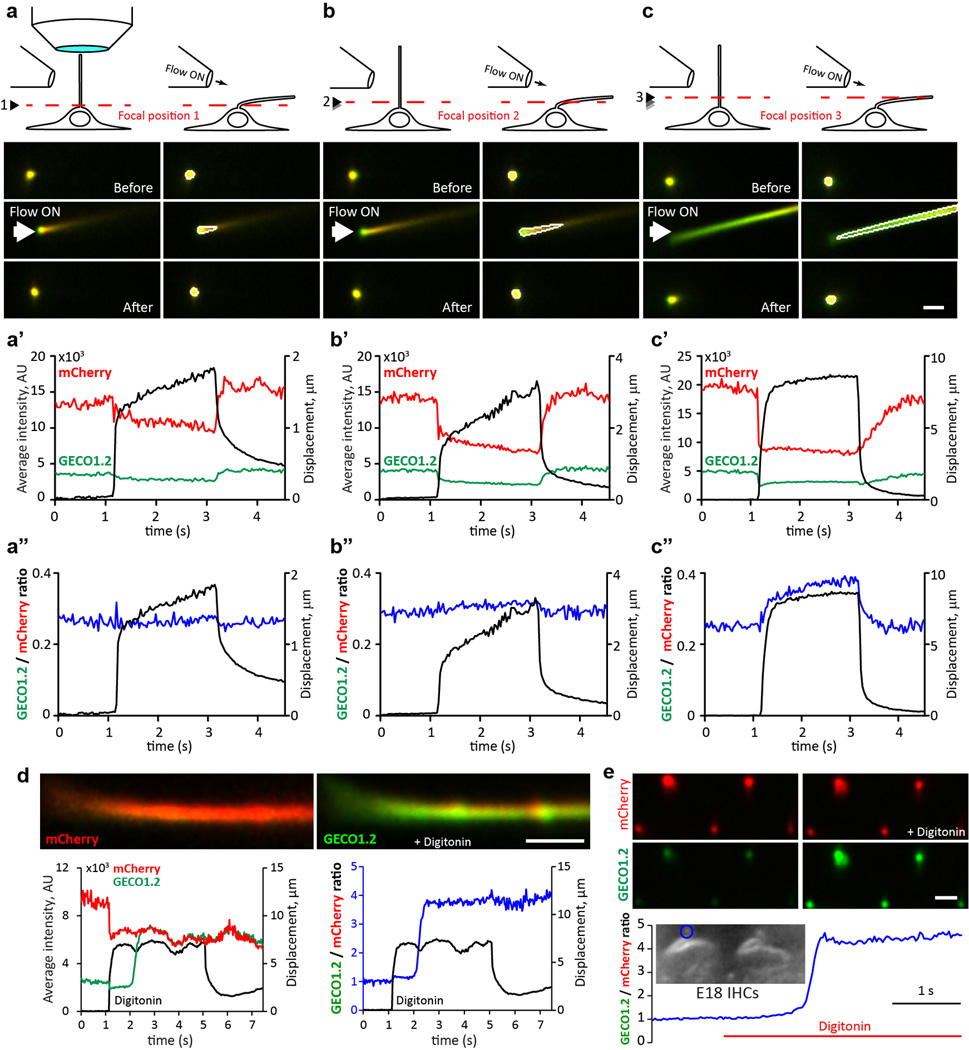
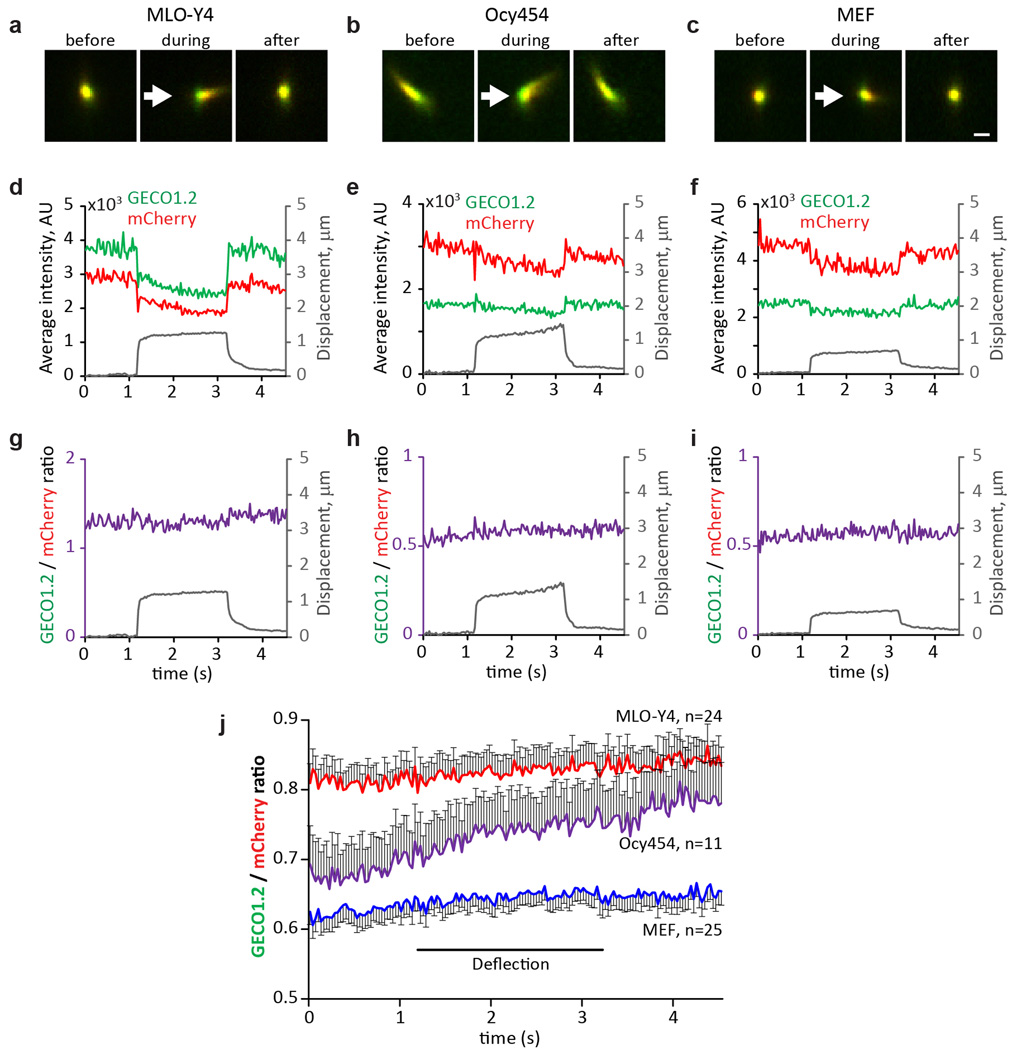
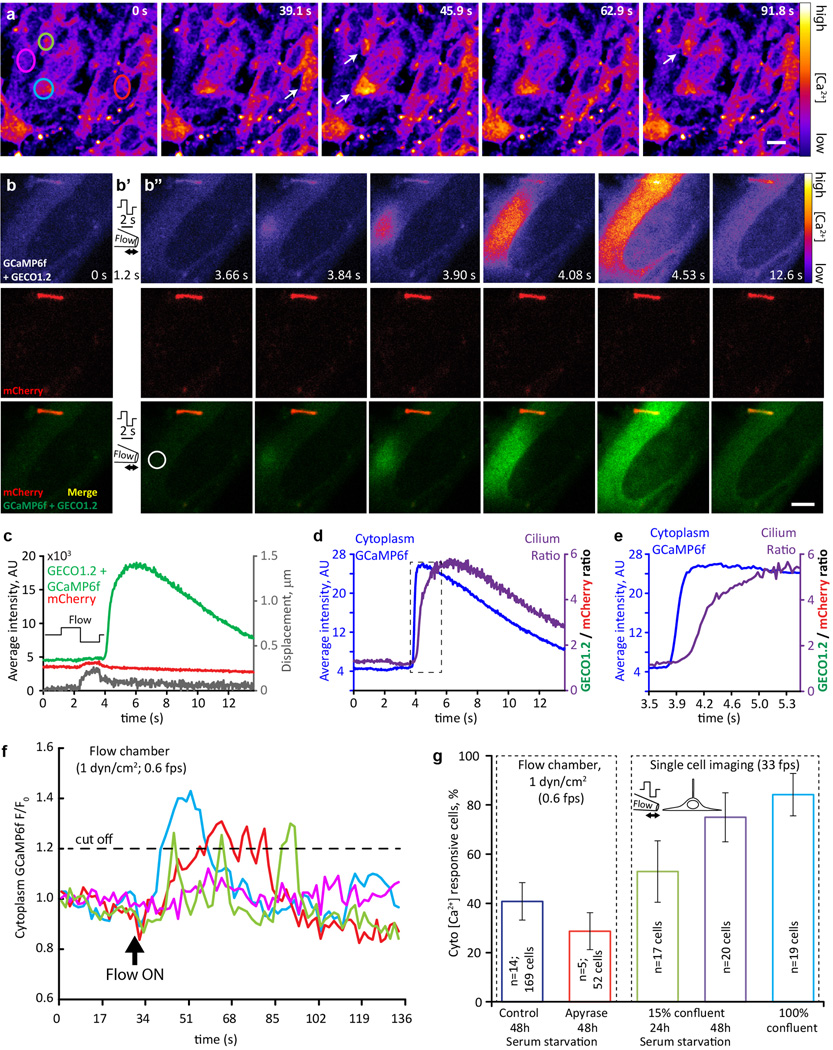
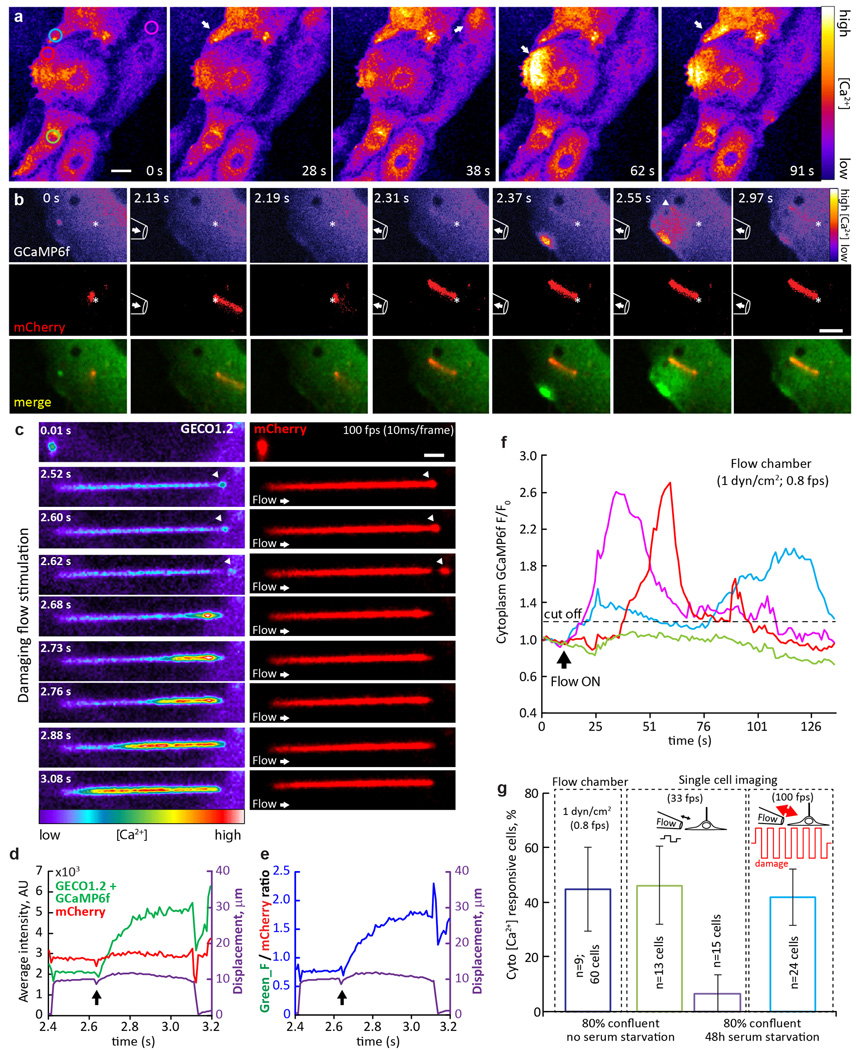
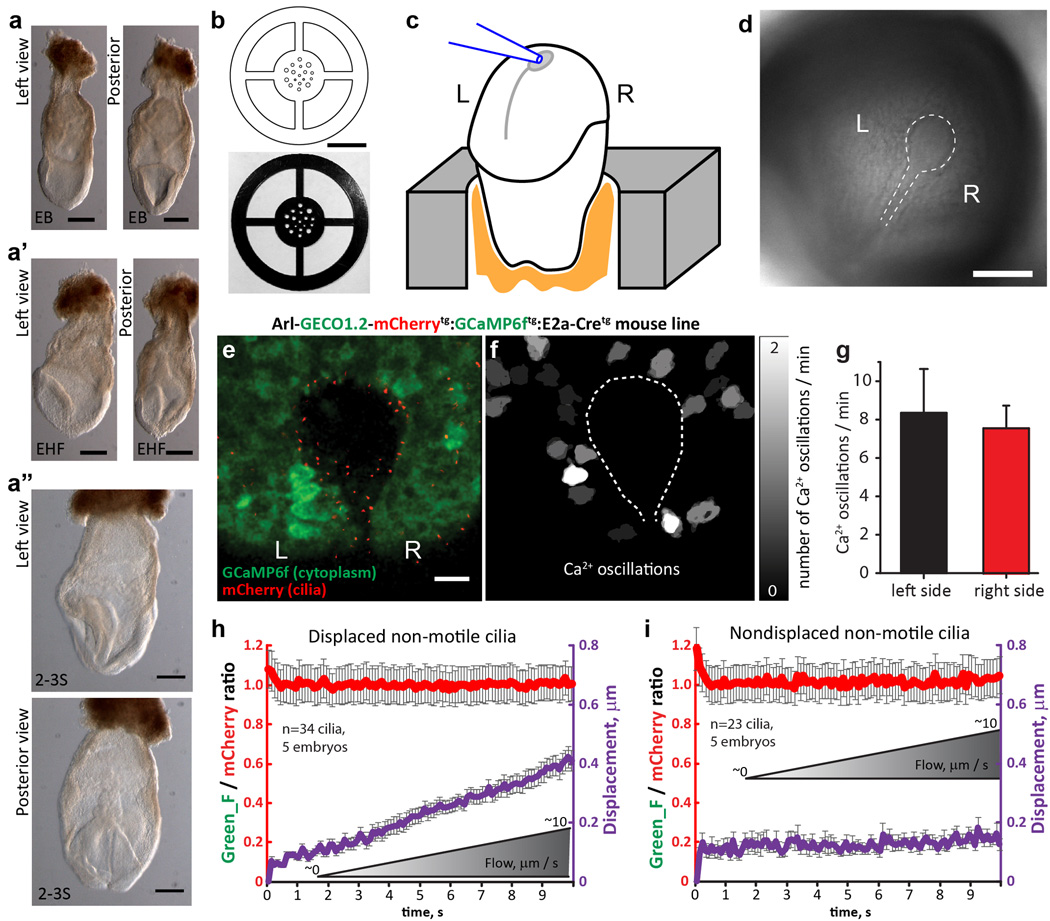
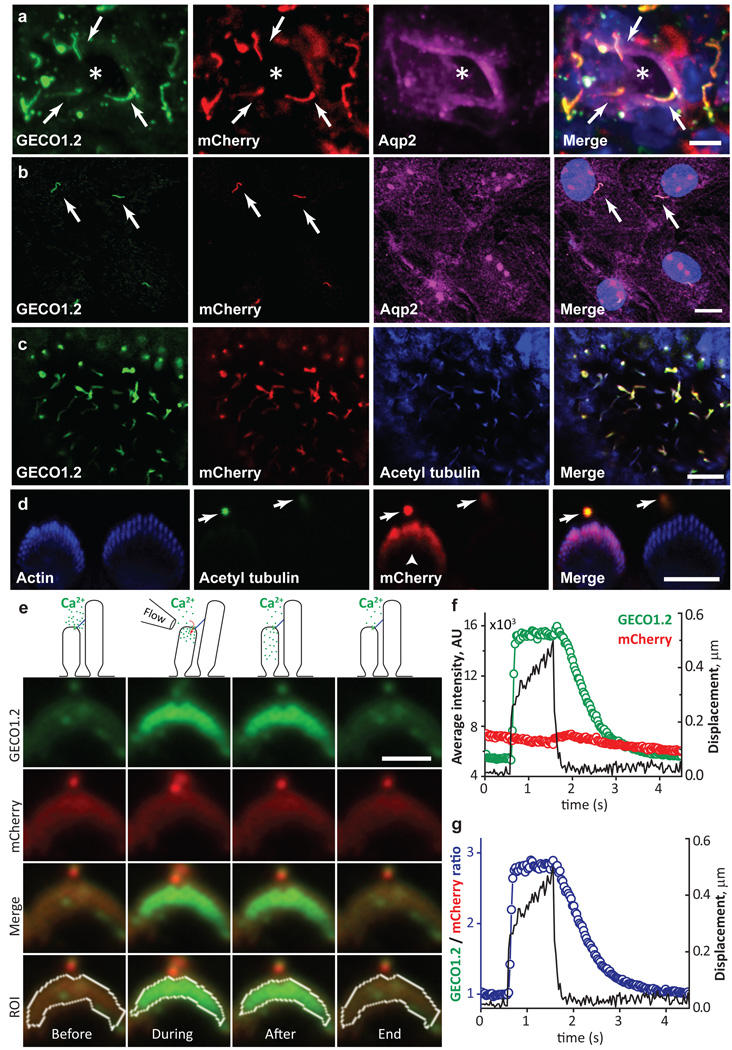
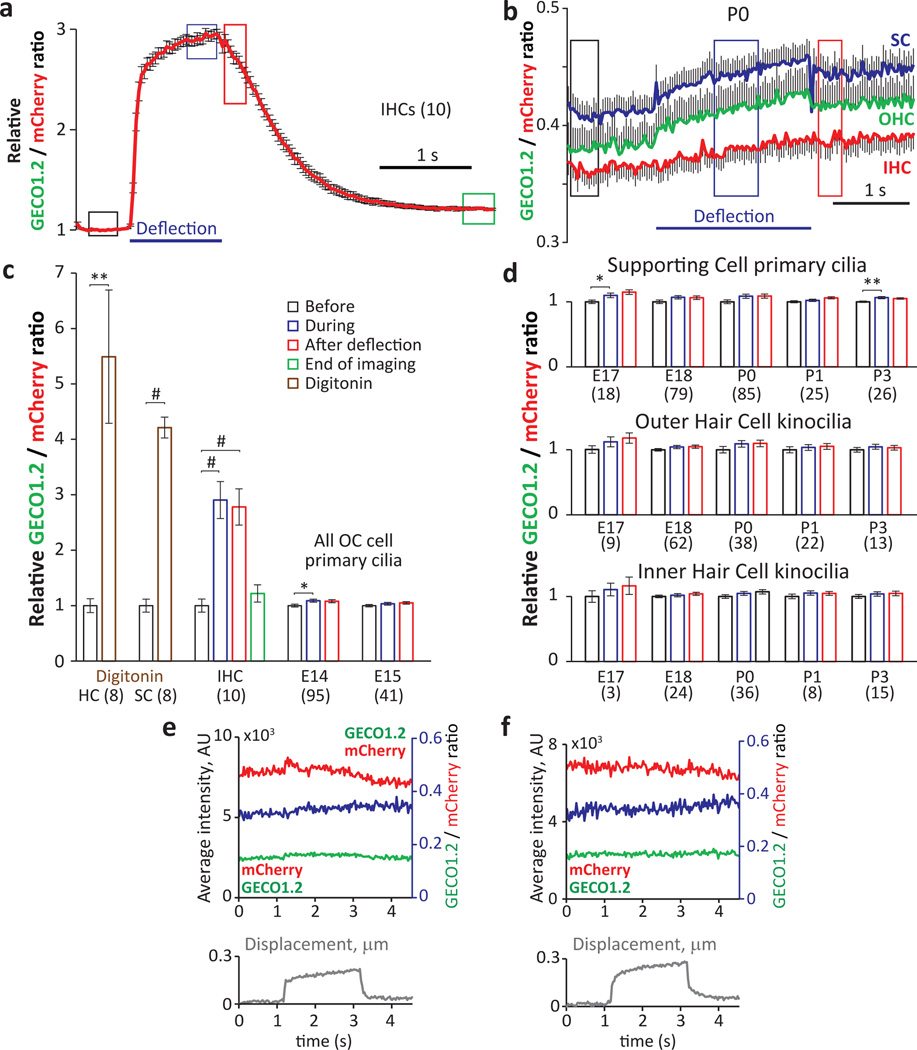
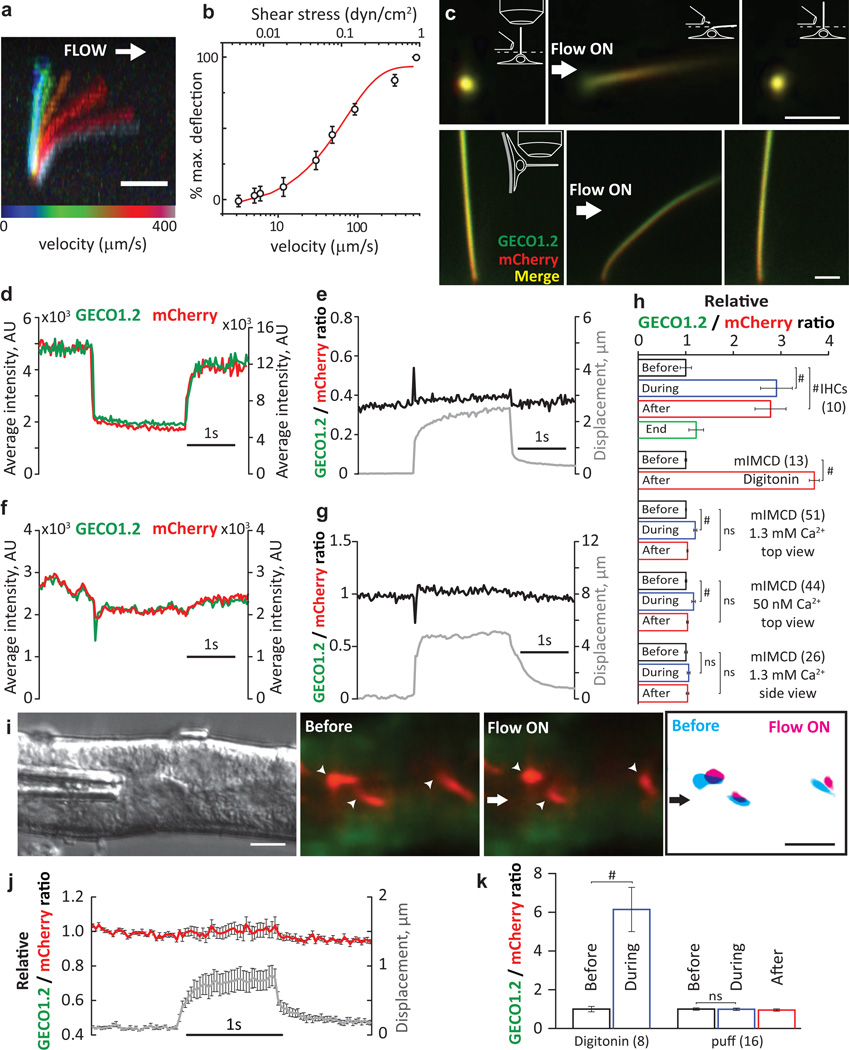
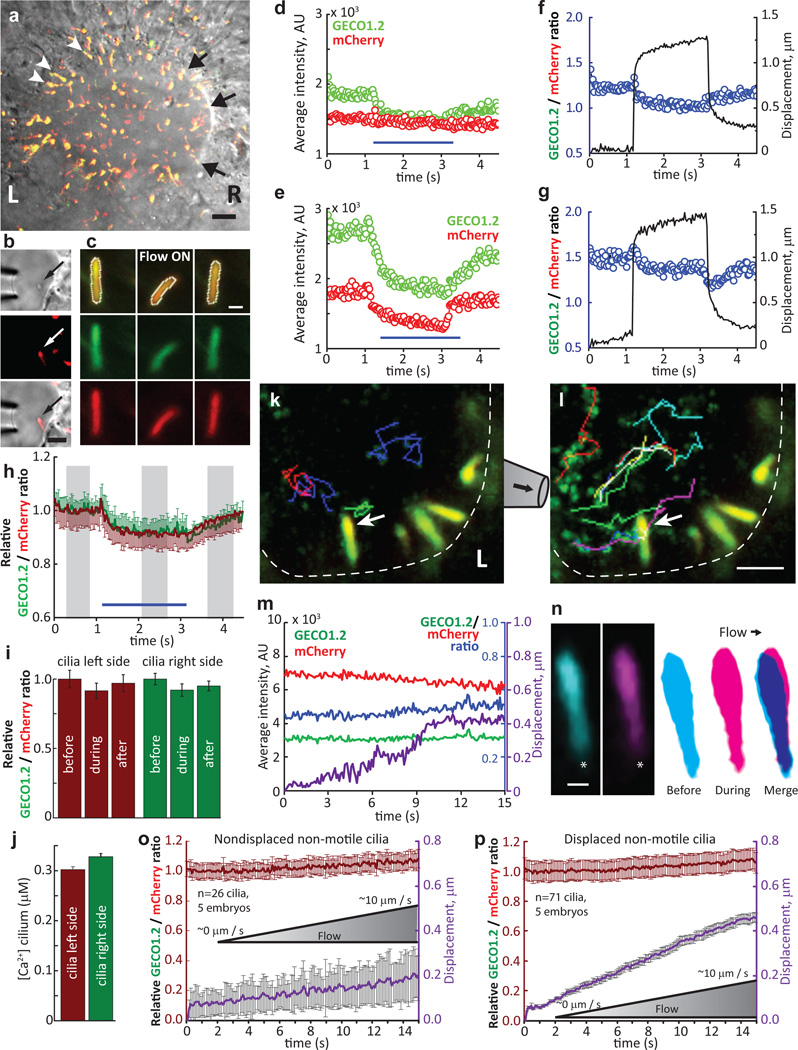
Primary cilia are solitary, generally non-motile, hair-like protrusions that extend from the surface of cells between cell divisions. Their antenna-like structure leads naturally to the assumption that they sense the surrounding environment, the most common hypothesis being sensation of mechanical force through calcium-permeable ion channels within the cilium. This Ca(2+)-responsive mechanosensor hypothesis for primary cilia has been invoked to explain a large range of biological responses, from control of left-right axis determination in embryonic development to adult progression of polycystic kidney disease and some cancers. Here we report the complete lack of mechanically induced calcium increases in primary cilia, in tissues upon which this hypothesis has been based. We developed a transgenic mouse, Arl13b-mCherry-GECO1.2, expressing a ratiometric genetically encoded calcium indicator in all primary cilia. We then measured responses to flow in primary cilia of cultured kidney epithelial cells, kidney thick ascending tubules, crown cells of the embryonic node, kinocilia of inner ear hair cells, and several cell lines. Cilia-specific Ca(2+) influxes were not observed in physiological or even highly supraphysiological levels of fluid flow. We conclude that mechanosensation, if it originates in primary cilia, is not via calcium signalling.


Figures

Extended Data Figure 1
Extended Data Figure 1. Arl13b-mCherry-GECO1.2 identifies primary cilia
Arl13b-mCherry-GECO1.2 contains an improved genetically encoded calcium indicator (GECI) with an apparent kD of 450 nM (Extended Data Fig. 2), well suited to work within the reported range of ciliary Ca2+ concentrations ([Ca2+]cilium). The genomic integration site of the transgene is within a non-coding region of chromosome 1 (Extended Data Fig. 2) and transgenic animals maintained as homozygotes (Arl13b-mCherry-GECO1.2tg/tg) are viable, have average litter sizes, and do not show phenotypes consistent with cilia defects (e.g., situs inversus, organ malformation; Extended Data Fig. 2). a, Frozen tissue section of P21 mouse kidney. GECO1.2 and mCherry are preferentially localized to cilia, identified by the cilia-specific marker, anti-acetylated tubulin antibody. b, c, Primary mIMCD cells isolated from kidneys of P14-P21 Arl13b-mCherry-GECO1.2 transgenic mice. Ciliary localization (arrow) of anti-polycystin 2 antibody in c. Scale bars, 10 µm. d, Two OHC hair bundles marked with the actin-binding peptide, phalloidin. One of the stereocilia bundles expresses Arl13b-mCherry-GECO1.2. Kinocilia on both OHCs marked with an antibody to acetylated tubulin, express Arl13b-mCherry-GECO1.2. Scale bar, 5 µm. e, Scanning electron micrograph of a primary mIMCD cell. Left: Red dashed line outlines a single mIMCD cell; white circle indicates the primary cilium: Scale bar, 10 µm. Right, magnified image. No defects in cilia formation were evident following 3–4 days in culture. Scale bar, 500 nm. All images are representative of >10 images taken of biological triplicates.
Extended Data Figure 2
Extended Data Figure 2. Arl13b-mCherry-GECO1.2 transgenic mouse
a, Transgene orientation and integration site. The transgene was integrated into the noncoding region of Chromosome 1 (pos. 174,611,500). b, The genotype of transgenic animals was determined by PCR using primers 372-up: ACATGGCCTTTCCTGCTCTC, 372-down: TTCAACATTTCCGTGTCGCC and 944-down: GACATCTGTGGGAGGAGTGG. The PCR product for wt genomic sequence was ~800 bp; the transgene PCR product was ~400 bp. c, mIMCD cells isolated from Arl13b-mCherry-GECO1.2tg mice were imaged after permeabilisation with 15 µM digitonin in varying extracellular [Ca2+]. Average ratios (n = 12 cilia per each data point) are plotted vs. free [Ca2+]. Arl13b-mCherry-GECO1.2 calibration fitted by a Boltzmann curve (R2 = 0.98; kD = 442 nM). d, Phenotype of Arl13b-mCherry-GECO1.2tg/tg mice. Mouse organ morphology/orientation appeared normal (situs inversus was not observed) and breeding animals had normal litter sizes (6–8 for C57Bl/6). All error bars ± SEM.
Extended Data Figure 3
Extended Data Figure 3. Arl13b-mCherry-GECO1.2tg/tg mouse organ of Corti hair cells develop normal stereocilia bundles
Hair bundles from Arl13b-mCherry-GECO1.2tg/tg mice during development. a–d, Cochlear hair cells acutely dissected at age E18 appear normal. a, IHC, with kinocilium not attached to stereocilia. b–c, OHC stereocilia bundles with some kinocilia attached to the bundles. d, IHC bundle with kinocilium attached at tip. e–i, Cultured organ of Corti explant dissected at P1 + 1 day in vitro. e, OHC with normal shape and stereocilia staircase structure. f, OHC stereocilia bundle with kinocilium. g, IHC with normal shape and stereocilia staircase structure; tip links and other links present. h, Pair of stereocilia (dashed box in f) at higher magnification. i, IHC with kinocilium attached at tip. Scale bars, 1 µm (except g, 100 nm). All images are representative of >3 images.
Extended Data Figure 4
Extended Data Figure 4. GECO1.2 koff for Ca2+ dissociation from GECO1.2, measured in cells
a, b, Fig. 1g at higher time resolution. F_GECO1.2/F_mCherry ratio (open circles) relative to bundle motion (black line) at the initial deflection, a, and after return to the resting position, b. Bundle deflection preceded the F_GECO1.2/F_mCherry ratio increase by two frames (~60 ms). At the termination of the flow stimulus and return to the resting position, the ratio remained elevated due to the slow decay (τ ~ 0.6 s) of the Ca2+ from GECO1.2. c, Rapid Ca2+ uncaging was used to measure the Ca2+ decay rates for GECO1.2 (not bound to the membrane), Arl13b-mCherry-GECO1.2 (bound to the membrane), and the Fluo-4 control with its established time constant of decay. HEK293 cells were transfected with GECO1.2 or Arl13b-mCherry-GECO1.2 constructs and loaded with caged Ca2+ (NP-EGTA), or loaded with a combination of Fluo4-AM and NP-EGTA. Caged Ca2+ was released by a local 100–200 ms pulse of UV laser illumination (white box); images were acquired in line scan mode (2 ms/horizontal line). Representative of >16 images. d, Representative fitted fluorescence intensity decays of Fluo-4 in HEK293 cells (black), GECO1.2 (red), and Arl13b-mCherry-GECO1.2 (blue), compared to GECO1.2 from Arl13b-mCherry-GECO1.2tg IHCs following deflection (green). e, Table summarizing molecular properties of genetically encoded calcium indicators (GECI’s) used in current and previous reports describing ciliary Ca2+ signaling–,,–. f, Average decay rates, τ, for indicators in c, d. Fluo-4: τ = 154 ± 36 ms (n=16); GECO1.2 in HEK293 cells: τ = 203 ± 50 ms (n=19); Arl13b-mCherry-GECO1.2 in HEK293 cells: τ = 358 ± 55 ms (n=16); Arl13b-mCherry-GECO1.2 in IHC stereocilia: τ = 601 ± 70 ms (n=10). Averages ± S.D.
Extended Data Figure 5
Extended Data Figure 5. Kidney tubule dissection and flow velocity calibration
a, Calibration of the fluid velocity exiting the stimulus pipette vs. distance from the mouth of the pipette (3-µm pipette, 6.4 mm Hg pressure step). The pipette was positioned ~4–6 µm from the cilium, delivering a flow velocity of 250–300 µm/s (n=5). b, Velocity measured at the tip of the cilium and calculated shear stress at the plasma membrane (n=6). c, Microdissection of kidney tubules. c1: Coronal section of P15 kidney; white box indicates the microdissected area. c2: Area from c1 following microdissection. c3: Small bundle of tubules; individual tubules gently separated from the bundle (arrow). c4: Tubules with thick walls and fluorescent cilia (asterisk) used for experiments. Scale bar, 5 µm. Images representative of >6 preparations. d, Maximum intensity z-projection of mIMCD primary cilia deflected in the flow chamber using defined fluid velocities. Scale bar, 3 µm; representative of 14 cilia each with 7 z-stacks containing 12 frames. e, Relative ratio changes in primary mIMCD primary cilia during deflection, 3 experimental conditions. Black and blue lines represent the averaged normalized ratio changes for top views of cilia deflection in 1.3 mM and 50 nM [Ca2+], respectively. The increase in ratio upon cilia deflection is comparable between high and low external [Ca2+], suggesting that the ratio change did not result from Ca2+ entry (Fig. 3h for p values). In addition, the return to baseline with cilium movement was much faster than the Ca2+ indicator response time, providing further evidence that it is a motion artifact. Such fast responses were not observed in the bona fide Ca2+ entry into IHC stereocilia (Fig. 2a, Extended Data 4b, d). Purple line represents the average normalized ratio changes for side-imaged cilia deflections in the presence of 1.3 mM [Ca2+]. Ratio changes were negligible in side views, as the motion artifact (light path length change upon motion) is small. The positive slope seen in top views results from differential dye bleach, faster for mCherry than GECO1.2. Bleaching has a much more pronounced effect in top views, probably from the change in geometry, contribution from underlying autofluorescence, and relative light exposure upon bending. f, Micropipette used for cilia deflection inside the kidney tubules. Scale bar, 0.5 mm. g, Insertion of micropipette into the tubule. Scale bar, 100 µm. All error bars ± SEM.
Extended Data Figure 6
Extended Data Figure 6. Deflection of primary cilia in the presence of 50 nM [Ca2+] reveals focal plane-dependent artifact present in ‘top view’ imaging conditions. Saturation controls for sensor
a–c, An mIMCD cell cilium was repeatedly deflected in a low (50 nM) [Ca2+] solution. The same flow stimulus (same pipette) was applied to the cilium while imaging in different focal planes. Top panels: experimental arrangement and fluorescence images of the cilium; red dashed lines indicate the focal plane for each set of images. Middle panels (a’–c’): average fluorescence intensity change for GECO1.2 (green) and mCherry (red) during deflection (black). Lower panels (a”–c”): ratio change (blue) during deflection (black). a, Primary cilium near its attachment to the cell. b, At a slightly higher focal plane, deflection enlarges the cross section of the cilium. c, A focal plane ~1 µm above the cell surface. Different segments of the same cilium were imaged upon deflection. Note that the artifact increases with larger cross section changes. Thus, top view imaging of cilia is fraught with two interrelated artifacts: 1) at high z-resolution (0.8 µm), the section of the cilia being imaged changes upon deflection, thus conflating fluorescence changes from different regions of the cilium; 2) at lower z-resolution, the path length, fluorescent indicator volume, and optical properties of the cilium above and below the image plane all change upon deflection and thus contribute to the apparent [Ca2+] reporter changes. d–e, Digitonin permeabilization indicates that the Arl13b-mCherry-GECO1.2 sensor is not saturated in measurements of primary cilia and kinocilia. Scale bars, 2 µm. d, Top: mIMCD cell cilium deflected by fluid flow containing 10 µM digitonin. Bottom left: mCherry fluorescence (red) decreased due to cilia motion (black). GECO1.2 fluorescence (green) rose ~1 s later, as permeabilisation initiated Ca2+ influx. Right: F_GECO1.2/F_mCherry ratio increased ~4.2-fold upon permeabilisation. Representative of 13 videos × 400 frames. e, Kinocilia of E15 cochlear hair cells. Digitonin (10 µM) increased the kinocilium’s normalized F_GECO1.2/F_mCherry ratio by 4.6-fold. Representative of 6 videos × 400 frames. Similar results were obtained in P3 hair cell kinocilia (data not shown).
Extended Data Figure 7
Extended Data Figure 7. No change in [Ca2+]cilium during mechanical stimulation of primary cilia in MLO-Y4 and Ocy454 osteocyte-like cells, and primary MEF cells
a–c, Cultured MLO-Y4 (a, representative of 24 videos × 150 frames), Ocy454 (b, representative of 11 videos × 150 frames) and MEF cells isolated from E14 Arl13b-mCherry-GECO1.2tg:GCaMP6ftg:E2a-Cretg mice (c, representative of 25 videos × 150 frames) were imaged from above; stimulus pipette was placed ~4–6 µm away from the cilium. Images: cilium before, during and after deflection by a 2 s, ~250 µm/s flow stimulus. The ROI was identified frame-by-frame by a MATLAB tracking algorithm and GECO1.2 and mCherry fluorescence quantified. Scale bar, 1 µm. d–f, Quantification of the channel intensities from the cilia in a–c. Average fluorescence intensity for both GECO1.2 and mCherry signals decreased as the cilia flattened and the light path length via the cilium volume changed. Cilium ROI displacement is superimposed in grey. g–i, Ratioing GECO1.2 and mCherry fluorescence compensated for the path-length artifact (see also Extended Data Fig. 6), revealing no Δ[Ca2+] during deflection. Cilium ROI displacement is superimposed in grey. j, Average ratio changes (F_GECO1.2/F_mCherry) for MLO-Y4 (red, n=24), Ocy454 (purple, n=11) and MEF (blue, n=25) primary cilia. The small continuous positive slope during the entire course of the experiment results from differential dye bleaching (mCherry > GECO1.2). All error bars ± SEM.
Extended Data Figure 8
Extended Data Figure 8. Flow-dependent [Ca2+] increases originate in the cytoplasm in MEF cells
a, Representative image sequence of cultured MEF cells responding to 1 dyn/cm2 fluid flow in a flow chamber. Cells were isolated from E14 Arl13b-mCherry-GECO1.2tg:GCaMP6ftg:E2a-Cretg mice, expressing Arl13b-mCherry-GECO1.2 in primary cilia, and GCaMP6f in the cytoplasm. GCaMP6f fluorescence intensity is presented as pseudocolor heatmap; arrows point to the cells that respond to the flow stimulus, circles indicate ROI used for analysis in f; imaging rate, 0.6 fps; scale bar, 10 µm. Representative of 19 videos × 60 frames. b-b”, Representative image sequence of cultured MEF cell responding to a single cycle of oscillatory fluid flow (OscFF ). Top row: GCaMP6f + GECO1.2 fluorescence intensity presented as pseudocolor heatmap; Middle row: mCherry fluorescence; Bottom row: merged GCaMP6f + GECO1.2 (green) and mCherry (red) signals. Left panel, b, average of ~10 consecutive frames before stimulus application; 1.2 s into the experiment, an alternating pressure stimulus was applied to the cell membrane, away from the cilium (positive, then negative, ~1.5 s each, diagram shown in b’). Following the stimulus (b”; each image is an average of 3–5 consecutive frames at the time point reflected on the image), a Ca2+ wave originating from the plasma membrane/cytoplasm spreads across the cell body. As seen on the image sequence, a single cycle of strong OscFF application to the cell membrane initiates a Ca2+ increase in the cytoplasm (whether from across the plasma membrane or from intracellular stores was not determined). Negligible cilium movement has been detected in this particular case (~200 nm, grey trace in c), as the cilium was located under the cell, between the cell and the coverslip. Scale bar, 5 µm. Representative of 40 videos × 450 frames. c, Quantification of (F_GECO1.2 + F_GCaMP6f), green and F_mCherry, red, channel intensities in the cilium in b. The ROI was identified frame-by-frame by a MATLAB tracking algorithm and average fluorescence plotted as a function of time. Cilium ROI displacement is superimposed in grey. d, Average GCaMP6f (cytoplasm) fluorescence intensity in the ROI depicted in b” (white circle), superimposed with ciliary (F_GECO1.2 + F_GCaMP6f)/F_mCherry ratio (purple trace) showing an earlier Ca2+ onset for the cytoplasmic GCaMP6f indicator. Dashed box outlines the data shown in e. e, Same as in c, but with higher time resolution. Ciliary [Ca2+] increase is ~200 ms delayed from the cytoplasmic Ca2+ increase, showing the necessity for high imaging rates for Ca2+ imaging of cilia. f, Quantification of GCaMP6f fluorescent intensity change over time for 4 cells from a; ROIs depicted in a. Dashed line: Threshold for labeling a cell as responsive (20% change in fluorescent intensity). All selected cells except that represented by the magenta trace, responded to the flow. g, MEF cell response rate in flow chamber and pipette flow application experiments. Blue and red bars represent 1 dyn/cm2 application in flow chamber experiments; ~40% of the cells responding to the flow. Apyrase (7 unit/ml) application did not change the response rate, suggesting that ATP release is not a major contributor to flow-induced Ca2+ response in this cell type. Remaining bars represent single cell imaging experiments with local flow delivery via pipette, using cells in 3 conditions: low confluency cells (~15%), with 24 h (green bar) and 48 h (purple bar) serum starvation to promote cilia formation, and highly confluent coverslips without serum starvation (light blue bar). Arrest of MEF cells in G0 sensitizes cells to respond to flow stimulus with intracytoplasmic Ca2+ changes. All error bars ± SEM.
Extended Data Figure 9
Extended Data Figure 9. Flow-dependent [Ca2+] increases originate in the cytoplasm in primary mIMCD cells
a, Cultured primary mIMCD cells, isolated from Arl13b-mCherry-GECO1.2tg:GCaMP6ftg:E2a-Cretg mice, respond to 1 dyn/cm2 shear stress in a flow chamber. GCaMP6f fluorescence intensity is presented as pseudocolor heatmap, arrows point to the cells that respond to the flow stimulus; Imaging rate, 0.8 fps; scale bar, 10 µm. Representative of 6 videos × 100 frames. Circles indicate ROI’s used for analysis in f. b, Cultured mIMCD cell with cytoplasmic Ca2+ oscillations following flow application. Pipette outline on the image represents its approximate position, an arrow inside the pipette represents the direction of the flow. An alternating flow stimulus deflects the primary cilium (red) in positive and negative directions. This deflects the cell membrane, resulting in Ca2+ increases in the cytoplasm. Although it is well known that mechanical force can initiate increases in cytoplasmic Ca2+, there are several potential sources (plasma membrane rupture, mechanosensitive ion channels, ATP release and purinergic receptor activation, intracellular Ca2+ stores) that appear to depend on cell type and conditions. No change in ciliary [Ca2+] is evident until the cytoplasmic Ca2+ reaches the cilium (arrowhead, 2.55 s). Top row: GCaMP6f + GECO1.2 fluorescence intensity presented as a pseudocolor heatmap; Middle row, mCherry signal intensity; Bottom row, merged GCaMP6f+GECO1.2 (green) and mCherry (red) fluorescence signals. Asterisks indicate the base of the cilium. Imaging rate, 33 fps; scale bar, 5 µm. Representative of 17 videos × 450 frames. c, Fast imaging during supraphysiological flow application to primary cilium of cultured mIMCD cells reveals ciliary damage and subsequent increase of ciliary [Ca2+]. GCaMP6f+GECO1.2 fluorescence intensity, pseudocolor heatmap (left); mCherry signal, red (right). At flow rates greater than 10 times those used for ciliary deflection, the ciliary membrane disintegrates and distal parts of the cilium (arrowheads) detach. Following ciliary tip damage, Ca2+ enters the cilium from the break point. Ciliary Ca2+ influx does not occur before detachment of ciliary tip, presumably when the membrane experiences the highest force and stretch, Arrow: direction of the flow. Imaging rate, 100 fps; Scale bar, 2 µm. Representative of 13 videos × 3000 frames. d–e, Quantification of GCaMP6f+GECO1.2 and mCherry fluorescence intensities from the cilium in c. Arrow, ciliary tip detachment event. The ROI was identified frame-by-frame by a MATLAB tracking algorithm and GECO1.2 and mCherry fluorescence, d, and ratio, e, plotted as a function of time. Cilium ROI displacement is superimposed (purple). f, Quantification of GCaMP6f + GECO1.2 fluorescence intensity change over time for 4 representative cells in a; ROIs depicted in a (left panel). Dashed line, 20% threshold defining responsive cells. All selected cells (except that represented by the green trace) responded to flow. g, Cultured primary mIMCD cell response rate in flow chamber and pipette flow application experiments. Blue bar, flow application performed in a flow chamber; ~46% of the cells respond to 1 dyn/cm2 shear stress. Green and purple bars represent single cell imaging experiments for highly confluent cells (~80%), without (green bar) or following (purple bar) 48 h serum starvation. Light blue bar, cells following 48 h serum starvation in response to damaging flow stimulus. All error bars ± SEM.
Extended Data Figure 10
Extended Data Figure 10. Cytoplasmic Ca2+ signaling in the embryonic node of Arl13b-mCherry-GECO1.2tg: GCaMP6ftg:E2a-Cretg embryos
a–a”, Representative images of embryos within the developmental window used: from early bud (EB, a), early headfold (EHF, a’) to 2–3 somite stage (2–3S, a”). Scale bars, 200 µm. Each panel is a representative of ≥ 5 images. b, Drawing (top) and image (bottom) of the embryo mounting plate used for imaging. Scale bar, 10 mm. c, Embryos were mounted with the node facing up. Pipette used for cilia deflection is shown in blue. d, DIC image of embryo with the node outlined by the dashed line. Scale bar, 100 µm. Representative of 14 images. e, Representative image of an embryonic node of an Arl13b-mCherry-GECO1.2tg:GCaMP6ftg:E2a-Cretg EHF embryo, expressing GCaMP6f in the cytoplasm to visualize cytoplasmic Ca2+ oscillations. Scale bar, 20 µm. Representative of 3 videos × 300 frames. f, Mapping of cytoplasmic Ca2+ oscillations in close proximity to the embryonic node. Only ΔF/F > 30% were included in the analysis. Nodal perimeter is outlined with white dashed line. g, Quantification of cytoplasmic Ca2+ signals shown in (e, f) occurring within 0.01 mm2 on either the left or the right side of the embryonic node. Left side: 8.3 ± 2.3 min−1, right side: 7.6 ± 1.2 min−1, n = 5 embryos; this difference was not statistically significant between the late bud (LB) and late headfold (LHF) stage see also ref. (Supplementary Video 10). h–i, Average ratio changes (F_GECO1.2/F_mCherry) of crown cell primary cilia from the left side of the embryonic node of Arl13b-mCherry-GECO1.2tg/tg:GCaMP6f:E2a-Cretg expressing EHF embryos during the application of physiological levels of flow (slow deflection; note longer imaging time of 15 s). Flow velocity, calibrated in-frame using fluorescent beads, was slowly increased (ramped); see also Fig. 4 k–l. Cilia were divided into two groups: h, the average ratio change for displaced cilia (n=34 cilia from 5 embryos; average centroid displacement was 409 ± 35 nm); i, the average ratio change for nondisplaced cilia (n = 23 cilia from 5 embryos). All error bars ± SEM.
Figure 1
Figure 1. Genetically encoded Ca2+ indicator localizes to primary cilia and cochlear hair cell bundles
a, P14 kidney section expressing Arl13b-mCherry-GECO1.2 in primary cilia. Cilia (white arrows) point into the lumen of an aquaporin 2-positive tubule (*). Scale bar, 5 µm. b, Aqp2 in primary epithelial cells isolated and cultured (3 d.i.v.) from kidney papilla of P14-P21 Arl13b-mCherry-GECO1.2tg/tg mice (Extended Data Fig. 1). Scale bar, 10 µm. c, Embryonic node from an Arl13b-mCherry-GECO1.2tg mouse. mCherry and GECO1.2 in cilia of the embryonic node overlap with the cilia marker, acetylated tubulin. Scale bar, 10 µm. d, Arl13b-mCherry-GECO1.2 expression in IHCs. P4 organ of Corti explant showing two hair bundles; mCherry fluorescence (red), phalloidin-labeled actin (blue), and antibody to acetylated tubulin (green). Arl13b-mCherry-GECO1.2 protein localizes to all kinocilia as demonstrated by overlapping acetylated tubulin staining (arrows). Later in development, Arl13b-mCherry-GECO1.2 also localizes to stereocilia bundles of some IHCs and OHCs (mCherry-positive bundle, arrowhead; Extended Data Fig. 1). Scale bar, 5 µm. e–g, Deflection of IHC stereocilia bundle. ROI: white outline. e, GECO1.2 and mCherry fluorescence in stereocilia before, during, and after deflection. A 1s flow stimulus (Supplementary Video 1) increased GECO1.2 fluorescence as Ca2+ entered the shorter rows of stereocilia. Scale bar, 5 µm. f, GECO1.2 and mCherry average fluorescence intensities (A.U.) within the ROI; bundle displacement during deflection (black). Deflection increased GECO1.2 fluorescence 3-fold; mCherry bleached only slightly. g, Change of stereocilia F_GECO1.2/F_mCherry ratio during the deflection (blue symbols); bundle displacement, black. After stimulus, the bundle rapidly returned to its resting position while Ca2+ fluorescence decayed slowly (τ = 0.6 s; Extended Data Fig. 4a–b). Images acquired sequentially, 30 ms/paired frame. All images are representative of >10 images taken of biological triplicates.
Figure 2
Figure 2. No change in [Ca2+]cilium in kinocilia of developing hair cells
a, Average ratio changes in stereocilia for IHC bundle deflections in P5+3 d.i.v. organ of Corti explants (n in brackets). b, Average ratio changes for IHC kinocilia (red, n=36), OHC kinocilia (green, n=38) and supporting-cell (SC) primary cilia (blue; n=85). The small positive slope results from differential dye bleaching (mCherry > GECO1.2). c, Normalized average fluorescent ratio changes at times boxed in a and b. Digitonin applied locally to permeabilise the membrane evoked a ~5-fold ratio increase in hair cell kinocilia and SC primary cilia (brown bars). Black bar: normalized ratio before; blue bar: during; red bar: after application. IHC bundle deflection increased stereocilia ratios ~3-fold, persisting well after the bundle returned to its initial position. E14 and E15 explants showed no ratio change in any organ of Corti (OC) primary cilia. d, Kinocilia of IHC, OHC and SC, from E17 to P3, show no ratio change upon deflection. The slight variability of the ratios from the SC cilia (before, during, after) is similar to the variability of the ratios in IHC and OHC kinocilia. e, f, Individual IHC (e) and OHC (f) kinocilia at P0. GECO1.2 (green) and mCherry (red) intensities and their ratio (blue) shows no Ca2+ influx upon deflection. Kinocilium displacement in grey (bottom panel). Student’s t-test, * = p<0.05, ** = p<0.01, # = p<0.001. All error bars ± SEM.
Figure 3
Figure 3. No change in [Ca2+]cilium during mechanical stimulation of kidney primary cilia
a, mIMCD primary cilium at eight flow velocities (Extended Data Fig. 5). Scale bar, 5 µm; representative of 14 cilia (8 z-stacks, 12 focal planes each). b, Cilium deflection as a function of flow velocity and shear stress (n=14). c, Cultured primary mIMCD cells from P14-P21 Arl13b-mCherry-GECO1.2tg/tg mice imaged from above (top panels; 87 videoes, 150 frames each: abbrev. 87v×150f) or the side (bottom, 32v×150 frames); pipette ~4–6 µm from cilium (Supplementary Video 2). Images: before, during, after 2s, ~250 µm/s flow velocity stimulus. A MATLAB tracking algorithm identified the ROI frame-by-frame and quantified GECO1.2 and mCherry fluorescence. Scale bars, 2 µm; d, Channel intensities from c top panel. When flow flattened cilia, average GECO1.2 and mCherry signals decreased due to changes in the light path. e, Ratioing GECO1.2 and mCherry fluorescence reduced artifact (Extended Data Fig. 6), revealing no Δ[Ca2+] during deflection. f, Side view fluorescence of c, bottom panel; GECO1.2 and mCherry fluorescence was relatively constant. g, Side-imaged F_GECO1.2/F_mCherry ratio unchanged by deflection. h, Normalized F_GECO1.2/F_mCherry ratios for positive controls (IHC stereocilia bundle deflection; data from Fig. 2c, and digitonin application); and for mIMCD primary cilia deflections in high and low [Ca2+], n in brackets. Small ratio differences are due to motion artifact (Supplemental Information, Extended Data Fig. 6). i, Perfusion of acutely dissected kidney thick ascending limb tubules (representative of 4 preparations) (Extended Data Fig. 5). Green: GECO1.2 and cytoplasmic autofluorescence; Red: mCherry. A train of increasing 1s pressure steps deflected intratubular cilia (arrowheads; Supplementary Video 5). Right panel, mCherry signal overlay from images before (cyan) and during (magenta) cilia deflection. Scale bars, 5 µm; 16v×200f (middle) j, No Δ[Ca2+] cilium for the smallest displacement in i. k, No Δ[Ca2+]cilium before, during and after deflection, data from j; (1.0 ± 0.06 before vs. 0.99 ± 0.06 during, n=16 cilia). Student’s t-test, # = p<0.001, ns = not significant. Error bars ± SEM.
Figure 4
Figure 4. No change in [Ca2+]cilium in primary cilia of the embryonic node
aArl13b-mCherry-GECO1.2tg embryonic node, early headfold stage (EHF); l=left, r=right. Nonmotile cilia; l, white arrowheads; r, black arrows. Scale bar, 20 µm. (n=4 embryos) b, Crown-cell cilia deflected by 2s/~200 µm/s flow velocity. 2v×500 frames. Scale bar, 5 µm. c, Cilia from the l outer perimeter before (l), during (mid) and after (r) ~200 µm/s flow velocity. Top row: merged GECO1.2 and mCherry signals. White outline, ROI. 32v×150f. d, e, GECO1.2 and mCherry fluorescence of a l (d) and r (e) nodal cilium; ~200 µm/s. f, g, Ratiometric changes on l (f) and r (g) sides; ~200 µm/s cilia deflection (black trace; same cilia as d, e). h, Average relative ratio changes for cilia on the l (burgundy, n=29) and r (green, n=15) sides of the node. i, Relative ratio changes; grey boxes in h, time blocks quantified. j, Resting [Ca2+] in l- and r-side nonmotile primary cilia. [Ca2+] calculated as in Extended Data Fig. 2, Methods). (l cilia: 1.0, n=67, 4 nodes; r cilia: 1.1, n=72, 5 nodes); resting [Ca2+] l: 302±6 nM; r: 320±7 nM). k–l, Cilia on the I outer perimeter (dashed white line) with no net flow, k, or ~10 µm/s flow velocity, l, measured near the cilium (arrow). Coloured lines, tracks of beads; Supplementary Video 9). Scale bar, 5 µm; 42m×150f. m, Traces of cilium in k–l (arrow). Displacement of cilium during 0 to 10 µm/s ramp in purple. n, Cilium in k (arrow) at ~0 µm/s (l, frame average), ~10 µm/s (middle, frame average, end of deflection), and superposition (r, note <1 µm deflection). *, ciliary base. Scale bar, 500 nm; 42m×150f. o, p, Ratio changes of I crown-cell cilia from LB to 3-somite stage during flow from ~0 to ~10 µm/s velocities. o, Ratio change for nondisplaced cilia (n=26 cilia, 5 embryos), p, Ratio change for displaced cilia (n=71 cilia, 5 embryos; avg. centroid displacement, 458 ± 22 nm). All error bars ± SEM.

Comment in

References

    1. Zimmerman K, Yoder BK. SnapShot: Sensing and Signaling by Cilia. Cell. 2015;161:692–692. e691. - PMC - PubMed
    1. Hamada H. Role of physical forces in embryonic development. Semin Cell Dev Biol. 2015;47–48:88–91. - PubMed
    1. Nauli SM, Alenghat FJ, Luo Y, Williams E, Vassilev P, Li X, Elia AE, Lu W, Brown EM, Quinn SJ, Ingber DE, Zhou J. Polycystins 1 and 2 mediate mechanosensation in the primary cilium of kidney cells. Nat Genet. 2003;33:129–137. - PubMed
    1. Corey DP, Hudspeth AJ. Ionic basis of the receptor potential in a vertebrate hair cell. Nature. 1979;281:675–677. - PubMed
    1. Corey DP, Hudspeth AJ. Response latency of vertebrate hair cells. Biophys J. 1979;26:499–506. - PMC - PubMed

References for Methods and SI

    1. Faust D, Geelhaar A, Eisermann B, Eichhorst J, Wiesner B, Rosenthal W, Klussmann E. Culturing primary rat inner medullary collecting duct cells. J Vis Exp. 2013 - PMC - PubMed
    1. Palmer LG, Frindt G. Gating of Na channels in the rat cortical collecting tubule: effects of voltage and membrane stretch. J Gen Physiol. 1996;107:35–45. - PMC - PubMed
    1. Takao D, Nemoto T, Abe T, Kiyonari H, Kajiura-Kobayashi H, Shiratori H, Nonaka S. Asymmetric distribution of dynamic calcium signals in the node of mouse embryo during left-right axis formation. Dev Biol. 2013;376:23–30. - PubMed
    1. Downs KM, Davies T. Staging of gastrulating mouse embryos by morphological landmarks in the dissecting microscope. Development. 1993;118:1255–1266. - PubMed
    1. Yoshiba S, Hamada H. Roles of cilia, fluid flow, and Ca2+ signaling in breaking of left-right symmetry. Trends Genet. 2014;30:10–17. - PubMed

Publication types