. 2016 Mar 31;531(7596):642-6.
doi: 10.1038/nature17400. Epub 2016 Mar 23.

Nucleus accumbens D2R cells signal prior outcomes and control risky decision-making

Affiliations

Nucleus accumbens D2R cells signal prior outcomes and control risky decision-making

Kelly A Zalocusky et al. Nature. .

Abstract

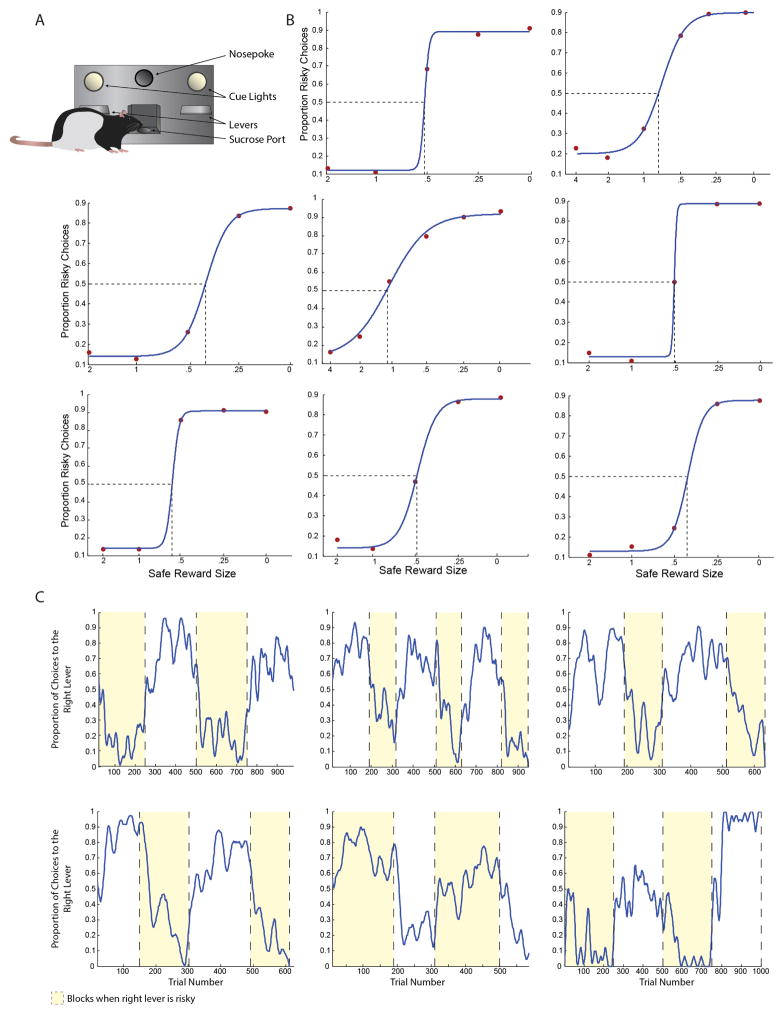
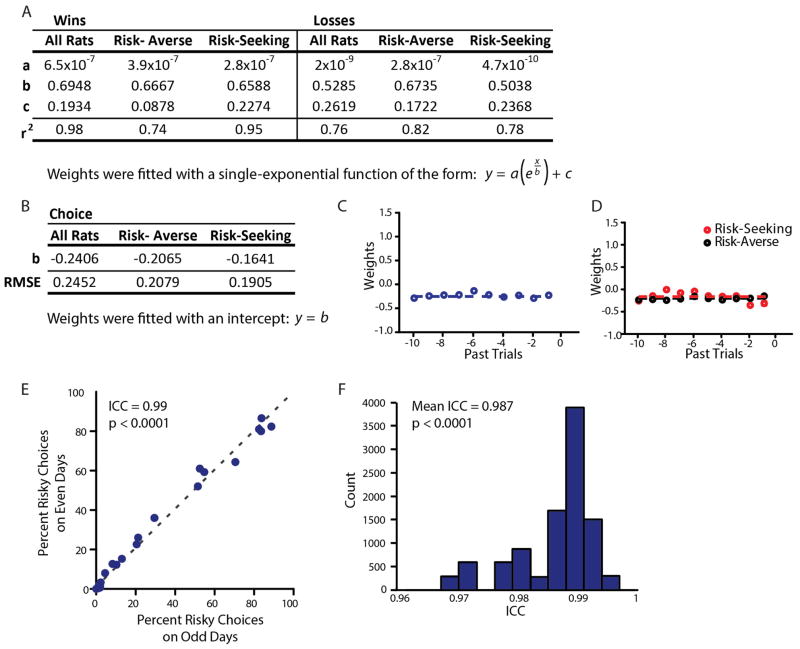
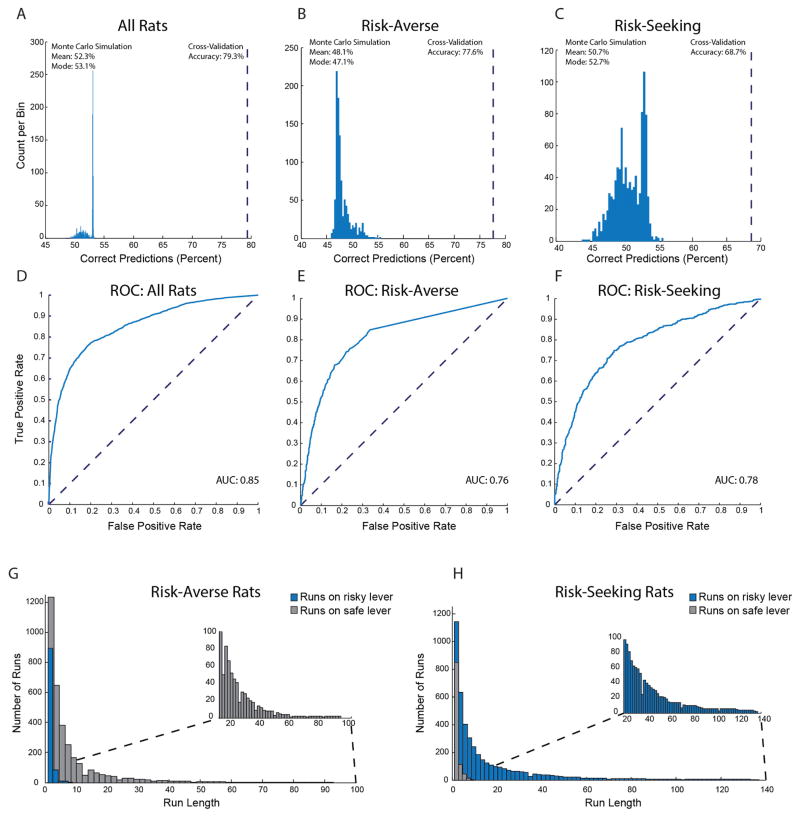
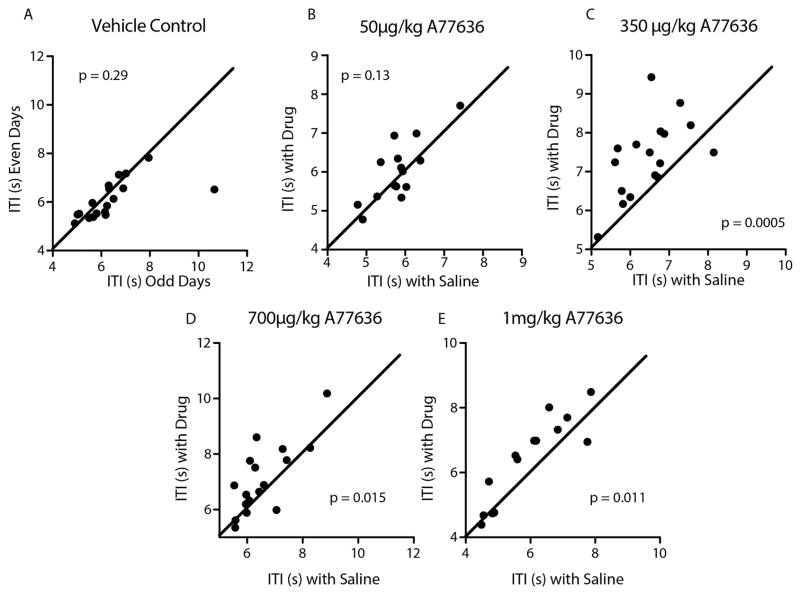
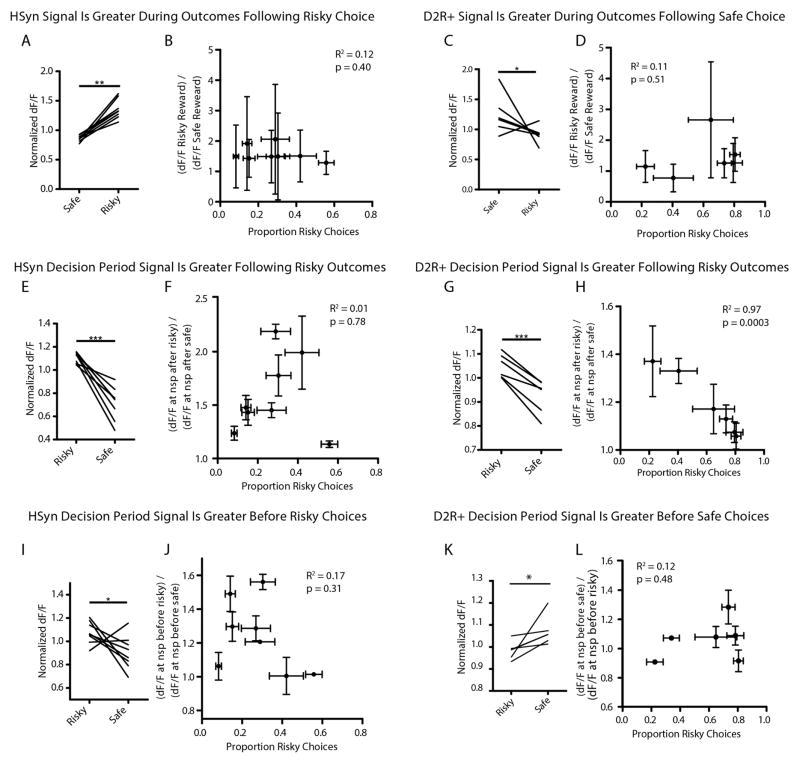
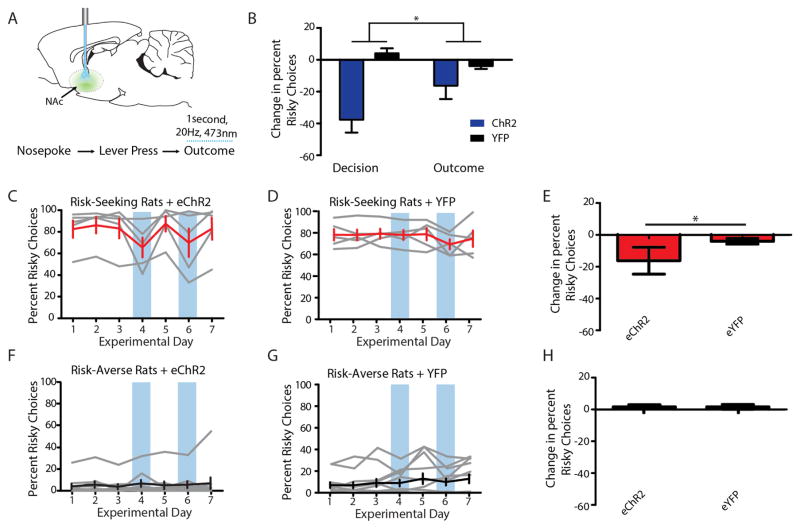
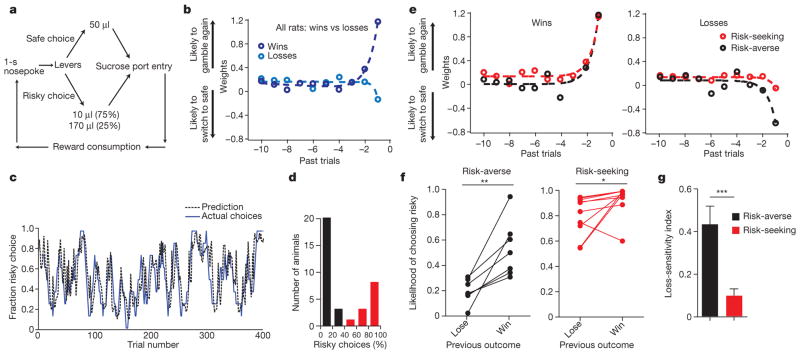
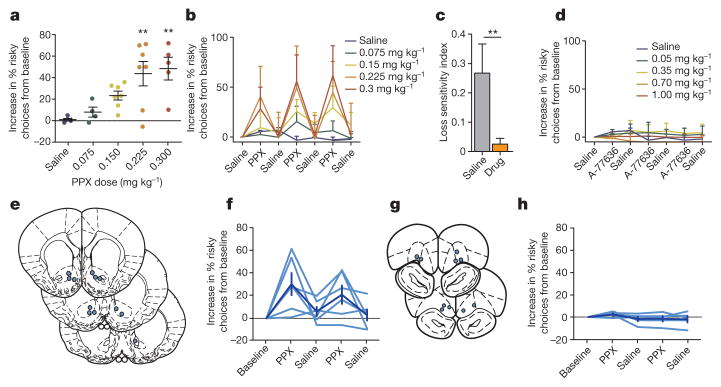
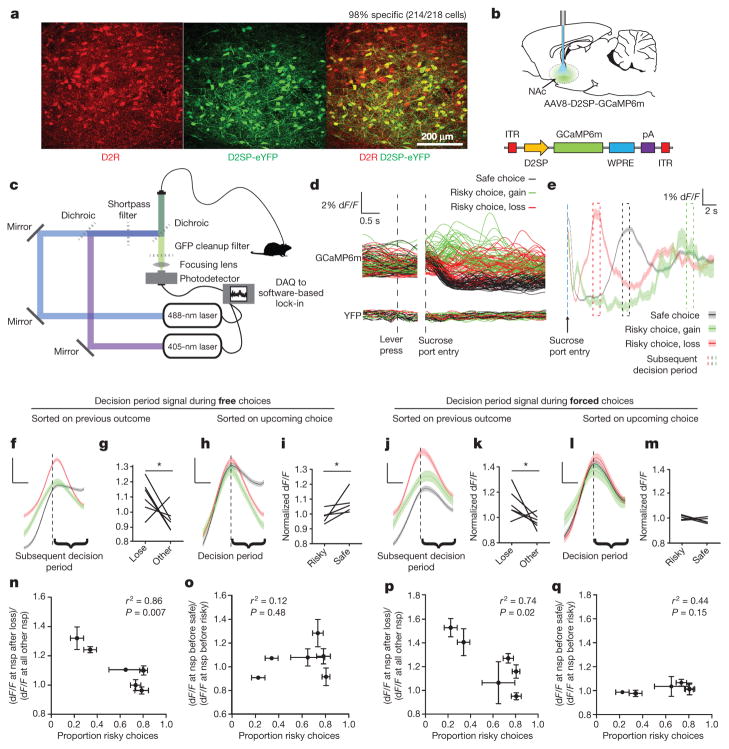
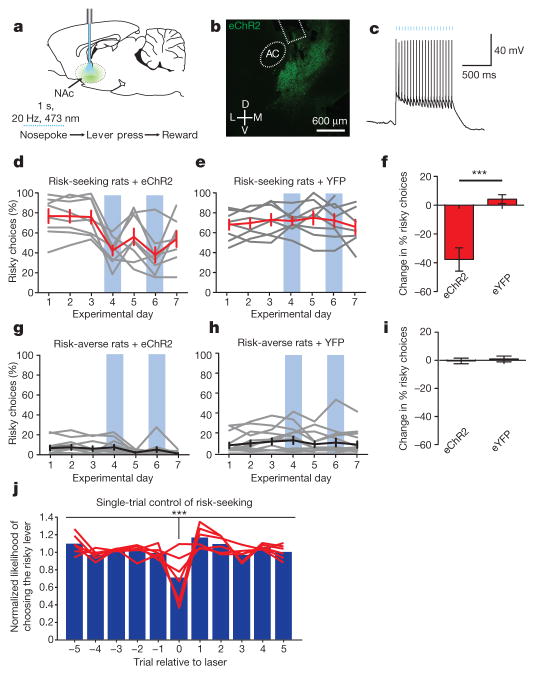
A marked bias towards risk aversion has been observed in nearly every species tested. A minority of individuals, however, instead seem to prefer risk (repeatedly choosing uncertain large rewards over certain but smaller rewards), and even risk-averse individuals sometimes opt for riskier alternatives. It is not known how neural activity underlies such important shifts in decision-making--either as a stable trait across individuals or at the level of variability within individuals. Here we describe a model of risk-preference in rats, in which stable individual differences, trial-by-trial choices, and responses to pharmacological agents all parallel human behaviour. By combining new genetic targeting strategies with optical recording of neural activity during behaviour in this model, we identify relevant temporally specific signals from a genetically and anatomically defined population of neurons. This activity occurred within dopamine receptor type-2 (D2R)-expressing cells in the nucleus accumbens (NAc), signalled unfavourable outcomes from the recent past at a time appropriate for influencing subsequent decisions, and also predicted subsequent choices made. Having uncovered this naturally occurring neural correlate of risk selection, we then mimicked the temporally specific signal with optogenetic control during decision-making and demonstrated its causal effect in driving risk-preference. Specifically, risk-preferring rats could be instantaneously converted to risk-averse rats with precisely timed phasic stimulation of NAc D2R cells. These findings suggest that individual differences in risk-preference, as well as real-time risky decision-making, can be largely explained by the encoding in D2R-expressing NAc cells of prior unfavourable outcomes during decision-making.


Conflict of interest statement

The authors declare no competing financial interests. Readers are welcome to comment on the online version of the paper

Figures

Extended Data Figure 1
Extended Data Figure 1. Task validation and behavioural controls
a, Scale diagram of the behavioural apparatus, showing the relative size and location of the nosepoke, levers, and sucrose port. b, Rats varied the proportion of choices they made to the risky lever as a function of the relative value of the safe and risky options. Subplots were constructed for each rat. The size of the safe reward is displayed as a proportion of the expected value of the risky reward. Red points indicate the proportion of risky choices each rat made to the risky lever given a particular value of the safe reward; blue lines indicate sigmoidal fits to those values. Dashed lines indicate each rat’s indifference point. Data in the centre panel are from a risk-seeking rat (indifference point >1); all other rats were risk-averse. Side bias, in these data, would appear as an upward or downward shift of the sigmoid, such that behaviour would asymptote without spanning the range of risky choices, and 50% would not centre the sigmoid on the ordinate. An additional cohort of rats was trained specifically for this control experiment. These rats do not appear elsewhere in the manuscript. c, Rats reversed their behaviour to track their preferred reward contingency (safe or risky). Each panel displays the behaviour of one rat across several hundred trials. The location of the risky lever is alternated in blocks of trials. Blocks where the right lever is risky are highlighted in yellow. Rats’ choices are smoothed with a 15-trial moving window. The rat in the bottom centre panel displayed risk-seeking behaviour; all others were risk-averse. An additional cohort of rats was trained specifically for this control experiment. These rats do not appear elsewhere in the manuscript.
Extended Data Figure 2
Extended Data Figure 2. Parameters for logistic regression classifier
a, Parameter values and goodness-of-fit for single-exponential fits of the form y=a(exb)+c to weights obtained in the logistic regression classifier (Methods) shown in Fig. 1. b, Parameter values and root mean squared error (RMSE) for fits of the form y = b to weights associated with choosing the safe option in the logistic regression classifier (Methods) shown in Fig. 1. c, Model coefficients associated with choosing the safe lever, as obtained from the entire population of rats. d, Model coefficients associated with choosing the safe lever, obtained for risk-seeking and risk-averse rats separately. e, Split-half reliability. Each dot represents a comparison between a rat’s average risk preference on odd days of behaviour and the rat’s average risk preference on even days of behaviour across seven days of testing. Perfect reliability would be represented by each animal’s data falling along the (grey, dashed) unity line. f, A 10,000-fold bootstrap over randomly assigned split halves of each rat’s behaviour generates an average reliability (intraclass correlation (ICC)) of 0.987. Reliability estimates were generated from control animal behavioural data represented in Fig. 4, as this cohort represents the longest test of unmanipulated behaviour in the manuscript.
Extended Data Figure 3
Extended Data Figure 3. Predictive validity of the logistic regression classifier
ac, The model was trained on two-thirds of data and tested on the one-third of data that was held-out. The blue histogram indicates the chance distribution, determined by the model’s performance over a 1,000-fold shuffle of the held-out test data. The dashed line indicates cross-validation accuracy (CV) on held-out data. This calculation was performed for data from all rats (a; P < 0.001 by Monte Carlo simulation; CV is 24.3 s.d. outside the chance distribution), a balanced subset of data from risk-averse rats, such that approximately 50% of choices were safe and 50% were risky (b; P < 0.001 by Monte Carlo simulation; CV is 20.6 s.d. outside the chance distribution), and a balanced subset of data from risk-seeking rats (c; P < 0.001 by Monte Carlo simulation; CV is 8.5 s.d. outside the chance distribution). df, Receiver operating characteristic (ROC) curves derived from model performance on held-out test data across all rats (d; area under the curve (AUC) = 0.85), a balanced subset of data from risk-averse rats (e; AUC = 0.76), and a balanced subset of data from risk-seeking rats (f; AUC =0.78). g, h, Histogram of run lengths for risk-averse rats (g) and risk-seeking rats (h). Blue bars indicate runs on the risky lever. Grey bars indicate runs on the safe lever. Insets show exceptionally long runs.
Extended Data Figure 4
Extended Data Figure 4. The D1 agonist A-77636 increased intertrial interval without influencing risk preference
Each rat in this experiment received alternating treatments of intraperitoneal A-77636 and intraperitoneal saline (see Fig. 2d). Each plot represents a different dose of A-77636. On each x axis is the intertrial interval on days receiving saline, and on the y axis is the intertrial interval on days receiving drug. Points above the unity line indicate an increase in intertrial interval with drug administration. a, Vehicle alone does not alter intertrial interval (paired t-test, t17 =1.088, P =0.29). b, A 50 μg kg−1 dose of A-77636 does not significantly alter intertrial interval (paired t-test, t14 =1.598, P =0.13). c, A 350 μg kg−1 dose of A-77636 significantly increases intertrial interval (paired t-test, t16 =4.391, P =0.0005). d, A 700 μg kg−1 dose of A-77636 significantly increases intertrial interval (paired t-test, t16 =2.738, P =0.015). e, A 1,000 μg kg−1 dose of A-77636 significantly increases intertrial interval (paired t-test, t13 =2.948, P =0.011).
Extended Data Figure 5
Extended Data Figure 5. The novel D2SP improves expression and specificity over previously published promoters
a, Expression of eYFP under the novel D2SP. Red shows D2R immunostaining (Methods). Scale bar, 100 μm. b, Expression of eYFP under a D2R promoter based on previously published constructs (D2RE), which included the first exon of the D2 receptor gene,. Image taken with settings matched to those used for the D2SP image in a. Scale bar, 100 μm. c, Images are of the same field of view as in b but taken with settings optimized to see the (otherwise dim) eYFP expression. Scale bar, 100 μm. d, Specificity of expression under the D2SP improved from 90.5% to 98.2% under the previously described promoter. Penetrance of expression under the DR2 promoter improved from 69% to 86.8% under the previously described promoter. e, Full sequence of D2SP.
Extended Data Figure 6
Extended Data Figure 6. Specificity of D2SP
a, Sagittal sections taken from brains injected with AAV8-hSYN-ChR2-eYFP (top) and AAV8-D2SP-eYFP (bottom). Arrowheads indicate projections expressing eYFP in the hSYN-injected brain that are not expressing eYFP in the D2SP-injected brain. b, Representative injection location, showing minimal overlap of D2SP-eChR2-eYFP with choline acetyltransferase (ChAT)+ cells. Green indicates D2SP-eChR2-eYFP, red indicates ChAT. c, Example of the three ChAT+ cells observed expressing eChR2-eYFP across 6 animals (top) and a ChAT+ cell that does not express eChR2-eYFP (bottom). d, Across NAc sections from the most densely expressing slices from 6 animals, 782 cells expressing eChR2-eYFP, 420 cells expressing ChAT, and 3 cells expressing both ChAT and ChR2-eYFP were observed. e, Within the area of viral infection, 782 cells expressing eChR2-eYFP, 93 cells expressing ChAT, and 3 cells expressing both ChAT and ChR2-eYFP were observed.
Extended Data Figure 7
Extended Data Figure 7. Characterization of dual-wavelength photometry and eChR2
a, Images of a GCaMP6m-expressing neuron illuminated at the imaging wavelength (475 nm) and the isosbestic wavelength (400 nm), at baseline (left) and with 10 s of 50 Hz electrical stimulation (right). b, Fluorescence intensity from a representative neuron, illuminated at 475 nm and 400 nm, during 10 s of 50 Hz electrical stimulation. c, Traces from a GCaMP6m-expressing rat (left) and a YFP-expressing rat (right) during the gambling task. Cyan traces are of the imaging wavelength; violet traces are of the isosbestic wavelength; black traces represent the cleaned signal (Methods). d, Expression of D2SP-ChR2-eYFP in rat NAc, showing evidence of opsin accumulations (bright green spots). e, Expression of D2SP-eChR2-eYFP in rat NAc; note greatly reduced accumulation density. f, D2SP-ChR2-eYFP-expressing cells have significantly more aggregates than D2SP-eChR2-eYFP-expressing cells. Quantification is in number of aggregates per expressing cell across ex vivo histological sections (t-test, t7 =21.25, ***P <0.0001; n =168 ChR2-expressing cells in 4 sections, n = 131 eChR2-expressing cells in 5 sections). g, Backbone diagram of pAAV-D2SP-eChR2(H134R)-eYFP showing the membrane trafficking modifications (trafficking signal (TS) and endoplasmic reticulum (ER) export motifs). h, Representative photocurrents evoked by ChR2 and eChR2 in cultured neurons by 1 s 473-nm light. i, Steady-state photocurrents measured from ChR2- and eChR2-expressing cultured neurons. In addition to showing reduced accumulations, photocurrents trended higher with eChR2. j, Peak photocurrents measured from ChR2- and eChR2-expressing cultured neurons; eChR2 trended towards higher peaks as well. k, Expression of eChR2-eYFP in a cultured rat striatal neuron. l, Whole-cell patch-clamp recording from the neuron shown in k. mp, Resting membrane potential, input resistance, membrane capacitance, and membrane resistance measured from ChR2- and eChR2-expressing cultured neurons; no significant differences were observed. All error bars represent s.e.m.
Extended Data Figure 8
Extended Data Figure 8. D2R+ (but not pan-neuronal) cellular signals are increased during the decision-period leading to risk rejection (safe choice) and encode prior loss
a–h, In all plots, black dashed boxes indicate decision-period activity, and blue dashed boxes indicate subsequent decision-period activity. Traces indicate mean neural activity sorted on trial outcome: safe (black), gain (green) or loss (red). Shaded regions indicate s.e.m. a, Average traces from the most risk-averse cell-specific D2SP-GCaMP6m-expressing rats (n = 3). Note increased neural activity during the decision period preceding a safe choice as compared to a risky (gain or loss) choice, as well as increased activity during the subsequent decision period (blue dashed box) following a loss outcome. b, Average traces from the most risk-averse non-cell-type-specific (hSYN-GCaMP6m-expressing) rats (n = 4). Note the increased activity in these cells during the decision period before making a risky (red/green) as compared to safe (black) choice (contrasting with the opposite D2R+-specific result in a). Also in contrast to the D2R+ case, the pan-neuronal signal did not discriminate immediately-preceding loss (red) from immediately-preceding gain (green) during the subsequent decision period. c, d, These pattern were also consistent in the most risk-seeking animals (D2SP-GCaMP6m-expressing rats, n =3; hSYN-GCaMP6m-expressing rats, n =4). eh, This pattern did not depend on the location of the implant relative to the safe lever. Shown are data from D2SP-GCaMP6m-expressing rats with implants ipsilateral to the location of the safe lever (n = 4); hSYN-GCaMP6m-expressing rats with implants ipsilateral to the location of the safe lever (n =4); D2SP-GCaMP6m-expressing rats with implants contralateral to the location of the safe lever (n = 2); hSYN-GCaMP6m-expressing rats with implants contralateral to the location of the safe lever (n = 4). Data for a, c, e and g are from the rats whose behaviour and neural data are represented in Fig. 3. Data for b, d, f and h are not represented in the main figures of the manuscript. Throughout the figure, traces were analysed as dF/F and z-score normalized before averaging. Scale bars indicate 1 s and 0.25 standard (z-score) units.
Extended Data Figure 9
Extended Data Figure 9. Pan-neuronal NAc recordings: increased activity associated with risky decisions
a, Median-normalized dF/F signal during the first second of the outcome period for each hSYN-GCaMP6m-expressing rat, comparing risky outcomes to safe outcomes (n = 8; Wilcoxon matched-pairs test, W =36, P =0.008). b, Lack of correlation between the proportion of choices made by each rat to the risky lever and the individual’s risky versus safe outcome signal ((dF/F) during the first 1 s of risky outcome/(dF/F) during safe outcome) (n =8 rats, Pearson’s r2 =0.12, P =0.40). c, Median-normalized dF/F signal during the first second of the outcome period for each D2SP-GCaMP6m-expressing rat, comparing safe outcomes to risky outcomes (n =6; Wilcoxon matched-pairs test, W =17, P =0.04). d, Lack of correlation between the proportion of choices made by each rat to the risky lever and the individual’s risky versus safe outcome signal ((dF/F) during the first 1 s of safe outcome/(dF/F) during risky outcome) (n =6; Pearson’s r2 =0.11, P =0.51). e, Median-normalized dF/F signal at the time of trial initiation for each hSYN-GCaMP6m-expressing rat, sorted on previous trial outcome, comparing risky outcomes to safe outcomes (n =8; paired t-test, t7 =7.25, P =0.0002). f, Lack of correlation between the proportion of choices made by each rat to the risky lever and the individual’s risk signal ((dF/F) at nosepoke trial initiation after risky outcome/(dF/F) after safe outcome) (n =8; Pearson’s r2 =0.01, P =0.78). g, Median-normalized dF/F signal at the time of trial initiation for each D2SP-GCaMP6m-expressing rat, sorted on previous trial outcome, comparing risky outcomes to safe outcomes (n =6; paired t-test, t5 =6.901, P =0.001). h, Correlation between the proportion of choices made by each D2SP-GCaMP6m-expressing rat to the risky lever and the individual’s risk signal ((dF/F) at nosepoke trial initiation after risky outcome/(dF/F) after safe outcome) (n =6; Pearson’s r2 =0.97, P =0.0003). i, Median-normalized dF/F signal at the time of trial initiation for each hSYN-GCaMP6m-expressing rat, sorted on upcoming choice, comparing risky choices to safe choices (n =8; paired t-test, t7 =2.11, P =0.036). j, Lack of correlation between the proportion of choices made by each rat to the risky lever and the individual’s decision period signal ((dF/F) at nosepoke trial initiation before a risky choice/(dF/F) before a safe choice) (n =8; Pearson’s r2 =0.17, P =0.31). k, Median-normalized dF/F signal at the time of trial initiation for each D2SP-GCaMP6m-expressing rat, sorted on upcoming choice, comparing risky choices to safe choices (n =8; paired t-test, t7 =2.11, P =0.036). l, Lack of correlation between the proportion of choices made by each rat to the risky lever and the individual’s safe choice signal ((dF/F) at nosepoke trial initiation before choosing safe/(dF/F) at nosepoke before choosing risky) (n =6; Pearson’s r2 =0.12, P =0.48). Data from k and l also appear in Fig. 3i, o and are reproduced here for ease of comparison. All error bars represent s.e.m.
Extended Data Figure 10
Extended Data Figure 10. D2SP-eChR2 stimulation during the outcome period produced a small but still detectable effect on risk preference
a, Stimulation was as in Fig. 4, except delivered during the first second of reward retrieval rather than during the 1-s decision period. b, The effect of this stimulation during the outcome period was smaller than that of stimulation during the decision period (two-way ANOVA, interaction F1,24 =6.12; *P = 0.02; Bonferroni post-hoc tests revealed a significant effect of stimulation during the decision period, P <0.001, but no effect of stimulation during the outcome period). c–h, As in Fig. 4, 1 s of 20-Hz optical stimulation of NAc DR2+ cells during the outcome period decreased risky choices in risk-seeking, but not risk-averse rats relative to YFP-expressing controls (two-way ANOVA, interaction F1,31 =4.317, P = 0.046; Bonferroni post-hoc test revealed a significant difference between eChR2-expressing and YFP-expressing risk-seeking rats, but no difference between experimental and control risk-averse rats; *P <0.05). Grey traces represent individual animals. Black and red traces represent the population average. Error bars represent s.e.m. Blue boxes indicate days on which optical stimulation was delivered during the outcome.
Figure 1
Figure 1. Trait variability in risk-aversion as loss-sensitivity: rat behavioural model
a, Rats initiated each trial with a 1-s nosepoke, then chose either the ‘safe’ constant-reward lever or the ‘risky’ variable-reward lever. The safe lever delivered a 50-μl reward. The risky lever delivered a 10-μl reward with 75% probability and a 170-μl reward with 25% probability. The expected value of each choice was 50 μl. Rats retrieve the reward before initiating the next trial. b, Model coefficients revealed rats were more likely to choose the risky lever after a gain but less likely to choose the risky lever after a loss. Larger weights indicate a larger contribution of that outcome on choice. Coefficients were fit by exponential functions (Extended Data Fig. 2). Offset slightly above zero relates to the long tail of run lengths (Extended Data Fig. 3). c, Logistic regression trained on two-thirds of choices predicted choices in held-out test data with 80.2% accuracy (training data: n = 17 rats, 6,593 trials; test data: n = 17 rats, 3,267 trials; P < 0.001 by Monte Carlo simulation). Shown are 400 trials of test data from one rat. Actual choices are smoothed with an 8-trial boxcar filter; prediction is unsmoothed. d, Histogram of risk preference. Black indicates risk-averse (<50% risky choices); red indicates risk-seeking (>50% risky choices) rats. e, Weights for risk-seeking and risk-averse rats showed a difference in response to loss. f, Both risk-seeking (n = 10, Wilcoxon matched-pairs test, W = −41, P =0.03) and risk-averse (n = 7, Wilcoxon matched-pairs test, W = −28, P =0.01) rats were more likely to choose risk after a gain than after a loss. This effect was larger in risk-averse rats (n = 17, two-way analysis of variance (ANOVA), interaction F2,20 =6.454, P <0.01). g, Risk-averse rats were more loss-sensitive than risk-seeking rats (n = 10 risk-seeking, 7 risk-averse rats, Mann–Whitney U =2.00, P = 0.0004). Data shown are mean and s.e.m.
Figure 2
Figure 2. D2R agonist in the NAc increases risk-seeking behaviour in rats
a, Points represent a rat’s mean risky choices across 3 days of drug administration. Systemic PPX administration dose-dependently increased risky choices (Pearson’s r2 =0.49, P < 0.0001; in order of increasing dose, n = 5, 4, 7, 7 and 5 rats); doses ≥0.225 mg kg−1 significantly increased risk-seeking (one-way ANOVA, F4,25 =6.115, P =0.002; Bonferroni’s multiple comparison post-hoc test, **P <0.01 for both 0.225 mg kg−1 and 0.3 mg kg−1; n = 4–7 animals per dose, as above). b, This effect was reversible across days (n = 4–7 animals per dose, as above). c, In rats in which PPX significantly increased risk-seeking, it also decreased loss-sensitivity (t-test, t10 =3.89, **P =0.003). d, The D1 agonist A-77636 did not alter risk-preference (one-way ANOVA, F4,27 =2.63, P >0.05; Bonferroni’s multiple comparison post-hoc test reveals no significant effect at any dose tested. In order of increasing dose, n = 5, 6, 6, 6 and 5 rats). e, f, Bilateral administration of PPX into the NAc increased risk-preference (n = 6 rats; repeated-measures ANOVA, F4,20 =4.455, P < 0.01). Injection sites are indicated on coronal diagrams as blue circles. g, h, Bilateral administration of PPX into the OFC had no effect on risk-seeking (n = 5 rats; repeated-measures ANOVA, F4,16 =1.307, P = 0.31). The effect of PPX administration into the NAc was significantly larger than the effect of administration into the OFC (two-way repeated measures ANOVA; interaction F4,36 =2.989, P = 0.03; Bonferroni post-hoc test; P < 0.05 on each drug administration day). Data are mean and s.e.m.
Figure 3
Figure 3. Activity in D2R-expressing cells in the NAc encodes loss-relevant task variables and predicts upcoming choice
a, Adeno-associated viral (AAV) vector AAV8-D2SP-eYFP exhibits 98.2% specificity and 86.8% penetrance (n = 2 rats, 214 of 218 cells that expressed YFP co-labelled for D2R). b, Photometry recordings were taken from NAc cells expressing AAV8-D2SP-GCaMP6m. c, Dual-excitation-wavelength fibre photometry rig (Methods). d, 50 traces of each trial type after isosbestic normalization in GCaMP6m- and YFP-expressing rats. e, Representative mean outcome-period traces. Blue dashed line indicates sucrose port entry. Later dashed boxes indicate median time of next decision period following: loss (red), gain (green), or safe (black) outcomes (1 rat, 911 trials, shaded area indicates s.e.m.). f, Mean decision-period signal sorted on previous outcome (6 rats, 5,693 trials). g, Decision-period signal is larger after losses than other outcomes (n = 6 rats; paired t-test, t5 =2.371, *P =0.032). h, Mean decision-period signal sorted on upcoming choice (6 rats, 5,693 trials). i, Decision-period signal was larger preceding safe versus risky choices (n = 6 rats; paired t-test, t5 =2.374, *P =0.038). j, Mean decision-period signal sorted on previous outcome, during forced-choice trials (6 rats, 1,550 trials). k, Decision-period signal was larger after losses during forced-choice trials (n = 6 rats; paired t-test, t5 =2.126, *P =0.043). l, Mean forced-choice decision-period signal, sorted by outcome (6 rats, 1,550 trials). m, Forced-choice decision-period signal did not distinguish upcoming action, as expected (n = 6 rats; paired t-test, t5 =1.026, P =0.18). f, h, j, l, Data are mean and s.e.m. Traces were z-score normalized before averaging. Scale bars indicate 0.5 s and 0.25 standard (z-score) units. n, Loss-sensitivity signal ((dF/F) at nosepoke (nsp) after loss/(dF/F) at other nosepokes) significantly predicts risk-preference (n = 6 rats; Pearson’s r2 =0.86, P =0.007). o, Safe choice signal ((dF/F) at nosepoke before safe choice/(dF/F) at nosepoke before risky choice) did not significantly predict risk-preference (n = 6 rats; Pearson’s r2 =0.12, P =0.48). p, Loss-sensitivity signal during forced-choice significantly predicted risk-preference (n = 6 rats; Pearson’s r2 =0.74, P =0.02). q, As expected, the safe choice signal during forced choices did not predict risk-preference (n = 6 rats; Pearson’s r2 =0.44, P =0.15). n, o, p, q, Points indicate the mean risk-preference, mean loss-sensitivity signal, and s.e.m. across days.
Figure 4
Figure 4. Providing phasic activity in D2-expressing NAc cells during the decision period decreased risky choices in risk-seeking rats
a, NAc cell bodies expressing AAV8-D2SP-eChR2(H134R)-eYFP were stimulated bilaterally during the decision period. b, AAV8-D2SP-eChR2(H134R)-eYFP expression in NAc. AC, anterior commissure. Rectangle indicates fibre location. c, NAc cells expressing D2SP-eChR2-eYFP track 1-s 20-Hz optical stimulation (indicated by blue bars) in acute slices (representative trace; similar behaviour seen in 5 out of 5 cells). di, NAc D2R+ cell decision-period stimulation decreased risky choices in risk-seeking rats, but not risk-averse rats relative to YFP-expressing controls (n =8 risk-seeking plus eChR2, 8 risk-seeking plus eYFP, 20 risk-averse plus eChR2, 26 risk-averse plus eYFP; two-way ANOVA, interaction F1,58 =25.37, P < 0.0001; Bonferroni post-hoc test revealed a significant difference between ChR2-expressing and YFP-expressing risk-seeking rats, but no difference between experimental and control risk-averse rats; ***P < 0.001). Grey traces represent individual animals. Black and red traces represent the population mean. Error bars represent s.e.m. Blue boxes indicate days with decision-period stimulation. j, Stimulation significantly decreased risk-seeking choices on a single-trial basis in risk-seeking rats (n = 6 rats; repeated-measures ANOVA, F5,10 =5.504, ***P = 0.0006; Dunnet’s post-hoc test revealed the probability of choosing risky on stimulation trials was significantly lower than each other trial independently, correcting for multiple comparisons; P < 0.01 in every case). Blue bars represent the mean likelihood of risky choice across rats; red lines represent the behaviour of individual rats.

Comment in

  • Neuroscience: Making risk-takers settle.
    Hollon NG, Phillips PE. Hollon NG, et al. Nature. 2016 Mar 31;531(7596):588-9. doi: 10.1038/nature17314. Epub 2016 Mar 23. Nature. 2016. PMID: 27007851 No abstract available.

References

    1. Barkan CPL. A Field test of risk-sensitive foraging in black-capped chickadees (Parus Atricapillus) Ecology. 1990;71:391–400.
    1. Kahneman D, Tversky A. Prospect theory: an analysis of decision under risk. Econometrica. 1979;47:263–291.
    1. Caraco T, Martindale S, Whittam TS. An empirical demonstration of risk-sensitive foraging preferences. Anim Behav. 1980;28:820–830.
    1. Real LA. Uncertainty and pollinator–plant interactions: the foraging behavior of bees and wasps on artificial flowers. Ecology. 1981;62:20–26.
    1. Markowitz H. Portfolio Selection. J Finance. 1952;7:77–91.

Publication types

Substances