

Prioritising Mangrove Ecosystem Services Results in Spatially Variable Management Priorities
- PMID: 27008421
- PMCID: PMC4805192
- DOI: 10.1371/journal.pone.0151992
Prioritising Mangrove Ecosystem Services Results in Spatially Variable Management Priorities
Abstract
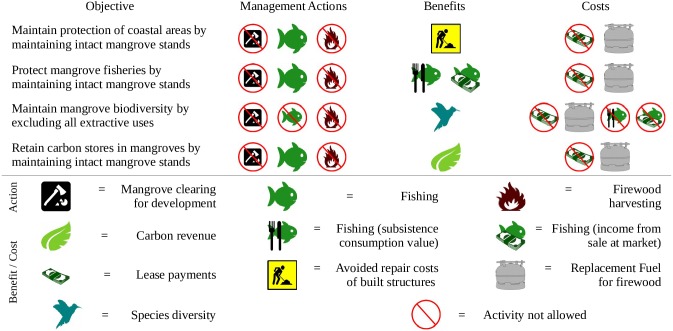
Incorporating the values of the services that ecosystems provide into decision making is becoming increasingly common in nature conservation and resource management policies, both locally and globally. Yet with limited funds for conservation of threatened species and ecosystems there is a desire to identify priority areas where investment efficiently conserves multiple ecosystem services. We mapped four mangrove ecosystems services (coastal protection, fisheries, biodiversity, and carbon storage) across Fiji. Using a cost-effectiveness analysis, we prioritised mangrove areas for each service, where the effectiveness was a function of the benefits provided to the local communities, and the costs were associated with restricting specific uses of mangroves. We demonstrate that, although priority mangrove areas (top 20%) for each service can be managed at relatively low opportunity costs (ranging from 4.5 to 11.3% of overall opportunity costs), prioritising for a single service yields relatively low co-benefits due to limited geographical overlap with priority areas for other services. None-the-less, prioritisation of mangrove areas provides greater overlap of benefits than if sites were selected randomly for most ecosystem services. We discuss deficiencies in the mapping of ecosystems services in data poor regions and how this may impact upon the equity of managing mangroves for particular services across the urban-rural divide in developing countries. Finally we discuss how our maps may aid decision-makers to direct funding for mangrove management from various sources to localities that best meet funding objectives, as well as how this knowledge can aid in creating a national mangrove zoning scheme.
Conflict of interest statement
Figures


References
-
- Barbier E, Hacker S, Kennedy C, Koch E, Stier A, Silliman B. The value of estuarine and coastal ecosystem services. Ecol Monogr. 2011;81: 169–193.
-
- McIvor A, Möller I, Spencer T, Spalding M. Reduction of wind and swell waves by mangroves Natural coastal protection series: report 1. Cambridge coastal research unit working paper 40. Natural coastal protection series. The Nature Conservancy and Wetlands International; 2012.
-
- Donato DC, Kauffman JB, Murdiyarso D, Kurnianto S, Stidham M, Kanninen M. Mangroves among the most carbon-rich forests in the tropics. Nat Geosci. 2011;4: 293–297.
-
- Naylor R, Drew M. Valuing mangrove resources in Kosrae, Micronesia. Environ Dev Econ. 1998;3: S1355770X98000242.
Publication types
MeSH terms
LinkOut - more resources
Full Text Sources
Other Literature Sources
Molecular Biology Databases
