Meta-Analysis
. 2016 Mar 23;11(3):e0150970.
doi: 10.1371/journal.pone.0150970. eCollection 2016.

A Meta-Analysis of the Metabolic Syndrome Prevalence in the Global HIV-Infected Population

Affiliations
Meta-Analysis

A Meta-Analysis of the Metabolic Syndrome Prevalence in the Global HIV-Infected Population

Kim A Nguyen et al. PLoS One. .

Abstract

Background: Cardio-metabolic risk factors are of increasing concern in HIV-infected individuals, particularly with the advent of antiretroviral therapy (ART) and the subsequent rise in longevity. However, the prevalence of cardio-metabolic abnormalities in this population and the differential contribution, if any, of HIV specific factors to their distribution, are poorly understood. Therefore, we conducted a systematic review and meta-analysis to estimate the global prevalence of metabolic syndrome (MS) in HIV-infected populations, its variation by the different diagnostic criteria, severity of HIV infection, ART used and other major predictive characteristics.

Methods: We performed a comprehensive search on major databases for original research articles published between 1998 and 2015. The pooled overall prevalence as well as by specific groups and subgroups were computed using random effects models.

Results: A total of 65 studies across five continents comprising 55094 HIV-infected participants aged 17-73 years (median age 41 years) were included in the final meta-analysis. The overall prevalence of MS according to the following criteria were: ATPIII-2001:16.7% (95%CI: 14.6-18.8), IDF-2005: 18% (95%CI: 14.0-22.4), ATPIII-2004-2005: 24.6% (95%CI: 20.6-28.8), Modified ATPIII-2005: 27.9% (95%CI: 6.7-56.5), JIS-2009: 29.6% (95%CI: 22.9-36.8), and EGIR: 31.3% (95%CI: 26.8-36.0). By some MS criteria, the prevalence was significantly higher in women than in men (IDF-2005: 23.2% vs. 13.4, p = 0.030), in ART compared to non-ART users (ATPIII-2001: 18.4% vs. 11.8%, p = 0.001), and varied significantly by participant age, duration of HIV diagnosis, severity of infection, non-nucleoside reverse transcriptase inhibitors (NNRTIs) use and date of study publication. Across criteria, there were significant differences in MS prevalence by sub-groups such as in men, the Americas, older publications, regional studies, younger adults, smokers, ART-naïve participants, NNRTIs users, participants with shorter duration of diagnosed infection and across the spectrum of HIV severity. Substantial heterogeneities across and within criteria were not fully explained by major study characteristics, while evidence of publication bias was marginal.

Conclusions: The similar range of MS prevalence in the HIV-infected and general populations highlights the common drivers of this condition. Thus, cardio-metabolic assessments need to be routinely included in the holistic management of the HIV-infected individual. Management strategies recommended for MS in the general population will likely provide similar benefits in the HIV-infected.


Conflict of interest statement

Competing Interests: Edward J. Mills is employed by Global Evaluation Science. There are no patents, products in development or marketed products to declare. This does not alter the authors' adherence to all the PLOS ONE policies on sharing data and materials, as detailed online in the guide for authors.

Figures

Fig 1
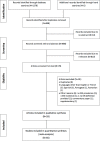
Fig 1. Flow diagram for the selection of studies.
Fig 2
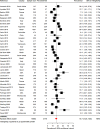
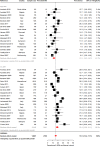
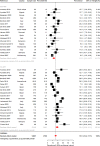
Fig 2. Overall metabolic syndrome prevalence in the HIV-infected: Adult Treatment Panel III (ATPIII) 2001 criteria.
For each study the black box represents the study estimate (prevalence of metabolic syndrome [MS]) and the horizontal bar about the 95% confidence intervals (95%CI). The size of the boxes is proportional to the inverse variance. The diamond at the lower tail of the figure is for the pooled effect estimates from random effects models. The proportional contribution of each study (weight) to the pooled estimates is also shown, together with the prevalence estimates and measures of heterogeneity. The dotted vertical line is centred on the pooled estimates.
Fig 3
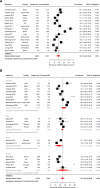
Fig 3. Overall metabolic syndrome prevalence in the HIV-infected.
Figure panels are for the prevalence of metabolic syndrome according to the International Diabetes Federation 2005 criteria (panel a), and according to the Adult Treatment Panel III 2005 criteria overall and by continent (panel b). For each study the black box represents the study estimate (prevalence of metabolic syndrome [MS]) and the horizontal bar about the 95% confidence intervals (95%CI). The size of the boxes is proportional to the inverse variance. The diamond at the lower tail of the figure is for the pooled effect estimates from random effects models. The proportional contribution of each study (weight) to the pooled estimates is also shown, together with the prevalence estimates and measures of heterogeneity. The dotted vertical line is centred on the pooled estimates.
Fig 4
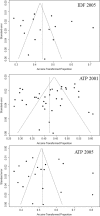
Fig 4. Funnel plots for included studies across different diagnostic criteria for metabolic syndrome.
For each diagnostic criteria, the arcsine transformed proportion of participants with metabolic syndrome (relative to the total sample) for each relevant study (horizontal axis) is plotted against its standard error (vertical axis), and represented by the dots. When the dots distribute symmetrically in a funnel shape, this implies an absence of bias. A p-value <0.05 (Egger test) indicates significant publication bias.
Fig 5
Fig 5. Pooled metabolic syndrome prevalence in the HIV-infected presented by gender: International Diabetes Federation 2005 criteria.
For each study the black box represents the study estimate (prevalence of metabolic syndrome [MS]) and the horizontal bar about the 95% confidence intervals (95%CI). The size of the boxes is proportional to the inverse variance. The diamond at the lower tail of the figure is for the pooled effect estimates from random effects models. The proportional contribution of each study (weight) to the pooled estimates is also shown, together with the prevalence estimates and measures of heterogeneity. The dotted vertical line is centred on the pooled estimates. Furthermore, pooled effect estimates are provided separately by gender. The horizontal arrow head indicates that the representation of the effect estimates and 95% confidence intervals has been truncated.
Fig 6
Fig 6. Pooled metabolic syndrome prevalence in the HIV-infected presented by antiretroviral therapy (ART) use: Adult Treatment Panel 2001 criteria.
For each study the black box represents the study estimate (prevalence of metabolic syndrome [MS]) and the horizontal bar about the 95% confidence intervals (95%CI). The size of the boxes is proportional to the inverse variance. The diamond at the lower tail of the figure is for the pooled effect estimates from random effects models. The proportional contribution of each study (weight) to the pooled estimates is also shown, together with the prevalence estimates and measures of heterogeneity. The dotted vertical line is centred on the pooled estimates. Furthermore, pooled effect estimates are provided separately by ART use. The horizontal arrow head indicates that the representation of the effect estimates and 95% confidence intervals has been truncated.

Similar articles

Cited by

References

    1. Murray CJ, Ortblad KF, Guinovart C, Lim SS, Wolock TM, Roberts DA, et al. Global, regional, and national incidence and mortality for HIV, tuberculosis, and malaria during 1990–2013: a systematic analysis for the Global Burden of Disease Study 2013. Lancet. 2014;384: 1005–1070. 10.1016/S0140-6736(14)60844-8 - DOI - PMC - PubMed
    1. Jaggers JR, Prasad VK, Dudgeon WD, Blair SN, Sui X, Burgess S, et al. (2014) Associations between physical activity and sedentary time on components of metabolic syndrome among adults with HIV. pp. 1387–1392. 10.1080/09540121.2014.920075 - DOI - PMC - PubMed
    1. De Wit S, Sabin CA, Weber R, Worm SW, Reiss P, Cazanave C, et al. Incidence and risk factors for new-onset diabetes in HIV-infected patients: the Data Collection on Adverse Events of Anti-HIV Drugs (D:A:D) study. Diabetes Care. 2008;31: 1224–1229. 10.2337/dc07-2013 - DOI - PMC - PubMed
    1. Syed FF, Sani MU. Recent advances in HIV-associated cardiovascular diseases in Africa. Heart. 2013;99: 1146–1153. 10.1136/heartjnl-2012-303177 - DOI - PubMed
    1. Gami AS, Witt BJ, Howard DE, Erwin PJ, Gami LA, Somers VK, et al. Metabolic syndrome and risk of incident cardiovascular events and death: a systematic review and meta-analysis of longitudinal studies. Journal of the American College of Cardiology. 2007;49: 403–414. - PubMed

Publication types