

doi: 10.1186/s13059-016-0917-0.
The real cost of sequencing: scaling computation to keep pace with data generation
Affiliations
- PMID: 27009100
- PMCID: PMC4806511
- DOI: 10.1186/s13059-016-0917-0
Item in Clipboard
The real cost of sequencing: scaling computation to keep pace with data generation
Genome Biol.
.
Erratum in
-
Erratum to: The real cost of sequencing: scaling computation to keep pace with data generation.Genome Biol. 2016 Apr 28;17:78. doi: 10.1186/s13059-016-0961-9. Genome Biol. 2016. PMID: 27125642 Free PMC article. No abstract available.
Abstract
As the cost of sequencing continues to decrease and the amount of sequence data generated grows, new paradigms for data storage and analysis are increasingly important. The relative scaling behavior of these evolving technologies will impact genomics research moving forward.
Figures
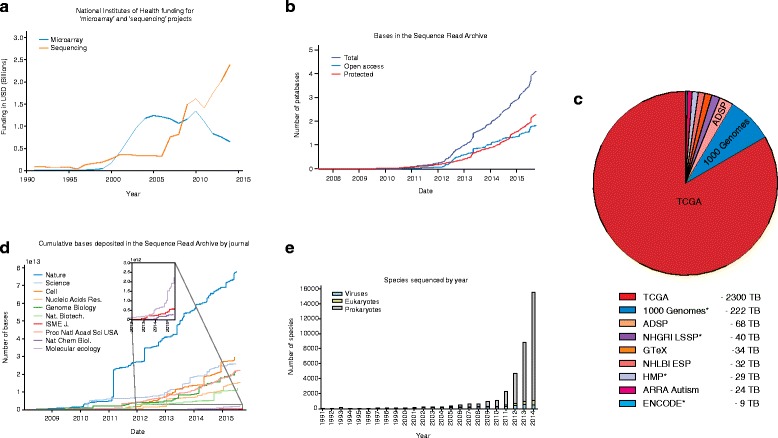
The dramatic increase in the rate and amount of sequencing. a Next generation sequencing (NGS) reads have become the dominant form of sequence data. This is illustrated in a graph of National Institutes of Health (NIH) funding related to the keywords “microarray” and “genome sequencing”, which shows increasing funding for NGS and decreases in the funding of earlier technologies such as microarrays. b The size and growth rate of the Sequence Read Archive (SRA) highlight the importance of efficiently storing sequence data so that they can be accessed by the broader scientific community. The SRA’s centrality in the storage of DNA sequences from next-generation platforms means that it also serves as a valuable indicator of the scientific uses of sequencing. Furthermore, the rise in protected sequence data highlights the challenges facing genomics as ever-greater amounts of personally identifiable sequence data are being generated. c It is interesting to look at the contribution of large sequence depositions compared to smaller submissions. This provides an indication of the size distribution of sequencing projects. At one end of this size spectrum are large datasets generated by the collaborative effort of many labs. These include projects that have taken advantage of sequencing trends to generate population-scale genomic data (1000 Genomes) or extensive characterization of cancer genomes by The Cancer Genome Atlas (TCGA). On top of generating a vast amount of sequencing data with the aim of better understanding human variation and disease, high-throughput sequencing has dramatically expanded the number of species whose genomes are documented. The number of newly sequenced genomes has exhibited an exponential increase in recent years. Entries with asterisks indicate projects that produce open access data. ADSP, Alzheimer’s Disease Sequencing Project; HMP, Human Microbiome Project. d A more detailed analysis of the SRA illustrates the pace at which different disciplines adopted sequencing. Plots depicting the cumulative number of bases deposited in the SRA and linked to papers appearing in different journals provide a proxy for sequencing adoption. More general journals such as Nature and Science show early adoption. Meanwhile, SRA data deposited by articles from more specific journals such as Nature Chemical Biology and Molecular Ecology remained low for a relatively long period before increasing. These trends highlight the spread of sequencing to new disciplines. e Sequence data have also been distributed over the tree of life. In terms of size, the vast majority of sequence data generated have been for eukaryotes. This is due in part to the larger genome size of eukaryotes and to efforts to sequence multiple individuals within a given species, especially humans. In terms of the number of species sequenced, prokaryotes are by far the best represented. Moving forward, the continuing decrease in the cost of sequencing will enable further exploration of genetic diversity both within and across species. Data were obtained from GenBank
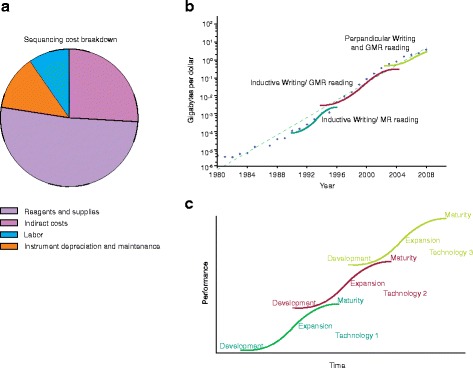
a The cost breakdown of next generation sequencing projects. The total cost of these projects is split into the cost of labor, reagents and supplies, instrument depreciation and maintenance, and indirect fees. b The exponential increase in the number of gigabytes per dollar in hard drive storage technology is due in part to the sequential introduction and improvement of three technologies. Data were obtained from http://www.mkomo.com/cost-per-gigabyte . c Exponential scaling in technological cost improvement is often the superposition of multiple S-curve trajectories of individual technologies. At the beginning of a technology’s life cycle, development costs keep cost reductions low. As the technology matures improvements in production are able to drive down per unit costs and establish an exponential regime. Eventually, the technology reaches maturity where technological limits are encountered and the cost improvements again slow down. GMR reading, Giant Magnetoresitive reading; MR reading, Magnetoresitive reading
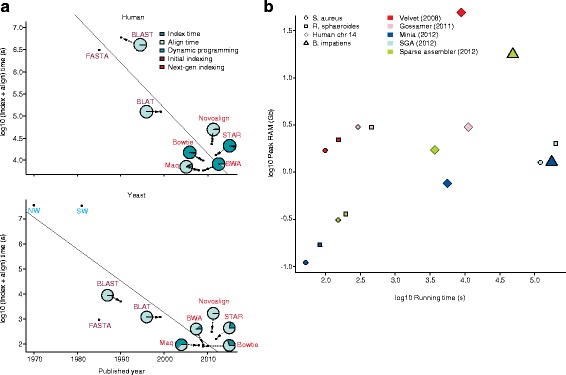
a Multiple advances in alignment algorithms have contributed to an exponential decrease in running time over the past 40 years. We synthesized one million single-ended reads of 75 bp for both human and yeast. The comparison only considers the data structure, algorithms, and speeds. There are many other factors, such as accuracy and sensitivity, which are not discussed here, but which are covered elsewhere [25]. Initial alignment algorithms based on dynamic programming were applicable to the alignment of individual protein sequences, but they were too slow for efficient alignment at a genome scale. Advances in indexing helped to reduce running time. Additional improvements in index and scoring structures enabled next generation aligners to further improve alignment time. A negative correlation is also observed between the initial construction of an index and the marginal mapping time per read. b Peak memory usage plotted against the running time for different genome assemblers on a log-log plot. Assembler performance was tested using multiple genomes, including Staphylococcus aureus, Rhodobacter sphaeroides, human chromosome 14, and Bombus impatiens. Data were obtained from Kleftogiannis et al. [33]
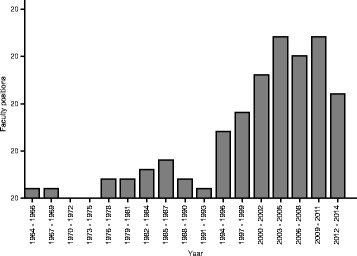
The number of faculty position hires at 51 US universities in 3-year bins. The recent increase in hiring coincides with the explosion in sequencing data. Data were obtained from http://jeffhuang.com/computer_science_professors.html
References
-
- Stevens H. Life out of sequence : a data-driven history of bioinformatics. Chicago: The University of Chicago Press; 2013.
Publication types
MeSH terms
Grants and funding
LinkOut - more resources
Full Text Sources
Other Literature Sources
Research Materials
