. 2016 Jun 1;76(11):3136-44.
doi: 10.1158/0008-5472.CAN-15-2962. Epub 2016 Mar 23.

Darwinian Dynamics of Intratumoral Heterogeneity: Not Solely Random Mutations but Also Variable Environmental Selection Forces

Affiliations

Darwinian Dynamics of Intratumoral Heterogeneity: Not Solely Random Mutations but Also Variable Environmental Selection Forces

Mark C Lloyd et al. Cancer Res. .

Abstract

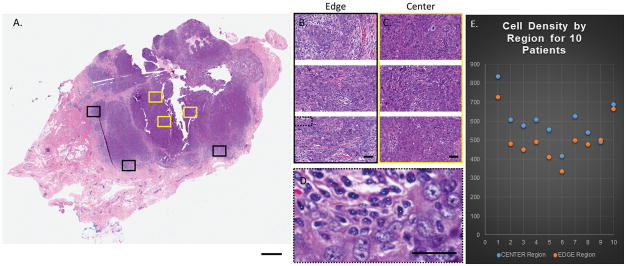
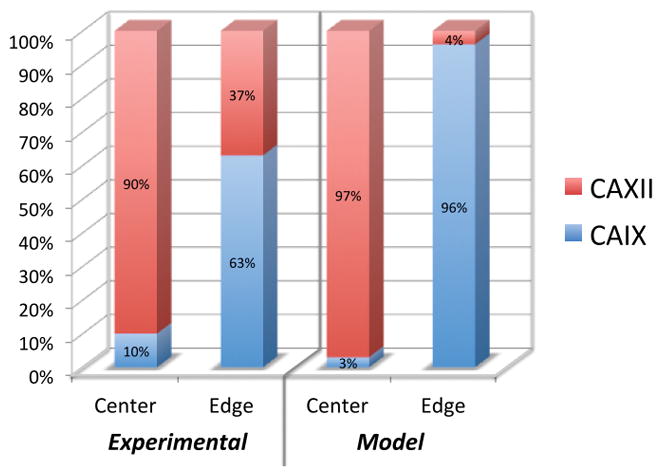
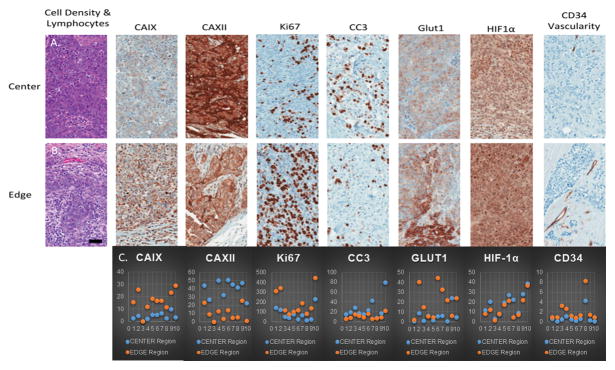
Spatial heterogeneity in tumors is generally thought to result from branching clonal evolution driven by random mutations that accumulate during tumor development. However, this concept rests on the implicit assumption that cancer cells never evolve to a fitness maximum because they can always acquire mutations that increase proliferative capacity. In this study, we investigated the validity of this assumption. Using evolutionary game theory, we demonstrate that local cancer cell populations will rapidly converge to the fittest phenotype given a stable environment. In such settings, cellular spatial heterogeneity in a tumor will be largely governed by regional variations in environmental conditions, for example, alterations in blood flow. Model simulations specifically predict a common spatial pattern in which cancer cells at the tumor-host interface exhibit invasion-promoting, rapidly proliferating phenotypic properties, whereas cells in the tumor core maximize their population density by promoting supportive tissue infrastructures, for example, to promote angiogenesis. We tested model predictions through detailed quantitative image analysis of phenotypic spatial distribution in histologic sections of 10 patients with stage 2 invasive breast cancers. CAIX, GLUT1, and Ki67 were upregulated in the tumor edge, consistent with an acid-producing invasive, proliferative phenotype. Cells in the tumor core were 20% denser than the edge, exhibiting upregulation of CAXII, HIF-1α, and cleaved caspase-3, consistent with a more static and less proliferative phenotype. Similarly, vascularity was consistently lower in the tumor center compared with the tumor edges. Lymphocytic immune responses to tumor antigens also trended to higher level in the tumor edge, although this effect did not reach statistical significance. Like invasive species in nature, cancer cells at the leading edge of the tumor possess a different phenotype from cells in the tumor core. Our results suggest that at least some of the molecular heterogeneity in cancer cells in tumors is governed by predictable regional variations in environmental selection forces, arguing against the assumption that cancer cells can evolve toward a local fitness maximum by random accumulation of mutations. Cancer Res; 76(11); 3136-44. ©2016 AACR.


Conflict of interest statement

Conflict of Interest: The authors declare no conflict of interest

Figures

Figure 1
Figure 1
Evolution of a population of cells in an environment where the migration rate is high (m = 0.1). The initial population begins with a strategy u=0.5 (left panel). Evolutionary dynamics will cause this population’s strategy to climb the adaptive landscape. Through both the ecological and evolutionary dynamics an ESS is achieved at a strategy of u=0.3564 (right panel).
Figure 2
Figure 2
Evolution of a population of cells in an environment where the migration rate is low (m=0.001). Again, the initial population begins with a strategy of u=0.5 and begins to climb the adaptive landscape (upper left). Instead of achieving a peak, the population actually evolves to an evolutionarily stable minima of the landscape at u=0.3677 (upper right). Disruptive selection causes the single population to diverge into two separate species. The one being K-selected is shown as species 1 in red and evolves to an ESS of u=0.0774. The other being r-selected is shown as species 2 in blue and evolved to an ESS of u=0.4074 (bottom panels).
Figure 3
Figure 3
Evolutionary stable strategies vs. the migration rate m. Speciation into two distinct strategies occurs at low migration rates (m < 0.012). At high migration rates (m> 0.012) the values of the two strategies converge to a single species with a generalist strategy. The dynamics of m = 0.1 are shown in Figure 1 and the dynamics of m = 0.001 are shown in Figure 2.
Figure 4
Figure 4
H&E images of a Grade III invasive breast cancer. A) Regions were randomly selected from the whole slide image such that three regions were within 1mm of the edge of the tumor border (black boxes) and three regions were located near the center of the tumor region (yellow boxes). Scale=2mm. B) Each edge region and C) each center region are shown at 200x magnification. Scale =100μm. D) is a digitally zoomed to 1000x from the dotted black box and demonstrates the tumor cell identification (blue points) and lymphocyte identification (teal points) used to calculate both the tumor cell density and lymphocyte numbers in each of the 60 H&E and 600 total images evaluated. Scale =100μm. E) Scatter plot of the 10 patient’s (x-axis) cell density (y-axis) for the center (blue) and edge (orange) regions.
Figure 5
Figure 5
Experimental and mathematical model results showing the percentage of total cells counted in the center and edge that expressed either CAIX or CAXII. Experimental results showed that 90% of the cells in the center of the tumors expressed CAXII while only 10% expressed CAIX. Conversely 63% of the cells in at the edge of the tumors expressed CAIX. The mathematical model showed that 97% of the cells in the center would express CAXII and 96% of the cells at the edge would express CAIX.
Figure 6
Figure 6
Comparison of tumor cell molecular properties at the invasive edge compared to the tumor core. A) An image panel of center (top) and; B) edge (bottom) regions are displayed to demonstrate examples of each biomarker staining within each area of interest. Scale =100μm. C) Scatter plot of the 10 patient’s (x-axis) CAIX, CXII, Ki67, CC3, GLUT1, HIF-1α and CD34 biomarkers for the center (blue) and edge (orange) regions.

Similar articles

Cited by

References

    1. Longo DL. Tumor heterogeneity and personalized medicine. N Engl J Med. 2012;366:956–7. - PubMed
    1. Gerlinger M, Swanton C. How Darwinian models inform therapeutic failure initiated by clonal heterogeneity in cancer medicine. Br J Cancer. 2010;103:1139–43. - PMC - PubMed
    1. Sottoriva A, Spiteri I, Piccirillo SG, Touloumis A, Collins VP, Marioni JC, et al. Intratumor heterogeneity in human glioblastoma reflects cancer evolutionary dynamics. Proc Natl Acad Sci U S A. 2013;110:4009–14. - PMC - PubMed
    1. Yachida S, Jones S, Bozic I, Antal T, Leary R, Fu B, et al. Distant metastasis occurs late during the genetic evolution of pancreatic cancer. Nature. 2010;467:1114–7. - PMC - PubMed
    1. Greaves M, Maley CC. Clonal evolution in cancer. Nature. 2012;481:306–13. - PMC - PubMed

Publication types

MeSH terms