

Dynamic similarity promotes interpersonal coordination in joint action
- PMID: 27009178
- PMCID: PMC4843673
- DOI: 10.1098/rsif.2015.1093
Dynamic similarity promotes interpersonal coordination in joint action
Abstract
Human movement has been studied for decades, and dynamic laws of motion that are common to all humans have been derived. Yet, every individual moves differently from everyone else (faster/slower, harder/smoother, etc.). We propose here an index of such variability, namely an individual motor signature (IMS) able to capture the subtle differences in the way each of us moves. We show that the IMS of a person is time-invariant and that it significantly differs from those of other individuals. This allows us to quantify the dynamic similarity, a measure of rapport between dynamics of different individuals' movements, and demonstrate that it facilitates coordination during interaction. We use our measure to confirm a key prediction of the theory of similarity that coordination between two individuals performing a joint-action task is higher if their motions share similar dynamic features. Furthermore, we use a virtual avatar driven by an interactive cognitive architecture based on feedback control theory to explore the effects of different kinematic features of the avatar motion on coordination with human players.
Keywords: mathematical modelling; movement dynamics; statistical analysis.
© 2016 The Authors.
Figures


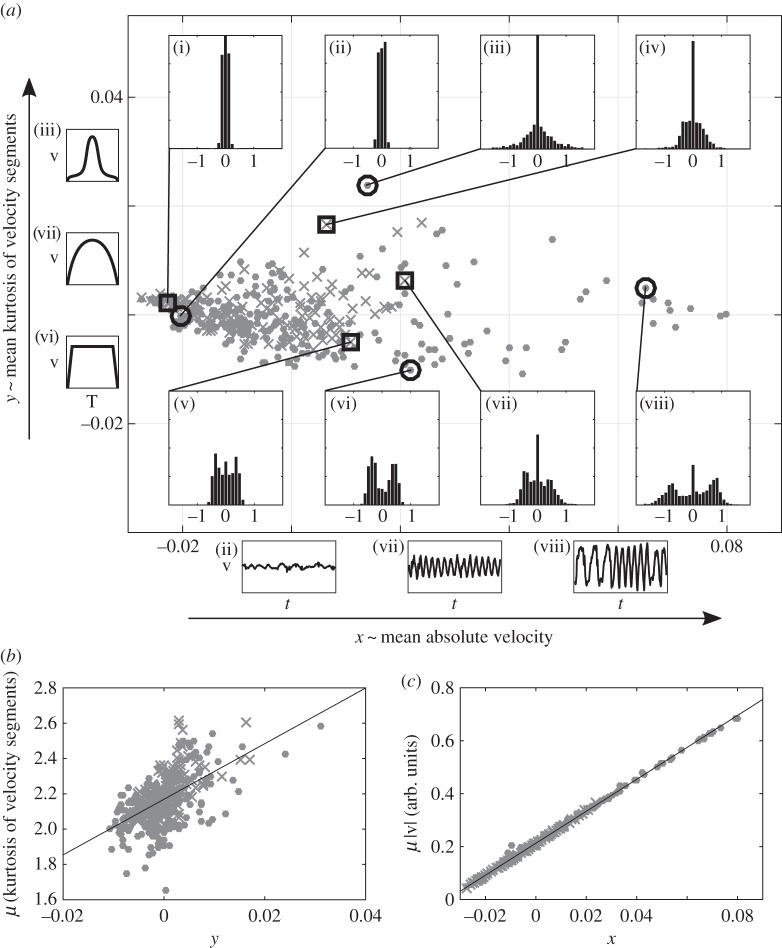
 ), ρ = 0.5685 (pρ = 0). (c) Relation between x-coordinate of the similarity space and average solo velocity of a participant: Corr(x, μ|v|): R2 = 0.9993 (
 ), ρ = 0.9979 (pρ = 0).
Similar articles
-
Rhythm in joint action: psychological and neurophysiological mechanisms for real-time interpersonal coordination.Philos Trans R Soc Lond B Biol Sci. 2014 Dec 19;369(1658):20130394. doi: 10.1098/rstb.2013.0394. Philos Trans R Soc Lond B Biol Sci. 2014. PMID: 25385772 Free PMC article. Review.
-
Modifying upper-limb inter-joint coordination in healthy subjects by training with a robotic exoskeleton.J Neuroeng Rehabil. 2017 Jun 12;14(1):55. doi: 10.1186/s12984-017-0254-x. J Neuroeng Rehabil. 2017. PMID: 28606179 Free PMC article.
-
Kinematic and dynamic synergies of human precision-grip movements.J Neurophysiol. 2005 Oct;94(4):2284-94. doi: 10.1152/jn.01310.2004. Epub 2005 May 25. J Neurophysiol. 2005. PMID: 15917316
-
Role of Gaze Cues in Interpersonal Motor Coordination: Towards Higher Affiliation in Human-Robot Interaction.PLoS One. 2016 Jun 9;11(6):e0156874. doi: 10.1371/journal.pone.0156874. eCollection 2016. PLoS One. 2016. PMID: 27281341 Free PMC article.
-
Strategy of arm movement control is determined by minimization of neural effort for joint coordination.Exp Brain Res. 2016 Jun;234(6):1335-50. doi: 10.1007/s00221-016-4610-z. Epub 2016 Mar 16. Exp Brain Res. 2016. PMID: 26983620 Review.
Cited by
-
Design of a Virtual Player for Joint Improvisation with Humans in the Mirror Game.PLoS One. 2016 Apr 28;11(4):e0154361. doi: 10.1371/journal.pone.0154361. eCollection 2016. PLoS One. 2016. PMID: 27123927 Free PMC article.
-
Beyond in-phase and anti-phase coordination in a model of joint action.Biol Cybern. 2016 Jun;110(2-3):201-16. doi: 10.1007/s00422-016-0691-9. Epub 2016 Jun 8. Biol Cybern. 2016. PMID: 27278609 Free PMC article.
-
Gaze training supports self-organization of movement coordination in children with developmental coordination disorder.Sci Rep. 2019 Feb 8;9(1):1712. doi: 10.1038/s41598-018-38204-z. Sci Rep. 2019. PMID: 30737438 Free PMC article.
-
Unravelling socio-motor biomarkers in schizophrenia.NPJ Schizophr. 2017 Feb 1;3:8. doi: 10.1038/s41537-016-0009-x. eCollection 2017. NPJ Schizophr. 2017. PMID: 28560254 Free PMC article.
-
Playing the mirror game in virtual reality with an autonomous character.Sci Rep. 2022 Dec 9;12(1):21329. doi: 10.1038/s41598-022-25197-z. Sci Rep. 2022. PMID: 36494394 Free PMC article.
References
-
- Schmidt RC, Richardson MJ. 2008. Coordination: neural, behavioral and social dynamics. In Coordination: neural, behavioral and social dynamics, pp. 281–308. Berlin, Germany: Springer.
-
- Hogan N, Flash T. 1987. Moving gracefully: quantitative theories of motor coordination. Trends Neurosci. 10, 170–174. (10.1016/0166-2236(87)90043-9) - DOI
MeSH terms
Grants and funding
LinkOut - more resources
Full Text Sources
Other Literature Sources
Medical
